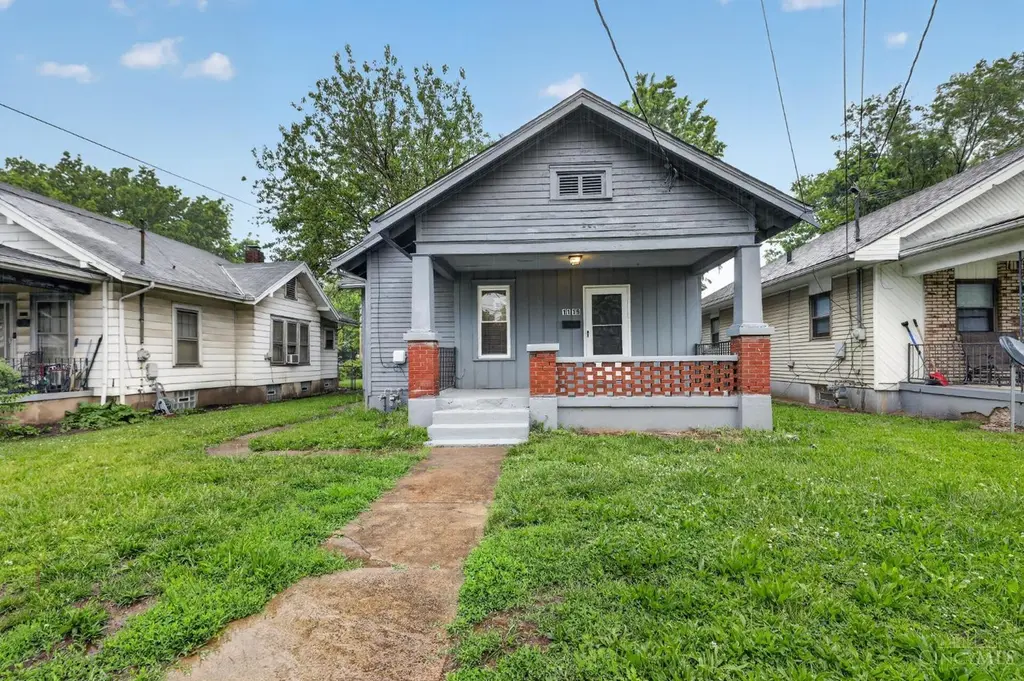
1119 Kunz Ave · Middletown, OH
Flood risk 1/10 · Minimal
- FEMA flood zone
- X (unshaded)
- Chance of flooding over 30 yrs
- 0.0%
- Est. flood insurance / yr
- $473 – $860
Fire risk 1/10 · Minimal
- Est. fire insurance / yr
- $713 – $1,323
Heat risk 4/10 · Minor
- Hot days now (above 103°F)
- 7 days/yr
- Hot days in 30 yrs
- 19 days/yr
Wind risk 2/10 · Minimal
- Chance of severe wind over 30 yrs
- 1.0%
Air-quality risk 3/10 · Minor
- Unhealthy air days now
- 2 days/yr
- Unhealthy air days in 30 yrs
- 3 days/yr
Risk factors via First Street. Map © Google.
Why this score? — see what drove the D+ grade
The composite is a weighted blend of 9 inputs, each scored 0–100. Each bar is that input's sub-score; the figure is the points it added to the 100-point composite (weight × sub-score).
- Cash flow +20.0/30.0
- DSCR +6.3/10.0
- 1% rule +4.5/10.0
- Rent growth +4.1/5.0
- Livability +3.6/5.0
- ARV discount +2.7/15.0
- Condition / age +2.5/5.0
- Schools +2.0/10.0
- Appreciation +0.0/10.0
$124,900
🖨 Deal sheet 📄 Offer letter ✓ Due diligence
Listing remarks
Welcome to this charming 3-bedroom, 1-bathroom cottage in the heart of Middletown! Perfectly suited for first-time buyers or savvy investors, this home offers a cozy and efficient floor plan with a warm, inviting atmosphere. The main living area features large windows for plenty of natural light, while the kitchen provides ample cabinetry and a convenient layout for meal prep. The full basement offers excellent storage solutions or the potential to be finished for additional living space. Outside, the level backyard is a private oasis, perfect for summer BBQs or gardening, complemented by a detached garage for secure parking. Situated on a quiet street, you're just minutes from downtown Mid
Key facts
- Quiet street
- Level backyard
- Full basement
Tags
Property features AI
Finance
- Other: Lease not considered
- HOA & community: No HOA
Exterior
- Utilities: Public water; Public sewer; Cable available
- Home design: Traditional single-family home; One story; Poured foundation; Residential zoning
- Construction: Wood siding; Shingle roof
- Exterior features: Front porch
Interior
- Kitchen: Kitchen approximately 10 x 10; Oven/Range; Refrigerator
- Bedrooms: Three bedrooms on main level; Primary bedroom approximately 11 x 13; Second bedroom approximately 11 x 11; Third bedroom approximately 10 x 10
- Flooring: Wall-to-wall carpet in living and dining rooms
- Bathrooms: One full bathroom on main level
- Heating & cooling: Forced air gas heating; Window air conditioning unit; Gas water heater
- Interior features: Five total rooms; Full unfinished basement; Wall-to-wall carpet in living and dining areas
- Laundry & utility: 220 volt service available
Neighborhood map
What this means for you Summary
Snapshot
- This is a 2-bed/1.0-bath single-family listed at $125k.
Deal economics
- At list price, monthly cash flow is $152 ($2k/yr) — positive.
- The deal already cash-flows at list — no discount required.
- To meet the 1% rule (rent ≥ 1% of price), the offer needs to be $118k (5.2% below list).
- Recommended offer: $118k (5.2% below list) — sets the bar for 1% rule.
- Cap rate 7.8% vs local median 4.5% in Middletown — top-decile yield for the area; either an underpriced asset or a hidden risk that comps aren't pricing in. Stress-test before assuming the spread holds.
Location & tenants
- Location reads 72/100 on livability (#389 in OH) — a middle-class / working-renter tenant base. Strengths: cost of living A+, housing A+, health & safety A+; Watch: schools D+, crime D+, amenities D+.
- Middletown City (suburban): math 21% / reading 28% proficiency, ranked #610 of 656 in OH (top 93%) — low school quality limits family demand, transient renter base, plan for 1-2y turnover; 69% free/reduced lunch — lower-income household profile, screen leases tightly.
- Market conditions: Rents rising fast (+6.3%/yr); 203 active listings in the ZIP; 19 comparable units currently listed for rent nearby; rentals at typical pace (median 24d on market — plan ~3-4 weeks tenant-placement turnaround); 42% of comp listings sitting > 30 days — soft ceiling on asking rent; 1,163 units permitted in Butler County in 2024 (356 in 5+ unit buildings).
Forward outlook
- Local home prices are declining (-3.0%/yr); year-one equity from $864 of loan paydown is wiped out by about $4k of value loss. Plan a longer hold.
Negotiation context
- It's been on market 41 days — a 3% lower offer ($121k) is reasonable based on typical stale-listing flexibility.
- 5 sale attempts since 21y ago with the ask held roughly flat each time — persistent listings suggest the price (not the market) is what's stuck; bring a comps-based counter.
- Current owner paid $100k; 25% above their basis — modest negotiation headroom, anchor on the comps not their cost.
Risks & watch-outs
- Watch-outs: built in 1924 — expect roof / HVAC / electrical / plumbing capex.
Questions for the listing agent
- It's been on market 41 days. Have you received any prior offers? Is the seller open to a 5% concession, seller financing, or rate buy-down credit?
- Built in 1924 — when were the roof, HVAC, electrical panel, plumbing, and water heater last replaced?
- Is there a deadline driving the sale (1031 exchange, divorce, estate, relocation)? That informs how much negotiation room exists.
- Schools are D-rated, which usually means shorter tenancies and higher turnover. Who's the typical renter profile here, and what's been the actual vacancy rate?
- Crime grade is D in this area — have there been break-ins, vandalism, or insurance claims at this property in the last 3 years? What carrier currently insures it and at what premium?
- The area grade is low — what's the realistic commute time and amenity access for the typical tenant pool here? Any planned neighborhood developments (good or bad) we should know about?
- What's the average days-on-market for RENTAL listings here right now (not sales)? A rising rental-DOM trend means longer vacancies and softer asking-rent achievability than the comps imply.
- What's the recent tenant-quality profile in this submarket — average credit score on applications, eviction rate, late-payment / NSF rate, and stable-employment percentage? A property-management company in the area should have these aggregated.
- How much new for-sale + rental construction is in the pipeline within 1–3 miles? Heavy new supply typically softens prices + rents 12–24 months out; constrained supply supports both.
Investment metrics
- 1% rule
- 0.95% ✗
- Cap rate
- 7.76%
- Cash-on-cash
- 5.23%
- DSCR
- 1.23
- GRM
- 8.8
CMA / ARV
- ARV (median comp)
- $112,966
- List price
- $124,900
- Delta
- 10.56%
- Verdict
- OVERPRICED
- Comps
- 20 within 1.0 mi
Show comp detail 12 sales within ~0.75 mi
| Address | Dist | Beds/Ba | Sqft | Sold | Price | $/sf | Match |
|---|---|---|---|---|---|---|---|
| 1404 Young St | 0.19mi | 2/1.0 | 1,002 (-0%) | 7mo | $100,500 | $100 | 85 |
| 1019 Kunz Ave | 0.12mi | 2/1.0 | 1,056 (+5%) | 6mo | $159,500 | $151 | 81 |
| 1212 Pine St | 0.33mi | 2/2.0 | 990 (-2%) | 5mo | $125,000 | $126 | 74 |
| 925 Garden Ave | 0.30mi | 3/1.0 (+1) | 1,048 (+4%) | 2mo | $94,500 | $90 | 73 |
| 709 Fourteenth Ave | 0.51mi | 2/1.5 | 990 (-2%) | 2mo | $115,000 | $116 | 70 |
| 1621 Lafayette Ave | 0.60mi | 2/1.0 | 984 (-2%) | 3mo | $112,000 | $114 | 66 |
| 1503 Brown St | 0.38mi | 2/1.0 | 888 (-12%) | 1mo | $106,000 | $119 | 62 |
| 1206 Parkview Ave | 0.26mi | 2/1.0 | 864 (-14%) | 4mo | $110,000 | $127 | 61 |
| 704 Fourteenth Ave | 0.52mi | 2/1.0 | 864 (-14%) | 0mo | $110,000 | $127 | 52 |
| 1107 Baltimore St | 0.36mi | 3/1.0 (+1) | 1,148 (+14%) | 4mo | $95,500 | $83 | 51 |
| 706 Fourteenth Ave | 0.51mi | 3/1.0 (+1) | 1,152 (+14%) | 2mo | $158,700 | $138 | 46 |
| 608 Fifteenth Ave | 0.57mi | 2/2.0 | 1,128 (+12%) | 7mo | $143,000 | $127 | 44 |
Match score weights: distance 35% · size 25% · config 20% · recency 20%. Top-matched comps best support the ARV.
Projected returns pro-forma
-3.0% appreciation · 6.31% rent growth · sell at horizon
- IRR
- -4.8%
- Equity multiple
- 0.81×
- Total profit
- $-6,495
- Equity at exit
- $18,623
- IRR
- 8.1%
- Equity multiple
- 1.70×
- Total profit
- $24,610
- Equity at exit
- $10,799
Cash invested: $34,972 (down + closing). Projections, not guarantees.
Landlord ↔ Tenant lean methodology
- Overall (STATE)
- 73 Landlord-Friendly
- State Ohio
- 73 Landlord-Friendly · R+6
- County
- — inherits STATE
- City
- — inherits STATE
ZIP-level market 45044
- Rents YoY
- 6.3%
- Active inventory
- 203
- Price-to-rent
- 8.8×
Monthly cashflow live
- Estimated rent
- $1,184 high interval (Pro) →
- Mortgage (P&I)
- −$655
- Tax from tax record
- −$76 /mo · $917/yr
- Insurance
- −$52
- HOA
- −$0
- Vacancy / Maint / Mgmt
- −$249
- Net cashflow
- $152
Break-even live
UW: 25.0% down · 7.5% · 30yr · 1.5% tax · 5.0% vac · 8.0% maint · 8.0% mgmt
Financing live
Cash to close
- Down payment
- $31,225
- Closing costs
- $3,747
- Reserves months
- —
- Total cash needed
- —
Loan-product check · same deal, 3 products live
Conventional
25% down · 7.5% · 30yr
- Down + closing
- —
- Monthly P&I
- —
- Monthly cashflow
- —
- DSCR
- —
- Eligible?
- —
Personal DTI + credit; lowest rate.
DSCR
20% down · 8.5% · 30yr
- Down + closing
- —
- Monthly P&I
- —
- Monthly cashflow
- —
- DSCR
- —
- Eligible?
- —
No personal income docs; deal must DSCR.
Hard money
10% down · 12.0% · 12mo
- Down + closing
- —
- Monthly P&I
- —
- Monthly cashflow
- —
- DSCR
- —
- Eligible?
- —
Short-term bridge; refi at stabilization.
Rent comps 19 comps
| Address | Beds | Baths | Sqft | Rent | $/sqft | DOM | Units | Dist |
|---|---|---|---|---|---|---|---|---|
| 1409 Young St Unit 1 Middletown, OH | 1.0 | 1.0 | 1050 | $950 | $0.90 | 4d | 1 | 0.20mi |
| 702 Baltimore St Middletown, OH | 2.0 | 1.0 | 848 | $895 | $1.06 | 43d | 1 | 0.42mi |
| 907 8th Ave Middletown, OH | 3.0 | 1.5 | 1380 | $1,400 | $1.01 | 17d | 1 | 0.59mi |
| 2000 Pearl St Middletown, OH | 2.0 | 1.0 | 900 | $3,500 | $3.89 | 1d | 4 | 0.64mi |
| 1915 Woodlawn Ave Middletown, OH | 3.0 | 1.5 | 1060 | $1,550 | $1.46 | 43d | 1 | 0.80mi |
| 2101 S Main St Middletown, OH | 1.0–2.0 | 1.0 | 757 | $900 | $1.19 | 1d | 1 | 0.89mi |
| 1302 Central Ave Middletown, OH | 1.0 | 1.0 | 800 | $1,095 | $1.37 | 43d | 1 | 1.00mi |
| 2208 Woodlawn Ave Middletown, OH | 2.0 | 1.0 | 780 | $895 | $1.15 | 43d | 1 | 1.00mi |
| 2310 S Sutphin St Middletown, OH | 2.0 | 1.0 | 967 | $1,025 | $1.06 | 23d | 1 | 1.06mi |
| 2400 Sherman Ave Middletown, OH | 2.0 | 1.0 | 920 | $1,280 | $1.39 | 43d | 1 | 1.15mi |
| 3 N Sutphin St Middletown, OH | 2.0 | 1.0 | 715 | $925 | $1.29 | 4d | 1 | 1.17mi |
| 5 N Sutphin St Middletown, OH | 2.0 | 1.0 | 715 | $925 | $1.29 | 4d | 1 | 1.18mi |
| 206 N Sutphin St Middletown, OH | 2.0 | 1.0 | 900 | $1,400 | $1.56 | 43d | 1 | 1.28mi |
| 202 Harrison St Middletown, OH | 2.0 | 1.0 | 1015 | $895 | $0.88 | 43d | 1 | 1.32mi |
| 108 Shafor St Middletown, OH | 2.0 | 1.0 | 1110 | $925 | $0.83 | 11d | 1 | 1.41mi |
| 108 Shafor St Middletown, OH | 2.0 | 1.0 | 1110 | $925 | $0.83 | 20d | 1 | 1.41mi |
| 1804 Brentwood St Middletown, OH | 3.0 | 1.0 | 1044 | $1,430 | $1.37 | 23d | 1 | 1.43mi |
| 1820 Clarendon Ave Middletown, OH | 2.0 | 1.0 | 1040 | $1,200 | $1.15 | 43d | 1 | 1.45mi |
| 1109 Oxford State Rd Middletown, OH | 2.0 | 1.0 | 744 | $995 | $1.34 | 1d | 1 | 1.45mi |
Listing history 25 events
-
2026-06-18days on market $124,900 Active 41 DOM
-
2026-06-17days on market $124,900 Active 40 DOM
-
2026-06-16days on market $124,900 Active 39 DOM
-
2026-06-15days on market $124,900 Active 38 DOM
-
2026-06-13days on market $124,900 Active 36 DOM
-
2026-06-09days on market $124,900 Active 32 DOM
-
2026-06-08days on market $124,900 Active 31 DOM
-
2026-06-07days on market $124,900 Active 30 DOM
-
2026-06-03days on market $124,900 Active 26 DOM
-
2026-06-02days on market $124,900 Active 25 DOM
-
2026-06-01days on market $124,900 Active 24 DOM
-
2026-05-31days on market $124,900 Active 23 DOM
-
2026-05-08$124,900 Active 829-char remark
-
2018-01-04soldstatus $100,000
-
2007-11-06historical
-
2006-11-06$55,000
-
2006-08-16historical
-
2006-02-15$49,000
-
2006-02-02historical
-
2005-08-03$50,000
-
2005-07-02historical
-
2005-01-02$50,000
-
1987-11-01soldstatus $27,500
-
1987-08-01soldstatus $16,000
-
1984-10-01soldstatus $32,800
ⓘ Source: listings_history table (triggers on properties + properties_extension) + one-shot
backfill from property_details.listing_events for pre-trigger history.
Tax reassessment forecast OH · Partial reset (capped growth)
- Current annual tax
- $917 · $76/mo
- Projected year-2 tax
- $1,433 · $119/mo
- Expected delta
- +$516/yr (+$43/mo · 56.3%)
ⓘ Screening estimate from a state-policy table — verify with the county assessor before closing.
Climate risk First Street
- Flood 1/10 Low FEMA zone X (unshaded) · 0% chance over 30 yrs
- Wildfire 1/10 Low
- Heat 4/10 Moderate 7 d/yr ≥103°F today · 19 d/yr by 30 yrs out
- Wind 2/10 Low 100% chance of damaging wind over 30 yrs
- Air quality 3/10 Moderate 2 unhealthy d/yr today · 3 by 30 yrs out
Nearby sold comps map
Loading sold comps map…
Walkable amenities ~0.75 mi
Loading nearby amenities…
Taxation est. · year 1
- Rental income
- $14,214
- − Mortgage interest
- −$6,996
- − Property taxes
- −$917
- − Insurance
- −$624
- − Repairs & maintenance
- −$1,137
- − Management
- −$1,137
- − Depreciation
- −$3,633
- Taxable loss
- −$232
- Est. tax savings @ 24.0%
- +$56
- After-tax cash flow
- $1,883/yr
For passive investors: Depreciation is non-cash, so a rental often shows a tax loss while cash-flowing — sheltering income. Rental losses are passive: they offset passive income freely, and up to $25,000/yr can offset ordinary (W-2) income if you actively participate and your MAGI is under $100k (phasing out to $0 by $150k); unused losses carry forward. On sale, claimed depreciation is recaptured at up to 25%, and gains may owe capital-gains tax (a 1031 exchange can defer both). Figures are a year-1 estimate at your 24.0% rate — not tax advice; consult a CPA.
Schools (NCES district)
- District
- Middletown City
- NCES district ID
- 3904440
- Math proficiency
- 21% ▼ -17.00%
- Reading proficiency
- 28% ▼ -15.00%
- Median HH income
- $36,650
- Composite
- 20.35/100
- National rank
- #8605
- State rank
- #610 of 656 in OH
Livability — Middletown
- Score
- 72/100
- State rank
- #389
- US rank
- #6338
Category grades
Schools grade is shown separately in the Schools card above.
Census & demographics
- Census place
- Middletown, OH
- County
- Butler County · 381,674 people
- City population
- 96,117
- Metro
- Cincinnati, OH-KY-IN
- Population (ZIP)
- 56,217
- Household income
- $73,732
- Rent vs Own
- Severe rent burden
- 1532.0
Population outlook (Butler County) Hauer SSP2
- Today (2025)
- 387,706 people
- By 2030
- 392,028 · +1.1%
- By 2040
- 395,307 · +2.0%
- By 2050
- 391,116 · +0.9%
- By 2075
- 378,642 · -2.3%
- By 2100
- 343,248 · -11.5%
Race, ethnicity, and origin ACS 2023
- Neighborhood character
- Predominantly White (72%)
- Race & ethnicity
- White 72% Black 12% Two or more races 8% Hispanic / Latino 7% Asian 2%
- Hispanic origin (detail)
- Mexican 2% Dominican 1%
- Common ancestry
- Slovak 2% Italian 2% Romanian 2%
- Foreign-born
- 6% · Canada
- Languages at home
- 92% English-only · Spanish 4% Other Indo-European 1% Tagalog/Filipino 1%
Political lean MEDSL · Butler
- 2024 margin
- Strong R (+26.3) · D 36.4% · R 62.7%
- 2008→2024 swing
- -3.6pp toward R · 2008: -22.6pp · 2024: -26.3pp
- All cycles
- 2024: R+26.3 2020: R+24.0 2016: R+28.3 2012: R+26.2 2008: R+22.6
Not yet ingested
- Civics
- —
Market trends
- HPI YoY
- ▼ -164.07%
- Current HPI
- 219.0479
- Rent YoY
- ▲ 6.31%
- Metro
- Cincinnati, OH-KY-IN
- State GDP YoY
- ▲ 1.98%
- F500 in state
- 48
Industry mix (Fortune 500 HQ in OH)
| Industry | F500 HQs | Revenue |
|---|---|---|
| Insurance | 3 | $145B |
|
||
| Industrial Machinery | 3 | $49B |
|
||
| Financial Services | 3 | $24B |
|
||
| Consumer Goods | 2 | $93B |
|
||
| Aerospace / Defense | 2 | $47B |
|
||
| Utilities | 2 | $33B |
|
||
Price history
+280.8% since first listed13 events — show timeline
- 2026-05-08 Listed $124,900 Cincy MLS
- 2018-01-04 Sold (Public Records) $100,000 Public Records
- 2007-11-06 Listing Removed — Cincy MLS
- 2006-11-06 Listed $55,000 Cincy MLS
- 2006-08-16 Listing Removed — Cincy MLS
- 2006-02-15 Listed $49,000 Cincy MLS
- 2006-02-02 Listing Removed — Cincy MLS
- 2005-08-03 Listed $50,000 Cincy MLS
- 2005-07-02 Listing Removed — Cincy MLS
- 2005-01-02 Listed $50,000 Cincy MLS
- 1987-11-01 Sold (Public Records) $27,500 Public Records
- 1987-08-01 Sold (Public Records) $16,000 Public Records
- 1984-10-01 Sold (Public Records) $32,800 Public Records
Property tax history
+1.1%/yrLatest (2025): $917 · +1.1% YoY. Source: county tax records.
Cash-flow waterfall
monthlySold comps — $/sqft
last 12 mo · ≤1 miLoading sold comps…