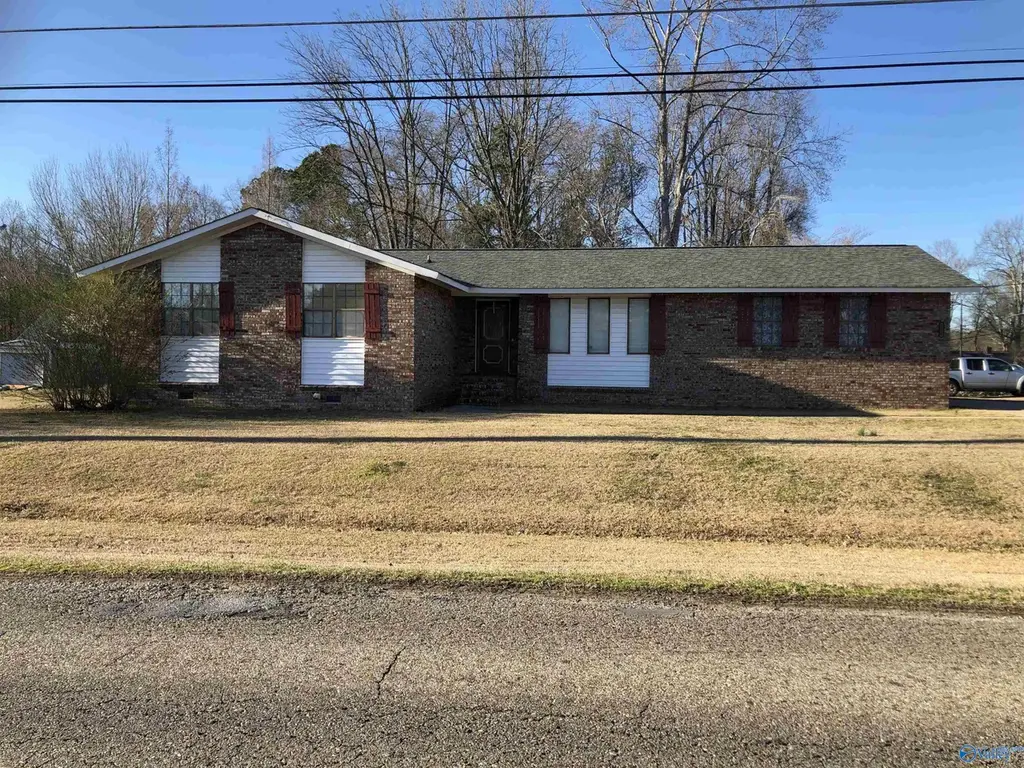
2126 Cedar Bend Rd · Southside, AL
Flood risk 1/10 · Minimal
- FEMA flood zone
- X (unshaded)
- Chance of flooding over 30 yrs
- 0.0%
- Est. flood insurance / yr
- $507 – $1,088
Fire risk 4/10 · Minor
- Est. fire insurance / yr
- $916 – $1,700
Heat risk 6/10 · Moderate
- Hot days now (above 106°F)
- 7 days/yr
- Hot days in 30 yrs
- 19 days/yr
Wind risk 5/10 · Moderate
- Chance of severe wind over 30 yrs
- 25.0%
Air-quality risk 2/10 · Minimal
- Unhealthy air days now
- 1 days/yr
- Unhealthy air days in 30 yrs
- 2 days/yr
Risk factors via First Street. Map © Google.
Why this score? — see what drove the D grade
The composite is a weighted blend of 9 inputs, each scored 0–100. Each bar is that input's sub-score; the figure is the points it added to the 100-point composite (weight × sub-score).
- Cash flow +16.3/30.0
- ARV discount +6.9/15.0
- DSCR +5.0/10.0
- Livability +3.4/5.0
- 1% rule +3.1/10.0
- Schools +3.1/10.0
- Rent growth +2.5/5.0
- Condition / age +2.5/5.0
- Appreciation +0.0/10.0
$239,900
🖨 Deal sheet (PDF) 📄 Offer letter ✓ Due diligence
Listing remarks MLS
New Listing! Motivated Seller!!! Well maintained 3 bedroom, 2 bath home featuring den w/fireplace, eat-in-kitchen, formal dining room, laundry room, hardwoods and tile throughout, covered rear deck @ 2 car garage.
Key facts
- Formal dining room
- Laundry room
- Eat-in kitchen
Tags
Neighborhood map
What this means for you Summary
Snapshot
- This is a 3-bed/2.0-bath single-family listed at $240k.
Deal economics
- At list price, monthly cash flow is $130 ($2k/yr) — positive.
- The deal already cash-flows at list — no discount required.
- To meet the 1% rule (rent ≥ 1% of price), the offer needs to be $195k (18.9% below list).
- Recommended offer: $195k (18.9% below list) — sets the bar for 1% rule.
- Cap rate 6.9% vs local median 3.5% in Southside — top-decile yield for the area; either an underpriced asset or a hidden risk that comps aren't pricing in. Stress-test before assuming the spread holds.
Location & tenants
- Location reads 68/100 on livability (#73 in AL) — a middle-class / working-renter tenant base. Strengths: crime A+, cost of living A+, housing A+; Watch: amenities F, commute F, health & safety F.
- Etowah County (suburban): math 21% / reading 52% proficiency, ranked #36 of 129 in AL (top 28%) — families likely to look elsewhere, expect single-tenant / working-renter base with shorter leases.
- Zoned schools: Southside Elementary School (math 41% / reading 74%, grade C+, #74 of 627 statewide, top 12%, 570 students, 43% FRL); Rainbow Middle School (math 17% / reading 56%, grade F, #76 of 257 statewide, top 31%, 625 students, 48% FRL); Southside High School (math 22% / reading 32%, grade F, #90 of 305 statewide, top 35%, 770 students, 42% FRL) — zoned schools at 44% FRL track the district average.
- Market conditions: 80 active listings in the ZIP; 2 comparable units currently listed for rent nearby; 119 units permitted in Etowah County in 2024 (0 in 5+ unit buildings).
Forward outlook
- Local home prices are declining (-3.0%/yr); year-one equity from $2k of loan paydown is wiped out by about $7k of value loss. Plan a longer hold.
- Etowah County population projected at -12% by 2050 — secular population decline; favor cash flow + early exit over multi-decade hold.
Negotiation context
- It's been on market 427 days — a 12% lower offer ($211k) is reasonable based on typical stale-listing flexibility.
- 4 sale attempts since 12y ago; this cycle's ask has dropped $15k (6%) from the opening price — seller is motivated, your offer sets the floor, not the list.
- Current owner paid $83k; list at $240k implies a 189% gain — meaningful room to come down on a strong offer.
Risks & watch-outs
- Climate carrying-cost: moderate wind risk, 25% chance of damaging wind over 30y; extreme-heat days projected 7→19/yr by 2055 (HVAC capex compounding) — expect insurance premiums to compound above CPI over the hold.
Questions for the listing agent
- It's been on market 427 days. Have you received any prior offers? Is the seller open to a 19% concession, seller financing, or rate buy-down credit?
- Built in 1979 — when were the roof, HVAC, electrical panel, plumbing, and water heater last replaced?
- Why hasn't it sold? Are there any deal-killer items the seller is aware of (foundation, flood, title, zoning, code violations)?
- Is there a deadline driving the sale (1031 exchange, divorce, estate, relocation)? That informs how much negotiation room exists.
- The area grade is low — what's the realistic commute time and amenity access for the typical tenant pool here? Any planned neighborhood developments (good or bad) we should know about?
- What's the average days-on-market for RENTAL listings here right now (not sales)? A rising rental-DOM trend means longer vacancies and softer asking-rent achievability than the comps imply.
- What's the recent tenant-quality profile in this submarket — average credit score on applications, eviction rate, late-payment / NSF rate, and stable-employment percentage? A property-management company in the area should have these aggregated.
- How much new for-sale + rental construction is in the pipeline within 1–3 miles? Heavy new supply typically softens prices + rents 12–24 months out; constrained supply supports both.
Investment metrics
- 1% rule
- 0.81% ✗
- Cap rate
- 6.94%
- Cash-on-cash
- 2.32%
- DSCR
- 1.10
- GRM
- 10.3
CMA / ARV
- ARV (median comp)
- $237,001
- List price
- $239,900
- Delta
- 1.22%
- Verdict
- FAIR
- Comps
- 20 within 1.0 mi
Show comp detail 12 sales within ~0.75 mi
| Address | Dist | Beds/Ba | Sqft | Sold | Price | $/sf | Match |
|---|---|---|---|---|---|---|---|
| 2000 Cedar Bend Rd N | 0.06mi | 2/2.0 (-1) | 1,615 (-6%) | 4mo | $299,900 | $186 | 80 |
| 2130 Meadowood Dr | 0.15mi | 3/2.0 | 1,600 (-6%) | 4mo | $259,900 | $162 | 79 |
| 2075 Jane Ln | 0.43mi | 3/2.0 | 1,603 (-6%) | 2mo | $249,900 | $156 | 68 |
| 2612 Robertson St E | 0.65mi | 3/2.0 | 1,657 (-3%) | 2mo | $230,100 | $139 | 63 |
| 2245 Waterfront Dr | 0.63mi | 3/2.0 | 1,657 (-3%) | 5mo | $270,000 | $163 | 62 |
| 2603 Sunnydale Dr | 0.58mi | 3/2.0 | 1,620 (-5%) | 7mo | $220,000 | $136 | 59 |
| 2838 Lister Ferry Rd | 0.70mi | 3/2.0 | 1,796 (+5%) | 10mo | $340,000 | $189 | 50 |
| 2573 Western Hills Dr E | 0.64mi | 3/2.0 | 1,520 (-11%) | 5mo | $217,500 | $143 | 48 |
| 2561 Robertson St E | 0.66mi | 3/2.0 | 1,844 (+8%) | 10mo | $304,900 | $165 | 48 |
| 2801 Lister Ferry Rd | 0.64mi | 3/2.0 | 1,830 (+7%) | 13mo | $351,000 | $192 | 47 |
| 2210 Madison Loop | 0.43mi | 3/2.0 | 1,500 (-12%) | 16mo | $240,000 | $160 | 46 |
| 2677 Robertson St E | 0.70mi | 3/2.0 | 1,945 (+14%) | 16mo | $277,500 | $143 | 31 |
Match score weights: distance 35% · size 25% · config 20% · recency 20%. Top-matched comps best support the ARV.
Projected returns pro-forma
-3.0% appreciation · 3.0% rent growth · sell at horizon
- IRR
- -12.7%
- Equity multiple
- 0.54×
- Total profit
- $-30,741
- Equity at exit
- $35,770
- IRR
- -3.7%
- Equity multiple
- 0.75×
- Total profit
- $-16,640
- Equity at exit
- $20,742
Cash invested: $67,172 (down + closing). Projections, not guarantees.
Landlord ↔ Tenant lean methodology
- Overall (STATE)
- 90 Strongly Landlord-Friendly
- State Alabama
- 90 Strongly Landlord-Friendly · R+15
- County
- — inherits STATE
- City
- — inherits STATE
ZIP-level market 35907
- Home prices YoY
- -25.9%
- Active inventory
- 80
- Price-to-rent
- 10.3×
Monthly cashflow live
- Estimated rent
- $1,946 medium interval (Pro) →
- Mortgage (P&I)
- −$1,258
- Tax from tax record
- −$50 /mo · $598/yr
- Insurance
- −$100
- HOA
- −$0
- Vacancy / Maint / Mgmt
- −$409
- Net cashflow
- $130
Break-even live
Sensitivity live
| Price | -10% $265 | -5% $198 | +0% $130 | +5% $62 | +10% $-6 |
|---|---|---|---|---|---|
| Rent | -10% $-24 | -5% $53 | +0% $130 | +5% $207 | +10% $283 |
| Rate | -1.0pp $250 | -0.5pp $191 | base $130 | +0.5pp $67 | +1.0pp $4 |
UW: 25.0% down · 7.5% · 30yr · 1.5% tax · 5.0% vac · 8.0% maint · 8.0% mgmt
Financing live
Cash to close
- Down payment
- $59,975
- Closing costs
- $7,197
- Reserves months
- —
- Total cash needed
- —
Loan-product check · same deal, 3 products live
Conventional
25% down · 7.5% · 30yr
- Down + closing
- —
- Monthly P&I
- —
- Monthly cashflow
- —
- DSCR
- —
- Eligible?
- —
Personal DTI + credit; lowest rate.
DSCR
20% down · 8.5% · 30yr
- Down + closing
- —
- Monthly P&I
- —
- Monthly cashflow
- —
- DSCR
- —
- Eligible?
- —
No personal income docs; deal must DSCR.
Hard money
10% down · 12.0% · 12mo
- Down + closing
- —
- Monthly P&I
- —
- Monthly cashflow
- —
- DSCR
- —
- Eligible?
- —
Short-term bridge; refi at stabilization.
Rent comps 2 comps
| Address | Beds | Baths | Sqft | Rent | $/sqft | DOM | Units | Dist |
|---|---|---|---|---|---|---|---|---|
| 2214 Windsong Trl Gadsden, AL | 3.0 | 2.5 | 2200 | $2,000 | $0.91 | 5d | 1 | 0.10mi |
| 3166 Jenkins Cir S Gadsden, AL | 3.0 | 1.5 | 1350 | $1,385 | $1.03 | 13d | 1 | 1.10mi |
Listing history 8 events
-
2026-04-06price $239,900 213-char remark
Show marketing remark (213 chars)
New Listing! Motivated Seller!!! Well maintained 3 bedroom, 2 bath home featuring den w/fireplace, eat-in-kitchen, formal dining room, laundry room, hardwoods and tile throughout, covered rear deck @ 2 car garage.
-
2026-02-10status Active 213-char remark
Show marketing remark (213 chars)
New Listing! Motivated Seller!!! Well maintained 3 bedroom, 2 bath home featuring den w/fireplace, eat-in-kitchen, formal dining room, laundry room, hardwoods and tile throughout, covered rear deck @ 2 car garage.
-
2025-11-12price $249,900 213-char remark
Show marketing remark (213 chars)
New Listing! Motivated Seller!!! Well maintained 3 bedroom, 2 bath home featuring den w/fireplace, eat-in-kitchen, formal dining room, laundry room, hardwoods and tile throughout, covered rear deck @ 2 car garage.
-
2025-09-03status Active 213-char remark
Show marketing remark (213 chars)
New Listing! Motivated Seller!!! Well maintained 3 bedroom, 2 bath home featuring den w/fireplace, eat-in-kitchen, formal dining room, laundry room, hardwoods and tile throughout, covered rear deck @ 2 car garage.
-
2025-09-03price $252,400 213-char remark
Show marketing remark (213 chars)
New Listing! Motivated Seller!!! Well maintained 3 bedroom, 2 bath home featuring den w/fireplace, eat-in-kitchen, formal dining room, laundry room, hardwoods and tile throughout, covered rear deck @ 2 car garage.
-
2025-02-28$254,900 Active 213-char remark
Show marketing remark (213 chars)
New Listing! Motivated Seller!!! Well maintained 3 bedroom, 2 bath home featuring den w/fireplace, eat-in-kitchen, formal dining room, laundry room, hardwoods and tile throughout, covered rear deck @ 2 car garage.
-
2014-05-08soldstatus $83,000 185-char remark
Show marketing remark (185 chars)
New Listing- Southside- This home has 3 bedrooms, 2 baths, dining room, kitchen with breakfast area. You also have a nice family room with a fireplace, covered deck and a double garage.
-
2014-02-10$115,500 185-char remark
Show marketing remark (185 chars)
New Listing- Southside- This home has 3 bedrooms, 2 baths, dining room, kitchen with breakfast area. You also have a nice family room with a fireplace, covered deck and a double garage.
ⓘ Source: listings_history table (triggers on properties + properties_extension) + one-shot
backfill from property_details.listing_events for pre-trigger history.
Tax reassessment forecast AL · Resets to sale price
- Current annual tax
- $598 · $50/mo
- Projected year-2 tax
- $984 · $82/mo
- Expected delta
- +$386/yr (+$32/mo · 64.5%)
ⓘ Screening estimate from a state-policy table — verify with the county assessor before closing.
Climate risk First Street
- Flood 1/10 Low FEMA zone X (unshaded) · 0% chance over 30 yrs
- Wildfire 4/10 Moderate
- Heat 6/10 Major 7 d/yr ≥106°F today · 19 d/yr by 30 yrs out
- Wind 5/10 Major 25% chance of damaging wind over 30 yrs
- Air quality 2/10 Low 1 unhealthy d/yr today · 2 by 30 yrs out
Nearby sold comps map
Loading sold comps map…
Walkable amenities ~0.75 mi
Loading nearby amenities…
Taxation est. · year 1
- Rental income
- $23,355
- − Mortgage interest
- −$13,438
- − Property taxes
- −$598
- − Insurance
- −$1,200
- − Repairs & maintenance
- −$1,868
- − Management
- −$1,868
- − Depreciation
- −$6,979
- Taxable loss
- −$2,597
- Est. tax savings @ 24.0%
- +$623
- After-tax cash flow
- $2,179/yr
For passive investors: Depreciation is non-cash, so a rental often shows a tax loss while cash-flowing — sheltering income. Rental losses are passive: they offset passive income freely, and up to $25,000/yr can offset ordinary (W-2) income if you actively participate and your MAGI is under $100k (phasing out to $0 by $150k); unused losses carry forward. On sale, claimed depreciation is recaptured at up to 25%, and gains may owe capital-gains tax (a 1031 exchange can defer both). Figures are a year-1 estimate at your 24.0% rate — not tax advice; consult a CPA.
Schools (NCES district)
- District
- Etowah County
- NCES district ID
- 0101380
- Math proficiency
- 21% ▼ -28.00%
- Reading proficiency
- 52% ▼ -1.00%
- Median HH income
- $46,403
- Composite
- 31.12/100
- National rank
- #6062
- State rank
- #36 of 129 in AL
Livability — Southside
- Score
- 68/100
- State rank
- #73
- US rank
- #9908
Category grades
Schools grade is shown separately in the Schools card above.
Census & demographics
- Census place
- Southside, AL
- City population
- 9,299
- Population (ZIP)
- 9,299
Population outlook (Etowah County) Hauer SSP2
- Today (2025)
- 100,500 people
- By 2030
- 98,488 · -2.0%
- By 2040
- 93,731 · -6.7%
- By 2050
- 88,681 · -11.8%
- By 2075
- 76,746 · -23.6%
- By 2100
- 65,373 · -35.0%
Race, ethnicity, and origin ACS 2023
- Neighborhood character
- Predominantly White (90%)
- Race & ethnicity
- White 90% Black 4% Hispanic / Latino 3% Two or more races 2%
- Common ancestry
- Italian 2% Scottish 2% Slovak 1%
- Foreign-born
- 1% · Canada
- Languages at home
- 98% English-only · Spanish 2%
Political lean MEDSL · Etowah
- 2024 margin
- Solid R (+55.7) · D 21.8% · R 77.5%
- 2008→2024 swing
- -17.5pp toward R · 2008: -38.2pp · 2024: -55.7pp
- All cycles
- 2024: R+55.7 2020: R+50.2 2016: R+50.1 2012: R+38.4 2008: R+38.2
Not yet ingested
- Civics
- —
Market trends
- HPI YoY
- ▼ -72.98%
- Current HPI
- 208.5419
- Rent YoY
- —
- Metro
- —
- State GDP YoY
- ▲ 2.94%
- F500 in state
- 4
Industry mix (Fortune 500 HQ in AL)
| Industry | F500 HQs | Revenue |
|---|---|---|
| Financial Services | 1 | $8B |
|
||
| Healthcare | 1 | $5B |
|
||
Price history
+107.7% since first listed8 events — show timeline
- 2026-04-06 Price Changed $239,900 VMLS
- 2026-02-10 Relisted — VMLS
- 2025-11-12 Price Changed $249,900 VMLS
- 2025-09-03 Relisted — VMLS
- 2025-09-03 Price Changed $252,400 VMLS
- 2025-02-28 Listed $254,900 VMLS
- 2014-05-08 Sold (MLS) $83,000 VMLS
- 2014-02-10 Listed $115,500 VMLS
Property tax history
+6.5%/yrLatest (2025): $598 · +0.0% YoY. Source: county tax records.
Cash-flow waterfall
monthlySold comps — $/sqft
last 12 mo · ≤1 miLoading sold comps…