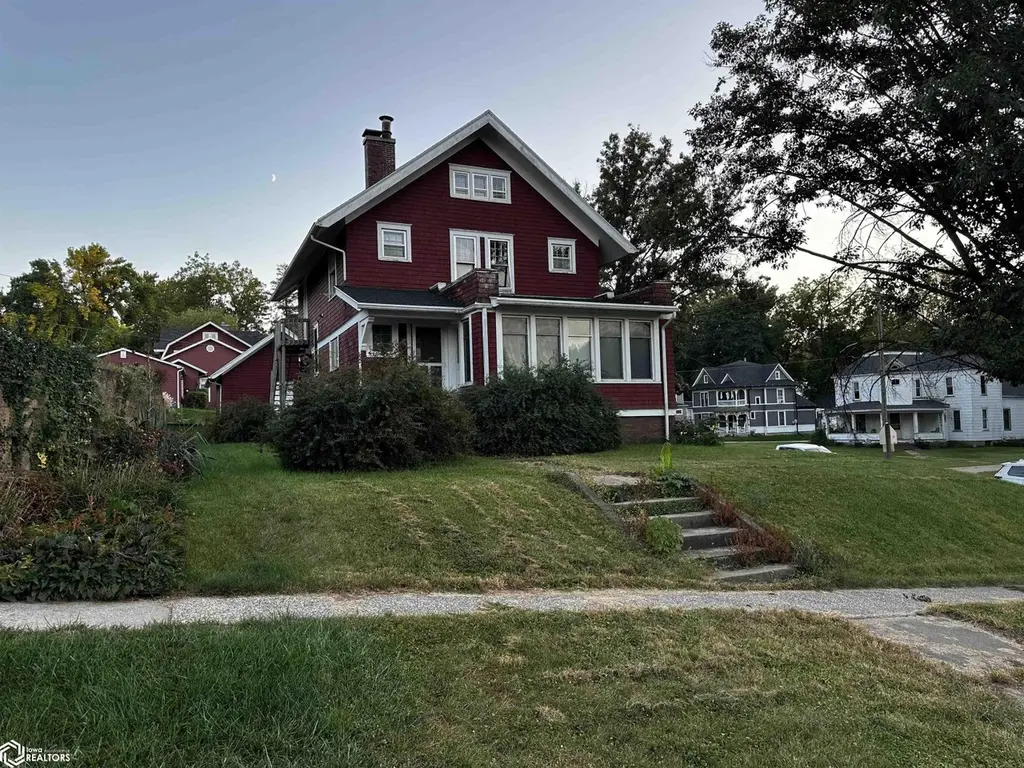
1100 Chestnut St · Atlantic, IA
Flood risk 1/10 · Minimal
- FEMA flood zone
- X (unshaded)
- Chance of flooding over 30 yrs
- 0.0%
- Est. flood insurance / yr
- $473 – $860
Fire risk 2/10 · Minimal
- Est. fire insurance / yr
- $902 – $1,676
Heat risk 3/10 · Minor
- Hot days now (above 103°F)
- 7 days/yr
- Hot days in 30 yrs
- 15 days/yr
Wind risk 2/10 · Minimal
- Chance of severe wind over 30 yrs
- —
Air-quality risk 1/10 · Minimal
- Unhealthy air days now
- 0 days/yr
- Unhealthy air days in 30 yrs
- 0 days/yr
Risk factors via First Street. Map © Google.
Why this score? — see what drove the C+ grade
The composite is a weighted blend of 9 inputs, each scored 0–100. Each bar is that input's sub-score; the figure is the points it added to the 100-point composite (weight × sub-score).
- Cash flow +21.6/30.0
- ARV discount +15.0/15.0
- DSCR +6.9/10.0
- 1% rule +6.4/10.0
- Schools +5.9/10.0
- Livability +3.7/5.0
- Rent growth +2.5/5.0
- Condition / age +2.5/5.0
- Appreciation +0.0/10.0
$110,000
🖨 Deal sheet 📄 Offer letter ✓ Due diligence
Listing remarks MLS
Motivated seller! This 4 bedroom, 2 bathroom home is full of original character and sits on a desirable corner lot in the heart of Atlantic within walking distance to the YMCA and middle schools. You’ll enjoy off-street parking and a 2-car garage located in the alley behind the house. Inside, you’ll find the gorgeous original hardwood floors, abundant storage, and spacious layout. The home has already seen a few important updates, including a brand-new roof and newer water heater. Upstairs, the 3rd-level studio apartment presents a fantastic project opportunity—ready for your vision to create the perfect guest suite, rental unit, or creative space. With so much character and potential, this property is a must-see!
Key facts
- 2 car garage
- Off-street parking
- Abundant storage
Tags
Neighborhood map
What this means for you Summary
Snapshot
- This is a 4-bed/3.0-bath single-family listed at $110k.
Deal economics
- At list price, monthly cash flow is $167 ($2k/yr) — positive.
- The deal already cash-flows at list — no discount required.
- Meets the 1% rule at list price ($1k rent vs $110k).
- Recommended offer: $97k (12.0% below list) — sets the bar for market timing.
- Cap rate 8.1% vs local median 3.0% in Atlantic — top-decile yield for the area; either an underpriced asset or a hidden risk that comps aren't pricing in. Stress-test before assuming the spread holds.
Location & tenants
- Location reads 74/100 on livability (#243 in IA, #4,704 nationally) — a middle-class / working-renter tenant base. Strengths: cost of living A+, housing A+, health & safety B+; Watch: crime D+, amenities F, commute F.
- Atlantic Community School District (town): math 68% / reading 72% proficiency, ranked #155 of 289 in IA (top 54%) — strong family-tenant draw, lease renewals of 3-5y typical.
- Market conditions: 49 active listings in the ZIP; 14 units permitted in Cass County in 2024 (0 in 5+ unit buildings).
Forward outlook
- Local home prices are declining (-3.0%/yr); year-one equity from $761 of loan paydown is wiped out by about $3k of value loss. Plan a longer hold.
- Cass County population projected at -20% by 2050 — secular population decline; favor cash flow + early exit over multi-decade hold.
Negotiation context
- It's been on market 261 days — a 12% lower offer ($97k) is reasonable based on typical stale-listing flexibility.
- 7 sale attempts since 12y ago; this cycle's ask has dropped $15k (12%) from the opening price — seller is motivated, your offer sets the floor, not the list.
- Current owner paid $88k; 26% above their basis — modest negotiation headroom, anchor on the comps not their cost.
Risks & watch-outs
- Watch-outs: built in 1910 — expect roof / HVAC / electrical / plumbing capex.
Questions for the listing agent
- It's been on market 261 days. Have you received any prior offers? Is the seller open to a 12% concession, seller financing, or rate buy-down credit?
- Built in 1910 — when were the roof, HVAC, electrical panel, plumbing, and water heater last replaced?
- Why hasn't it sold? Are there any deal-killer items the seller is aware of (foundation, flood, title, zoning, code violations)?
- Is there a deadline driving the sale (1031 exchange, divorce, estate, relocation)? That informs how much negotiation room exists.
- Crime grade is D in this area — have there been break-ins, vandalism, or insurance claims at this property in the last 3 years? What carrier currently insures it and at what premium?
- What's the average days-on-market for RENTAL listings here right now (not sales)? A rising rental-DOM trend means longer vacancies and softer asking-rent achievability than the comps imply.
- What's the recent tenant-quality profile in this submarket — average credit score on applications, eviction rate, late-payment / NSF rate, and stable-employment percentage? A property-management company in the area should have these aggregated.
- How much new for-sale + rental construction is in the pipeline within 1–3 miles? Heavy new supply typically softens prices + rents 12–24 months out; constrained supply supports both.
Investment metrics
- 1% rule
- 1.14% ✓
- Cap rate
- 8.11%
- Cash-on-cash
- 6.50%
- DSCR
- 1.29
- GRM
- 7.3
CMA / ARV
- ARV (median comp)
- $188,409
- List price
- $110,000
- Delta
- -41.62%
- Verdict
- UNDERPRICED
- Comps
- 20 within 1.0 mi
Show comp detail 12 sales within ~0.75 mi
| Address | Dist | Beds/Ba | Sqft | Sold | Price | $/sf | Match |
|---|---|---|---|---|---|---|---|
| 900 Chestnut St | 0.15mi | 3/2.0 (-1) | 2,037 (-0%) | 10mo | $157,000 | $77 | 76 |
| 1402 Chestnut St | 0.23mi | 4/2.0 | 2,157 (+6%) | 10mo | $190,000 | $88 | 68 |
| 1006 Locust St | 0.15mi | 3/1.0 (-1) | 1,904 (-7%) | 3mo | $60,000 | $32 | 66 |
| 1405 Olive St | 0.54mi | 4/2.5 | 2,071 (+1%) | 7mo | $184,500 | $89 | 65 |
| 505 Maple St | 0.44mi | 4/2.0 | 2,156 (+5%) | 3mo | $168,000 | $78 | 64 |
| 1806 Sycamore Ave | 0.55mi | 4/2.0 | 2,144 (+5%) | 5mo | $200,000 | $93 | 58 |
| 107 E 13 St | 0.16mi | 3/2.0 (-1) | 1,827 (-11%) | 9mo | $186,000 | $102 | 58 |
| 102 E 12th St | 0.09mi | 3/1.5 (-1) | 1,802 (-12%) | 11mo | $194,500 | $108 | 56 |
| 501 Elm St | 0.44mi | 3/1.0 (-1) | 1,868 (-9%) | 4mo | $98,000 | $52 | 49 |
| 606 W 6th St | 0.61mi | 3/2.0 (-1) | 1,936 (-5%) | 6mo | $50,000 | $26 | 49 |
| 1824 Bryn Mawr Cir | 0.54mi | 3/2.5 (-1) | 2,275 (+11%) | 7mo | $228,000 | $100 | 43 |
| 305 E 21st St | 0.68mi | 4/3.0 | 1,796 (-12%) | 8mo | $302,000 | $168 | 42 |
Match score weights: distance 35% · size 25% · config 20% · recency 20%. Top-matched comps best support the ARV.
Projected returns pro-forma
-3.0% appreciation · 3.0% rent growth · sell at horizon
- IRR
- -6.3%
- Equity multiple
- 0.77×
- Total profit
- $-7,150
- Equity at exit
- $16,401
- IRR
- 3.4%
- Equity multiple
- 1.25×
- Total profit
- $7,677
- Equity at exit
- $9,511
Cash invested: $30,800 (down + closing). Projections, not guarantees.
Landlord ↔ Tenant lean methodology
- Overall (STATE)
- 83 Strongly Landlord-Friendly
- State Iowa
- 83 Strongly Landlord-Friendly · R+6
- County
- — inherits STATE
- City
- — inherits STATE
ZIP-level market 50022
- Home prices YoY
- -28.8%
- Active inventory
- 49
- Price-to-rent
- 7.3×
Monthly cashflow live
- Estimated rent
- $1,251 medium interval (Pro) →
- Mortgage (P&I)
- −$577
- Tax from tax record
- −$199 /mo · $2,388/yr
- Insurance
- −$46
- HOA
- −$0
- Vacancy / Maint / Mgmt
- −$263
- Net cashflow
- $167
Break-even live
UW: 25.0% down · 7.5% · 30yr · 1.5% tax · 5.0% vac · 8.0% maint · 8.0% mgmt
Financing live
Cash to close
- Down payment
- $27,500
- Closing costs
- $3,300
- Reserves months
- —
- Total cash needed
- —
Loan-product check · same deal, 3 products live
Conventional
25% down · 7.5% · 30yr
- Down + closing
- —
- Monthly P&I
- —
- Monthly cashflow
- —
- DSCR
- —
- Eligible?
- —
Personal DTI + credit; lowest rate.
DSCR
20% down · 8.5% · 30yr
- Down + closing
- —
- Monthly P&I
- —
- Monthly cashflow
- —
- DSCR
- —
- Eligible?
- —
No personal income docs; deal must DSCR.
Hard money
10% down · 12.0% · 12mo
- Down + closing
- —
- Monthly P&I
- —
- Monthly cashflow
- —
- DSCR
- —
- Eligible?
- —
Short-term bridge; refi at stabilization.
Listing history 28 events
-
2026-06-18days on market $110,000 Active 261 DOM
-
2026-06-17days on market $110,000 Active 260 DOM
-
2026-06-16days on market $110,000 Active 259 DOM
-
2026-06-15days on market $110,000 Active 258 DOM
-
2026-06-13days on market $110,000 Active 256 DOM
-
2026-06-12days on market $110,000 Active 255 DOM
-
2026-06-09days on market $110,000 Active 252 DOM
-
2026-06-08days on market $110,000 Active 251 DOM
-
2026-06-07days on market $110,000 Active 250 DOM
-
2026-06-07days on market $110,000 Active 249 DOM
-
2026-06-04days on market $110,000 Active 246 DOM
-
2026-06-02days on market $110,000 Active 245 DOM
-
2026-06-01days on market $110,000 Active 244 DOM
-
2026-05-31days on market $110,000 Active 243 DOM
-
2026-05-31days on market $110,000 Active 242 DOM
-
2026-03-12price $110,000 741-char remark
Show marketing remark (741 chars)
Motivated seller! This 4 bedroom, 2 bathroom home is full of original character and sits on a desirable corner lot in the heart of Atlantic within walking distance to the YMCA and middle schools. You’ll enjoy off-street parking and a 2-car garage located in the alley behind the house. Inside, you’ll find the gorgeous original hardwood floors, abundant storage, and spacious layout. The home has already seen a few important updates, including a brand-new roof and newer water heater. Upstairs, the 3rd-level studio apartment presents a fantastic project opportunity—ready for your vision to create the perfect guest suite, rental unit, or creative space. With so much character and potential, this property is a must-see!
-
2025-09-30$125,000 Active 741-char remark
Show marketing remark (741 chars)
Motivated seller! This 4 bedroom, 2 bathroom home is full of original character and sits on a desirable corner lot in the heart of Atlantic within walking distance to the YMCA and middle schools. You’ll enjoy off-street parking and a 2-car garage located in the alley behind the house. Inside, you’ll find the gorgeous original hardwood floors, abundant storage, and spacious layout. The home has already seen a few important updates, including a brand-new roof and newer water heater. Upstairs, the 3rd-level studio apartment presents a fantastic project opportunity—ready for your vision to create the perfect guest suite, rental unit, or creative space. With so much character and potential, this property is a must-see!
-
2019-07-01soldstatus $87,500
-
2019-07-01soldstatus $87,500
-
2019-07-01soldstatus $87,500
-
2017-07-26$95,000
-
2017-07-26$95,000
-
2016-11-20historical
-
2015-11-20$99,900
-
2015-11-20$99,900
-
2015-08-28historical
-
2014-05-27$115,000
-
2014-05-27$115,000
ⓘ Source: listings_history table (triggers on properties + properties_extension) + one-shot
backfill from property_details.listing_events for pre-trigger history.
Tax reassessment forecast IA · Partial reset (capped growth)
- Current annual tax
- $2,388 · $199/mo
- Projected year-2 tax
- $2,388 · $199/mo
- Expected delta
- $0/yr ($0/mo · 0.0%)
ⓘ Screening estimate from a state-policy table — verify with the county assessor before closing.
Climate risk First Street
- Flood 1/10 Low FEMA zone X (unshaded) · 0% chance over 30 yrs
- Wildfire 2/10 Low
- Heat 3/10 Moderate 7 d/yr ≥103°F today · 15 d/yr by 30 yrs out
- Wind 2/10 Low
- Air quality 1/10 Low 0 unhealthy d/yr today · 0 by 30 yrs out
Nearby sold comps map
Loading sold comps map…
Walkable amenities ~0.75 mi
Loading nearby amenities…
Taxation est. · year 1
- Rental income
- $15,014
- − Mortgage interest
- −$6,162
- − Property taxes
- −$2,388
- − Insurance
- −$550
- − Repairs & maintenance
- −$1,201
- − Management
- −$1,201
- − Depreciation
- −$3,200
- Taxable income
- $312
- Est. tax owed @ 24.0%
- −$75
- After-tax cash flow
- $1,926/yr
For passive investors: Depreciation is non-cash, so a rental often shows a tax loss while cash-flowing — sheltering income. Rental losses are passive: they offset passive income freely, and up to $25,000/yr can offset ordinary (W-2) income if you actively participate and your MAGI is under $100k (phasing out to $0 by $150k); unused losses carry forward. On sale, claimed depreciation is recaptured at up to 25%, and gains may owe capital-gains tax (a 1031 exchange can defer both). Figures are a year-1 estimate at your 24.0% rate — not tax advice; consult a CPA.
Schools (NCES district)
- District
- Atlantic Community School District
- NCES district ID
- 1903930
- Math proficiency
- 68% ▬ 0.00%
- Reading proficiency
- 72% ▲ 6.00%
- Median HH income
- $41,877
- Composite
- 58.58/100
- National rank
- #987
- State rank
- #155 of 289 in IA
Livability — Atlantic
- Score
- 74/100
- State rank
- #243
- US rank
- #4704
Category grades
Schools grade is shown separately in the Schools card above.
Census & demographics
- Census place
- Atlantic, IA
- City population
- 8,472
- Population (ZIP)
- 8,472
Population outlook (Cass County) Hauer SSP2
- Today (2025)
- 12,452 people
- By 2030
- 11,911 · -4.3%
- By 2040
- 10,904 · -12.4%
- By 2050
- 10,005 · -19.7%
- By 2075
- 8,030 · -35.5%
- By 2100
- 5,865 · -52.9%
Race, ethnicity, and origin ACS 2023
- Neighborhood character
- Predominantly White (96%)
- Race & ethnicity
- White 96% Hispanic / Latino 1% Black 1%
- Common ancestry
- Iranian 2% Lithuanian 2% Portuguese 1%
- Foreign-born
- 0%
- Languages at home
- 98% English-only · Spanish 1%
Political lean MEDSL · Cass
- 2024 margin
- Solid R (+40.7) · D 28.9% · R 69.6% · Other 1.5%
- 2008→2024 swing
- -29.9pp toward R · 2008: -10.8pp · 2024: -40.7pp
- All cycles
- 2024: R+40.7 2020: R+38.0 2016: R+39.8 2012: R+18.9 2008: R+10.8
Not yet ingested
- Civics
- —
Market trends
- HPI YoY
- ▼ -65.62%
- Current HPI
- 162.2127
- Rent YoY
- —
- Metro
- —
- State GDP YoY
- ▲ 2.48%
- F500 in state
- 4
Industry mix (Fortune 500 HQ in IA)
| Industry | F500 HQs | Revenue |
|---|---|---|
| Financial Services | 1 | $16B |
|
||
| Retail / Convenience | 1 | $15B |
|
||
Price history
-4.3% since first listed13 events — show timeline
- 2026-03-12 Price Changed $110,000 IAR
- 2025-09-30 Listed $125,000 IAR
- 2019-07-01 Sold (Public Records) $87,500 Public Records
- 2019-07-01 Sold (MLS) $87,500 NORTHSTARMLS as Distributed by MLS Grid
- 2019-07-01 Sold (MLS) $87,500 IAR
- 2017-07-26 Listed $95,000 NORTHSTARMLS as Distributed by MLS Grid
- 2017-07-26 Listed $95,000 IAR
- 2016-11-20 Listing Removed — NORTHSTARMLS as Distributed by MLS Grid
- 2015-11-20 Listed $99,900 NORTHSTARMLS as Distributed by MLS Grid
- 2015-11-20 Listed $99,900 IAR
- 2015-08-28 Listing Removed — NORTHSTARMLS as Distributed by MLS Grid
- 2014-05-27 Listed $115,000 NORTHSTARMLS as Distributed by MLS Grid
- 2014-05-27 Listed $115,000 IAR
Property tax history
+0.1%/yrLatest (2025): $2,388 · -1.2% YoY. Source: county tax records.
Cash-flow waterfall
monthlySold comps — $/sqft
last 12 mo · ≤1 miLoading sold comps…