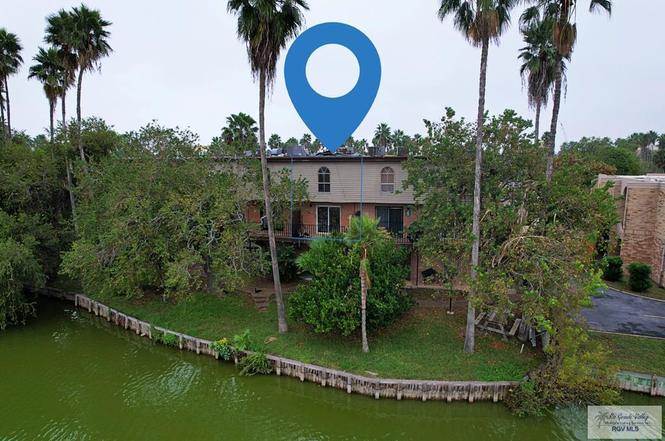
1900 E Elizabeth St #6007 · Brownsville, TX
Flood risk No data
- FEMA flood zone
- —
- Chance of flooding over 30 yrs
- —
- Est. flood insurance / yr
- —
Fire risk No data
- Est. fire insurance / yr
- —
Heat risk No data
- Hot days now (above threshold)
- —
- Hot days in 30 yrs
- —
Wind risk No data
- Chance of severe wind over 30 yrs
- —
Air-quality risk No data
- Unhealthy air days now
- —
- Unhealthy air days in 30 yrs
- —
Risk factors via First Street. Map © Google.
Why this score? — see what drove the B grade
The composite is a weighted blend of 9 inputs, each scored 0–100. Each bar is that input's sub-score; the figure is the points it added to the 100-point composite (weight × sub-score).
- Cash flow +30.0/30.0
- DSCR +10.0/10.0
- 1% rule +9.5/10.0
- ARV discount +7.5/15.0
- Rent growth +5.0/5.0
- Livability +4.0/5.0
- Condition / age +2.5/5.0
- Schools +2.2/10.0
- Appreciation +0.0/10.0
$90,000
🖨 Deal sheet (PDF) 📄 Offer letter ✓ Due diligence
Listing remarks
Cute and well located 2 bedroom, 1.5 bath condo offering peaceful resaca views and unbeatable convenience. This upstairs unit features a private balcony overlooking a beautiful resaca perfect for morning coffee or unwinding at the end of the day. Ideally situated near UTRGV and the Gateway International Bridge, making it a great option for university staff, students, or anyone who commutes daily to Matamoros. Comfortable layout, natural light, and a serene setting combine with a central location close to schools, shopping, and major routes. A great opportunity for a primary residence or investment property.
Key facts
- Fort brown villas
- Waterfront condo
- Pool
Tags
Neighborhood map
What this means for you Summary
Snapshot
- This is a 2-bed/1.5-bath condo listed at $90k.
Deal economics
- At list price, monthly cash flow is $411 ($5k/yr) — positive.
- The deal already cash-flows at list — no discount required.
- Meets the 1% rule at list price ($1k rent vs $90k).
- Recommended offer: $79k (12.0% below list) — sets the bar for market timing.
- Cap rate 11.8% vs local median 5.0% in Brownsville — top-decile yield for the area; either an underpriced asset or a hidden risk that comps aren't pricing in. Stress-test before assuming the spread holds.
Location & tenants
- Location reads 79/100 on livability (#62 in TX, #2,311 nationally) — a middle-class / working-renter tenant base. Strengths: commute A+, cost of living A+, housing A+; Watch: amenities D, crime D-, employment F.
- Brownsville ISD (urban): math 20% / reading 34% proficiency, ranked #710 of 826 in TX (top 86%) — low school quality limits family demand, transient renter base, plan for 1-2y turnover; 83% free/reduced lunch — lower-income household profile, screen leases tightly.
- Zoned schools: Putegnat El (math 8% / reading 8%, grade F, #4,301 of 4,322 statewide, top 100%, 478 students, 98% FRL); Faulk Middle (math 20% / reading 31%, grade F, #1,236 of 1,662 statewide, top 76%, 976 students, 99% FRL); Porter Early College H S (math 23% / reading 32%, grade F, #1,183 of 1,632 statewide, top 73%, 1,814 students, 94% FRL).
- Market conditions: Rents rising fast (+11.4%/yr); 348 active listings in the ZIP; 12 comparable units currently listed for rent nearby; rentals lingering (median 46d on market — plan ~5-8 weeks vacancy on turnover, expect pricing pressure); 83% of comp listings sitting > 30 days — soft ceiling on asking rent; 2,326 units permitted in Cameron County in 2024 (503 in 5+ unit buildings).
- This rent runs 31% of the median local income ($50k/yr) — at the standard rent-burdened threshold; future hikes will face affordability resistance.
Forward outlook
- Local home prices are declining (-3.0%/yr); year-one equity from $622 of loan paydown is wiped out by about $3k of value loss. Plan a longer hold.
- Cameron County population projected at +3% by 2050 — modest demand growth; plan on rents tracking national, not racing it.
- At projected returns (-3.0% appreciation + 8.0% rent growth), your $25k cash investment doubles in ~5 years — after that, you're playing with house money.
Negotiation context
- It's been on market 131 days — a 12% lower offer ($79k) is reasonable based on typical stale-listing flexibility.
Questions for the listing agent
- It's been on market 131 days. Have you received any prior offers? Is the seller open to a 12% concession, seller financing, or rate buy-down credit?
- Any open or pending special assessments — roof, HVAC, plumbing, elevator, façade? What's the per-unit balance and payoff schedule, and is the seller paying it off at close or rolling it to the buyer?
- Why hasn't it sold? Are there any deal-killer items the seller is aware of (foundation, flood, title, zoning, code violations)?
- Is there a deadline driving the sale (1031 exchange, divorce, estate, relocation)? That informs how much negotiation room exists.
- Crime grade is D in this area — have there been break-ins, vandalism, or insurance claims at this property in the last 3 years? What carrier currently insures it and at what premium?
- What's the average days-on-market for RENTAL listings here right now (not sales)? A rising rental-DOM trend means longer vacancies and softer asking-rent achievability than the comps imply.
- What's the recent tenant-quality profile in this submarket — average credit score on applications, eviction rate, late-payment / NSF rate, and stable-employment percentage? A property-management company in the area should have these aggregated.
- How much new apartment / multifamily construction is in the pipeline within 1–3 miles? Heavy new supply (>2% of stock underway) typically softens rents 12–24 months out; light construction supports rent growth.
Investment metrics
- 1% rule
- 1.45% ✓
- Cap rate
- 11.77%
- Cash-on-cash
- 19.57%
- DSCR
- 1.87
- GRM
- 5.7
CMA / ARV
No comps found within radius.
Projected returns pro-forma
-3.0% appreciation · 8.0% rent growth · sell at horizon
- IRR
- 17.1%
- Equity multiple
- 1.74×
- Total profit
- $18,524
- Equity at exit
- $13,419
- IRR
- 29.0%
- Equity multiple
- 4.23×
- Total profit
- $81,369
- Equity at exit
- $7,782
Cash invested: $25,200 (down + closing). Projections, not guarantees.
Landlord ↔ Tenant lean methodology
- Overall (STATE)
- 87 Strongly Landlord-Friendly
- State Texas
- 87 Strongly Landlord-Friendly · R+5
- County
- — inherits STATE
- City
- — inherits STATE
ZIP-level market 78520
- Home prices YoY
- -19.8%
- Rents YoY
- 11.4%
- Active inventory
- 348
- Price-to-rent
- 5.7×
Monthly cashflow live
- Estimated rent
- $1,308 high interval (Pro) →
- Mortgage (P&I)
- −$472
- Tax est. 1.5%
- −$112 /mo · $1,350/yr
- Insurance
- −$38
- HOA
- −$0
- Vacancy / Maint / Mgmt
- −$275
- Net cashflow
- $411
Break-even live
Sensitivity live
| Price | -10% $473 | -5% $442 | +0% $411 | +5% $380 | +10% $349 |
|---|---|---|---|---|---|
| Rent | -10% $308 | -5% $359 | +0% $411 | +5% $463 | +10% $514 |
| Rate | -1.0pp $456 | -0.5pp $434 | base $411 | +0.5pp $388 | +1.0pp $364 |
UW: 25.0% down · 7.5% · 30yr · 1.5% tax · 5.0% vac · 8.0% maint · 8.0% mgmt
Financing live
Cash to close
- Down payment
- $22,500
- Closing costs
- $2,700
- Reserves months
- —
- Total cash needed
- —
Loan-product check · same deal, 3 products live
Conventional
25% down · 7.5% · 30yr
- Down + closing
- —
- Monthly P&I
- —
- Monthly cashflow
- —
- DSCR
- —
- Eligible?
- —
Personal DTI + credit; lowest rate.
DSCR
20% down · 8.5% · 30yr
- Down + closing
- —
- Monthly P&I
- —
- Monthly cashflow
- —
- DSCR
- —
- Eligible?
- —
No personal income docs; deal must DSCR.
Hard money
10% down · 12.0% · 12mo
- Down + closing
- —
- Monthly P&I
- —
- Monthly cashflow
- —
- DSCR
- —
- Eligible?
- —
Short-term bridge; refi at stabilization.
Rent comps 12 comps
| Address | Beds | Baths | Sqft | Rent | $/sqft | DOM | Units | Dist |
|---|---|---|---|---|---|---|---|---|
| 801 International Blvd Ste B Brownsville, TX | 1.0 | 1.0 | 1092 | $950 | $0.87 | 45d | 1 | 0.23mi |
| 913 E Jefferson St Unit D Brownsville, TX | 2.0 | 2.0 | 1052 | $1,400 | $1.33 | 22d | 1 | 0.33mi |
| 1900 W University Blvd #3012 Brownsville, TX | 2.0 | 2.0 | 980 | $1,000 | $1.02 | 45d | 1 | 0.34mi |
| 1900 W University Blvd Brownsville, TX | 2.0 | 1.0 | 950 | $1,300 | $1.37 | 45d | 1 | 0.34mi |
| 634 E 6th St Apt 2 Brownsville, TX | 2.0 | 1.0 | 713 | $1,000 | $1.40 | 45d | 1 | 0.49mi |
| 305 Calle Amistosa Unit L502 Brownsville, TX | 1.0 | 1.0 | 753 | $1,300 | $1.73 | 45d | 1 | 0.63mi |
| 221 E 3rd St Brownsville, TX | 2.0 | 1.0 | 850 | $1,325 | $1.56 | 45d | 1 | 0.71mi |
| 219 E 3rd St Brownsville, TX | 2.0 | 1.0 | 900 | $1,275 | $1.42 | 45d | 1 | 0.71mi |
| 835 E Taylor St Unit B Brownsville, TX | 3.0 | 2.0 | 1150 | $1,550 | $1.35 | 45d | 1 | 0.76mi |
| 2024 E 19th St Brownsville, TX | 3.0 | 1.0 | 1259 | $2,000 | $1.59 | 22d | 1 | 1.02mi |
| 230 W Jefferson St Brownsville, TX | 2.0 | 1.0 | 840 | $795 | $0.95 | 45d | 1 | 1.07mi |
| 35 Cenizo Brownsville, TX | 2.0 | 3.5 | 1404 | $2,500 | $1.78 | 45d | 1 | 1.38mi |
HOA detail condo
- Monthly dues
- $0 · $0/yr
- Assessments
- None detected in remarks — confirm with the listing agent.
Listing history 13 events
-
2026-06-17statusdays on market $90,000 Pending 131 DOM
-
2026-06-10days on market $90,000 Active 143 DOM
-
2026-06-09days on market $90,000 Active 142 DOM
-
2026-06-08days on market $90,000 Active 141 DOM
-
2026-06-07days on market $90,000 Active 140 DOM
-
2026-06-05pricedays on market $90,000 Active 137 DOM
-
2026-06-03days on market $95,000 Active 136 DOM
-
2026-06-02days on market $95,000 Active 135 DOM
-
2026-06-01days on market $95,000 Active 134 DOM
-
2026-05-31days on market $95,000 Active 133 DOM
-
2026-05-30statusdays on market $95,000 Active 132 DOM
-
2026-04-27status Pending
-
2025-12-17$95,000 Active
ⓘ Source: listings_history table (triggers on properties + properties_extension) + one-shot
backfill from property_details.listing_events for pre-trigger history.
Nearby sold comps map
Loading sold comps map…
Walkable amenities ~0.75 mi
Loading nearby amenities…
Taxation est. · year 1
- Rental income
- $15,691
- − Mortgage interest
- −$5,041
- − Property taxes
- −$1,350
- − Insurance
- −$450
- − Repairs & maintenance
- −$1,255
- − Management
- −$1,255
- − Depreciation
- −$2,618
- Taxable income
- $3,721
- Est. tax owed @ 24.0%
- −$893
- After-tax cash flow
- $4,039/yr
For passive investors: Depreciation is non-cash, so a rental often shows a tax loss while cash-flowing — sheltering income. Rental losses are passive: they offset passive income freely, and up to $25,000/yr can offset ordinary (W-2) income if you actively participate and your MAGI is under $100k (phasing out to $0 by $150k); unused losses carry forward. On sale, claimed depreciation is recaptured at up to 25%, and gains may owe capital-gains tax (a 1031 exchange can defer both). Figures are a year-1 estimate at your 24.0% rate — not tax advice; consult a CPA.
Schools (NCES district)
- District
- Brownsville ISD
- NCES district ID
- 4811680
- Math proficiency
- 20% ▼ -36.00%
- Reading proficiency
- 34% ▼ -13.00%
- Median HH income
- $30,490
- Composite
- 21.8/100
- National rank
- #8249
- State rank
- #710 of 826 in TX
Livability — Brownsville
- Score
- 79/100
- State rank
- #62
- US rank
- #2311
Category grades
Schools grade is shown separately in the Schools card above.
Census & demographics
- Census place
- Brownsville, TX
- County
- Cameron County · 310,734 people
- City population
- 212,132
- Metro
- Brownsville-Harlingen, TX
- Population (ZIP)
- 64,740
- Household income
- $50,116
- Rent vs Own
- Severe rent burden
- 1800.0
Population outlook (Cameron County) Hauer SSP2
- Today (2025)
- 441,603 people
- By 2030
- 448,113 · +1.5%
- By 2040
- 456,385 · +3.3%
- By 2050
- 456,294 · +3.3%
- By 2075
- 423,851 · -4.0%
- By 2100
- 342,787 · -22.4%
Race, ethnicity, and origin ACS 2023
- Neighborhood character
- Predominantly Hispanic (93%)
- Race & ethnicity
- Hispanic / Latino 93% Two or more races 44% White 6%
- Hispanic origin (detail)
- Mexican 88%
- Foreign-born
- 26% · Canada
- Languages at home
- 18% English-only · Spanish 82%
Political lean MEDSL · Cameron
- 2024 margin
- Lean R (+5.8) · D 46.7% · R 52.5%
- 2008→2024 swing
- -34.6pp toward R · 2008: 28.8pp · 2024: -5.8pp
- All cycles
- 2024: R+5.8 2020: D+13.2 2016: D+32.5 2012: D+32.4 2008: D+28.8
Not yet ingested
- Civics
- —
Market trends
- HPI YoY
- ▼ -52.91%
- Current HPI
- 214.4335
- Rent YoY
- ▲ 11.41%
- Metro
- Brownsville-Harlingen, TX
- State GDP YoY
- ▲ 3.95%
- F500 in state
- 110
Industry mix (Fortune 500 HQ in TX)
| Industry | F500 HQs | Revenue |
|---|---|---|
| Energy | 16 | $1,198B |
|
||
| Technology | 5 | $198B |
|
||
| Engineering / Construction | 4 | $72B |
|
||
| Energy Services | 3 | $60B |
|
||
| Utilities | 3 | $41B |
|
||
| Healthcare | 2 | $330B |
|
||
Price history
2 events — show timeline
- 2026-04-27 Pending — RGVMLS
- 2025-12-17 Listed $95,000 RGVMLS
Cash-flow waterfall
monthlySold comps — $/sqft
last 12 mo · ≤1 miLoading sold comps…