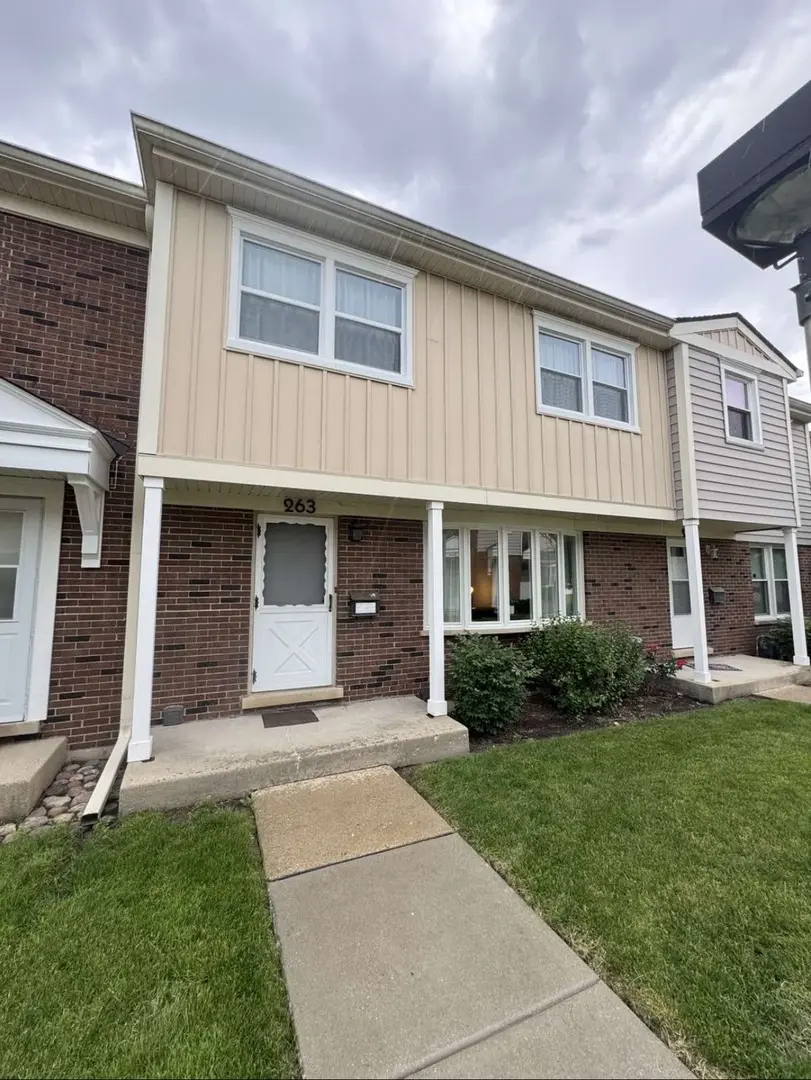
263 Green Ct · Wood Dale, IL
Flood risk 1/10 · Minimal
- FEMA flood zone
- X (unshaded)
- Chance of flooding over 30 yrs
- 0.0%
- Est. flood insurance / yr
- $473 – $860
Fire risk 1/10 · Minimal
- Est. fire insurance / yr
- $804 – $1,492
Heat risk 3/10 · Minor
- Hot days now (above 101°F)
- 7 days/yr
- Hot days in 30 yrs
- 14 days/yr
Wind risk 2/10 · Minimal
- Chance of severe wind over 30 yrs
- —
Air-quality risk 4/10 · Minor
- Unhealthy air days now
- 4 days/yr
- Unhealthy air days in 30 yrs
- 5 days/yr
Risk factors via First Street. Map © Google.
Why this score? — see what drove the F grade
The composite is a weighted blend of 9 inputs, each scored 0–100. Each bar is that input's sub-score; the figure is the points it added to the 100-point composite (weight × sub-score).
- Cash flow +9.1/30.0
- Livability +3.6/5.0
- 1% rule +3.4/10.0
- DSCR +2.5/10.0
- Rent growth +2.5/5.0
- Condition / age +2.5/5.0
- Schools +2.2/10.0
- ARV discount +1.0/15.0
- Appreciation +0.0/10.0
$375,000
🖨 Deal sheet 📄 Offer letter ✓ Due diligence
Listing remarks MLS
RARELY AVAILABLE 4 BEDROOM TOWNHOME IN GEORGETOWN! KITCHEN FEATURES NEW GRANITE COUNTER-TOPS, BRAND NEW SS APPLIANCES. ALL NEW FLOORING. THE HOME HAS BEEN FRESHLY PAINTED THROUGH-OUT. UPDATED BATH, NEW ELECTRIC PANEL, NEW SUMP PUMP! HUGE SUN-FILLED LIVING ROOM WITH NEW CARPET, SEPARATE DINING ROOM. FINISHED BASEMENT WITH LAUNDRY ROOM AND ADDITIONAL STORAGE. FENCED IN BACK YARD. AMENITIES INCLUDE CLUBHOUSE, POOL AND LARGE PLAYGROUND. CLOSE TO PARKS, TRAIN, SHOPPING AND RESTAURANTS! BROKER OWNED.
Key facts
- Brand new kitchen
- Large backyard
- New deck
Tags
Property features AI
Finance
- Other: 5 units in the building
- HOA & community: HOA fee $385 monthly; HOA covers clubhouse, pool, lawn care, and snow removal; Pets allowed (cats and dogs permitted; large pet weight allowed)
Exterior
- Parking: 2 parking spaces
- Utilities: Water source: Lake Michigan; Public sewer
- Home design: Attached single, townhouse - 2 story; Entry level is 1; Fee simple ownership with homeowners association
- Construction: Built 51-60 years ago; Vinyl siding and brick exterior; Built before 1978
- Exterior features: Lot dimensions approximately 24 x 50; School bus service available
Interior
- Kitchen: Kitchen on main level (22 x 10)
- Bedrooms: 4 bedrooms (all on second floor); Master bedroom on second floor
- Flooring: Vinyl flooring throughout main and second-level rooms; Bay window in living room
- Bathrooms: 1 full bath; 1 half bath
- Heating & cooling: Natural gas, forced air heating; Central air conditioning
- Interior features: Finished full basement; Total of 7 rooms
- Laundry & utility: Laundry room
Neighborhood map
What this means for you Summary
Snapshot
- This is a 4-bed/1.5-bath townhouse listed at $375k.
Deal economics
- At list price, monthly cash flow is $-289 ($-3k/yr) — negative.
- To cash-flow at today's rent, offer at most $324k (13.6% below list).
- To meet the 1% rule (rent ≥ 1% of price), the offer needs to be $317k (15.6% below list).
- Recommended offer: $317k (15.6% below list) — sets the bar for 1% rule.
- Cap rate 5.4% vs local median 4.2% in Wood Dale — meaningfully above typical; check what's discounted (condition, days-on-market, listing class) to confirm the premium yield is real.
Location & tenants
- Location reads 71/100 on livability (#328 in IL) — a middle-class / working-renter tenant base. Strengths: crime A+, housing A+, employment A; Watch: commute C-, amenities D, health & safety F.
- Fenton Chsd 100 (suburban): math 20% / reading 26% proficiency, ranked #335 of 620 in IL (top 54%) — low school quality limits family demand, transient renter base, plan for 1-2y turnover.
- Zoned schools: Fenton High School (math 20% / reading 26%, grade F, #312 of 693 statewide, top 46%, 1,448 students, 0% FRL).
- Market conditions: 27 active listings in the ZIP; 2 comparable units currently listed for rent nearby; 1,378 units permitted in DuPage County in 2024 (594 in 5+ unit buildings).
Forward outlook
- Local home prices are declining (-3.0%/yr); year-one equity from $3k of loan paydown is wiped out by about $11k of value loss. Plan a longer hold.
Negotiation context
- Only 6 days on market — expect competitive offers; lowballing is unlikely to land.
- 2 sale attempts since 6y ago with the ask held roughly flat each time — persistent listings suggest the price (not the market) is what's stuck; bring a comps-based counter.
- Current owner paid $196k; list at $375k implies a 92% gain — meaningful room to come down on a strong offer.
Questions for the listing agent
- What do current leases actually rent for vs. the listed asking? Can we see a recent rent roll and the last 12 months of T-12 income?
- Built in 1966 — when were the roof, HVAC, electrical panel, plumbing, and water heater last replaced?
- What does the HOA fee cover, when was the last increase, and are there any pending special assessments or reserve-fund shortfalls?
- Is there a deadline driving the sale (1031 exchange, divorce, estate, relocation)? That informs how much negotiation room exists.
- Schools are D-rated, which usually means shorter tenancies and higher turnover. Who's the typical renter profile here, and what's been the actual vacancy rate?
- The area grade is low — what's the realistic commute time and amenity access for the typical tenant pool here? Any planned neighborhood developments (good or bad) we should know about?
- What's the average days-on-market for RENTAL listings here right now (not sales)? A rising rental-DOM trend means longer vacancies and softer asking-rent achievability than the comps imply.
- What's the recent tenant-quality profile in this submarket — average credit score on applications, eviction rate, late-payment / NSF rate, and stable-employment percentage? A property-management company in the area should have these aggregated.
- How much new for-sale + rental construction is in the pipeline within 1–3 miles? Heavy new supply typically softens prices + rents 12–24 months out; constrained supply supports both.
Investment metrics
- 1% rule
- 0.84% ✗
- Cap rate
- 5.37%
- Cash-on-cash
- -3.31%
- DSCR
- 0.85
- GRM
- 9.9
CMA / ARV
- ARV (on-the-fly)
- $327,888
- Comps found
- 12
Show comp detail 12 sales within ~0.75 mi
| Address | Dist | Beds/Ba | Sqft | Sold | Price | $/sf | Match |
|---|---|---|---|---|---|---|---|
| 243 Washington Sq | 0.05mi | 4/2.0 | 1,584 (0%) | 6mo | $309,900 | $196 | 91 |
| 266 Station Dr | 0.07mi | 4/1.5 | 1,584 (0%) | 14mo | $322,000 | $203 | 85 |
| 213 Prospect Ave | 0.17mi | 3/1.5 (-1) | 1,676 (+6%) | 5mo | $305,000 | $182 | 73 |
| 171 N Clare Ct | 0.21mi | 3/2.5 (-1) | 1,510 (-5%) | 5mo | $265,000 | $175 | 69 |
| 194 N Clare Ct | 0.18mi | 3/2.5 (-1) | 1,725 (+9%) | 4mo | $420,000 | $243 | 65 |
| 502 W Clare Ct | 0.24mi | 3/2.5 (-1) | 1,510 (-5%) | 15mo | $313,000 | $207 | 60 |
| 254 Lafayette St | 0.10mi | 3/1.5 (-1) | 1,440 (-9%) | 19mo | $289,000 | $201 | 59 |
| 492 Victoria Ln #0 | 0.35mi | 3/2.5 (-1) | 1,725 (+9%) | 0mo | $400,000 | $232 | 59 |
| 183 Prospect Ave | 0.23mi | 3/2.5 (-1) | 1,710 (+8%) | 14mo | $335,000 | $196 | 56 |
| 499 Sarah Ct | 0.26mi | 3/2.5 (-1) | 1,725 (+9%) | 12mo | $392,000 | $227 | 54 |
| 503 Sarah Ct | 0.26mi | 3/2.5 (-1) | 1,710 (+8%) | 18mo | $356,000 | $208 | 50 |
| 499 W Clare Ct | 0.21mi | 3/2.5 (-1) | 1,785 (+13%) | 18mo | $372,000 | $208 | 45 |
Match score weights: distance 35% · size 25% · config 20% · recency 20%. Top-matched comps best support the ARV.
Projected returns pro-forma
-3.0% appreciation · 3.0% rent growth · sell at horizon
- IRR
- -21.8%
- Equity multiple
- 0.25×
- Total profit
- $-79,018
- Equity at exit
- $55,914
- IRR
- -15.4%
- Equity multiple
- 0.13×
- Total profit
- $-91,837
- Equity at exit
- $32,423
Cash invested: $105,000 (down + closing). Projections, not guarantees.
Landlord ↔ Tenant lean methodology
- Overall (STATE)
- 43 Moderately Tenant-Leaning
- State Illinois
- 43 Moderately Tenant-Leaning · D+7
- County
- — inherits STATE
- City
- — inherits STATE
ZIP-level market 60191
- Active inventory
- 27
- Price-to-rent
- 9.9×
Monthly cashflow live
- Estimated rent
- $3,167 medium interval (Pro) →
- Mortgage (P&I)
- −$1,967
- Tax from tax record
- −$283 /mo · $3,399/yr
- Insurance
- −$156
- HOA
- −$385
- Vacancy / Maint / Mgmt
- −$665
- Net cashflow
- $-289
Break-even live
UW: 25.0% down · 7.5% · 30yr · 1.5% tax · 5.0% vac · 8.0% maint · 8.0% mgmt
Financing live
Cash to close
- Down payment
- $93,750
- Closing costs
- $11,250
- Reserves months
- —
- Total cash needed
- —
Loan-product check · same deal, 3 products live
Conventional
25% down · 7.5% · 30yr
- Down + closing
- —
- Monthly P&I
- —
- Monthly cashflow
- —
- DSCR
- —
- Eligible?
- —
Personal DTI + credit; lowest rate.
DSCR
20% down · 8.5% · 30yr
- Down + closing
- —
- Monthly P&I
- —
- Monthly cashflow
- —
- DSCR
- —
- Eligible?
- —
No personal income docs; deal must DSCR.
Hard money
10% down · 12.0% · 12mo
- Down + closing
- —
- Monthly P&I
- —
- Monthly cashflow
- —
- DSCR
- —
- Eligible?
- —
Short-term bridge; refi at stabilization.
Rent comps 2 comps
| Address | Beds | Baths | Sqft | Rent | $/sqft | DOM | Units | Dist |
|---|---|---|---|---|---|---|---|---|
| 501 Washington Sq Wood Dale, IL | 3.0 | 1.5 | 1230 | $3,000 | $2.44 | 1d | 1 | 0.07mi |
| 366 N Hemlock Ave Wood Dale, IL | 4.0 | 2.0 | 1728 | $5,250 | $3.04 | 24d | 1 | 1.47mi |
HOA detail
- Monthly dues
- $385 · $4,620/yr
- Likely covers
- electricpool
Listing history 6 events
-
2026-06-18days on market $375,000 Active 6 DOM
-
2026-06-17days on market $375,000 Active 5 DOM
-
2026-06-16days on market $375,000 Active 4 DOM
-
2026-06-15days on market $375,000 Active 3 DOM
-
2026-06-13remarks 699-char remark
-
2026-06-13$375,000 Active 1 DOM
ⓘ Source: listings_history table (triggers on properties + properties_extension) + one-shot
backfill from property_details.listing_events for pre-trigger history.
Tax reassessment forecast IL · Partial reset (capped growth)
- Current annual tax
- $3,399 · $283/mo
- Projected year-2 tax
- $5,956 · $496/mo
- Expected delta
- +$2,557/yr (+$213/mo · 75.2%)
ⓘ Screening estimate from a state-policy table — verify with the county assessor before closing.
Climate risk First Street
- Flood 1/10 Low FEMA zone X (unshaded) · 0% chance over 30 yrs
- Wildfire 1/10 Low
- Heat 3/10 Moderate 7 d/yr ≥101°F today · 14 d/yr by 30 yrs out
- Wind 2/10 Low
- Air quality 4/10 Moderate 4 unhealthy d/yr today · 5 by 30 yrs out
Nearby sold comps map
Loading sold comps map…
Walkable amenities ~0.75 mi
Loading nearby amenities…
Taxation est. · year 1
- Rental income
- $38,002
- − Mortgage interest
- −$21,006
- − Property taxes
- −$3,399
- − Insurance
- −$1,875
- − Repairs & maintenance
- −$3,040
- − Management
- −$3,040
- − HOA
- −$4,620
- − Depreciation
- −$10,909
- Taxable loss
- −$9,887
- Est. tax savings @ 24.0%
- +$2,373
- After-tax cash flow
- $-1,098/yr
For passive investors: Depreciation is non-cash, so a rental often shows a tax loss while cash-flowing — sheltering income. Rental losses are passive: they offset passive income freely, and up to $25,000/yr can offset ordinary (W-2) income if you actively participate and your MAGI is under $100k (phasing out to $0 by $150k); unused losses carry forward. On sale, claimed depreciation is recaptured at up to 25%, and gains may owe capital-gains tax (a 1031 exchange can defer both). Figures are a year-1 estimate at your 24.0% rate — not tax advice; consult a CPA.
Schools (NCES district)
- District
- Fenton Chsd 100
- NCES district ID
- 1715030
- Math proficiency
- 20% ▼ -10.00%
- Reading proficiency
- 26% ▼ -2.00%
- Median HH income
- $62,621
- Composite
- 21.59/100
- National rank
- #8301
- State rank
- #335 of 620 in IL
Livability — Wood Dale
- Score
- 71/100
- State rank
- #328
- US rank
- #6529
Category grades
Schools grade is shown separately in the Schools card above.
Census & demographics
- Census place
- Wood Dale, IL
- City population
- 14,381
- Population (ZIP)
- 14,381
Population outlook (DuPage County) Hauer SSP2
- Today (2025)
- 960,187 people
- By 2030
- 965,850 · +0.6%
- By 2040
- 965,812 · +0.6%
- By 2050
- 954,890 · -0.6%
- By 2075
- 910,185 · -5.2%
- By 2100
- 816,255 · -15.0%
Race, ethnicity, and origin ACS 2023
- Neighborhood character
- Majority White (62%)
- Race & ethnicity
- White 62% Hispanic / Latino 29% Two or more races 17% Asian 5% Black 3%
- Hispanic origin (detail)
- Mexican 19% Puerto Rican 3%
- Common ancestry
- Romanian 16% Lithuanian 2% Italian 2%
- Foreign-born
- 27% · Canada
- Languages at home
- 54% English-only · Spanish 21% Russian/Polish/Slavic 17% Other Indo-European 6%
Political lean MEDSL · DuPage
- 2024 margin
- D (+13.3) · D 55.9% · R 42.5% · Other 1.6%
- 2008→2024 swing
- +2.5pp toward D · 2008: 10.8pp · 2024: 13.3pp
- All cycles
- 2024: D+13.3 2020: D+18.1 2016: D+14.1 2012: D+1.0 2008: D+10.8
Not yet ingested
- Civics
- —
Market trends
- HPI YoY
- ▼ -116.09%
- Current HPI
- 210.3816
- Rent YoY
- —
- Metro
- —
- State GDP YoY
- ▲ 1.59%
- F500 in state
- 60
Industry mix (Fortune 500 HQ in IL)
| Industry | F500 HQs | Revenue |
|---|---|---|
| Insurance | 4 | $201B |
|
||
| Consumer Goods | 4 | $87B |
|
||
| Industrial Machinery | 3 | $64B |
|
||
| Healthcare | 2 | $55B |
|
||
| Retail / Pharmacy | 1 | $148B |
|
||
| Agriculture / Food | 1 | $86B |
|
||
Price history
+257.1% since first listed8 events — show timeline
- 2026-06-12 Listed $375,000 MRED as Distributed by MLS Grid
- 2020-08-03 Sold (Public Records) $195,667 Public Records
- 2020-06-29 Sold (MLS) $195,000 MRED as Distributed by MLS Grid
- 2020-04-30 Pending — MRED as Distributed by MLS Grid
- 2020-04-27 Listed $199,900 MRED as Distributed by MLS Grid
- 2006-12-26 Sold (Public Records) $200,000 Public Records
- 1999-08-03 Sold (Public Records) $120,667 Public Records
- 1994-05-13 Sold (Public Records) $105,000 Public Records
Property tax history
-0.4%/yrLatest (2017): $3,399 · +4.2% YoY. Source: county tax records.
Cash-flow waterfall
monthlySold comps — $/sqft
last 12 mo · ≤1 miLoading sold comps…