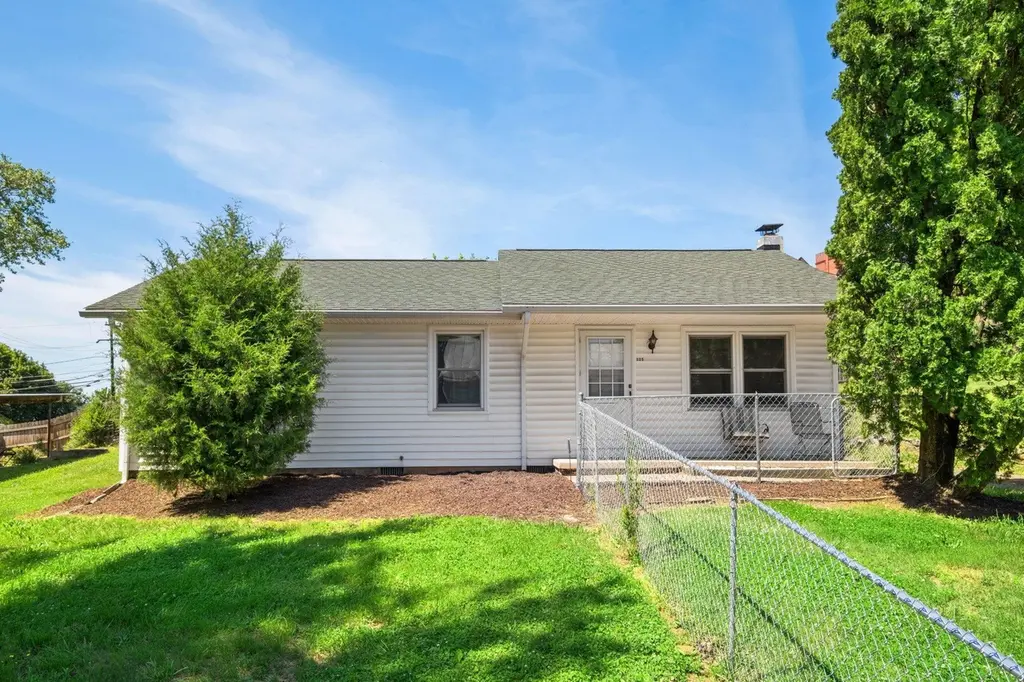
125 Riverside Dr E · Timberville, VA
Flood risk 1/10 · Minimal
- FEMA flood zone
- X (unshaded)
- Chance of flooding over 30 yrs
- 0.0%
- Est. flood insurance / yr
- $507 – $1,088
Fire risk 4/10 · Minor
- Est. fire insurance / yr
- $666 – $1,236
Heat risk 5/10 · Moderate
- Hot days now (above 101°F)
- 7 days/yr
- Hot days in 30 yrs
- 17 days/yr
Wind risk 2/10 · Minimal
- Chance of severe wind over 30 yrs
- 1.0%
Air-quality risk 1/10 · Minimal
- Unhealthy air days now
- 0 days/yr
- Unhealthy air days in 30 yrs
- 0 days/yr
Risk factors via First Street. Map © Google.
Why this score? — see what drove the C- grade
The composite is a weighted blend of 9 inputs, each scored 0–100. Each bar is that input's sub-score; the figure is the points it added to the 100-point composite (weight × sub-score).
- ARV discount +15.0/15.0
- Cash flow +14.7/30.0
- Schools +4.8/10.0
- DSCR +4.5/10.0
- Livability +3.4/5.0
- 1% rule +3.0/10.0
- Rent growth +2.5/5.0
- Condition / age +2.5/5.0
- Appreciation +0.0/10.0
$200,000
🖨 Deal sheet (PDF) 📄 Offer letter ✓ Due diligence
Listing remarks MLS
Perfect 3 Bedroom. 1 Bath Rancher in need of some TLC. Priced to sell w/fenced yard. Property being sold as is, Where is w/no warr. or repairs. Sq.Ft. approx.
Key facts
- Covered carport
- Natural gas service
- Fully fenced yard
Tags
Property features AI
Exterior
- Parking: Gravel off-street parking
- Utilities: Public water; Public sewer; Underground electric; Cable available; Natural gas available
- Home design: Detached single-story home; Entry on first level; Rolling lot topography
- Construction: Stick-built construction with vinyl siding; Block foundation; Shingle/composition roof; Built with above-grade finished living area per public records
- Exterior features: Fully fenced yard; Front porch / porch; Other exterior structure
Interior
- Kitchen: Electric range; Refrigerator
- Bedrooms: Three main-level bedrooms
- Flooring: Carpet; Vinyl
- Bathrooms: One full bathroom on the main level
- Heating & cooling: Baseboard heating (electric and natural gas); Window air conditioning units
- Interior features: Primary bedroom on the main level; Tilt-in windows
- Laundry & utility: Washer; Dryer
Neighborhood map
What this means for you Summary
Snapshot
- This is a 3-bed/1.0-bath single-family listed at $200k.
Deal economics
- At list price, monthly cash flow is $52 ($630/yr) — positive.
- The deal already cash-flows at list — no discount required.
- To meet the 1% rule (rent ≥ 1% of price), the offer needs to be $160k (20.2% below list).
- Recommended offer: $160k (20.2% below list) — sets the bar for 1% rule.
Location & tenants
- Location reads 67/100 on livability (#283 in VA) — a middle-class / working-renter tenant base. Strengths: crime A+, cost of living A+, housing A+; Watch: amenities F, commute F, health & safety D-.
- Rockingham County Public School District (rural): math 47% / reading 64% proficiency, ranked #77 of 131 in VA (top 59%) — acceptable for families but not a draw, mixed tenant base, ~2y average lease.
- Zoned schools: Plains Elementary (math 27% / reading 42%, grade F, #966 of 1,108 statewide, top 89%, 456 students, 65% FRL); J. Frank Hillyard Middle (math 51% / reading 59%, grade B-, #189 of 342 statewide, top 56%, 665 students, 49% FRL); Broadway High (math 68% / reading 79%, grade B+, #124 of 319 statewide, top 40%, 923 students, 42% FRL) — zoned schools average 52% FRL vs 32% district-wide (21 pts higher); higher-poverty schools than district average — tighter screening recommended.
- Market conditions: 22 active listings in the ZIP; 1 comparable units currently listed for rent nearby; 683 units permitted in Rockingham County in 2024 (0 in 5+ unit buildings).
Forward outlook
- Local home prices are declining (-3.0%/yr); year-one equity from $1k of loan paydown is wiped out by about $6k of value loss. Plan a longer hold.
- Rockingham County population projected at +6% by 2050 — modest demand growth; plan on rents tracking national, not racing it.
Negotiation context
- Only 5 days on market — expect competitive offers; lowballing is unlikely to land.
- 2 sale attempts since 19y ago with the ask held roughly flat each time — persistent listings suggest the price (not the market) is what's stuck; bring a comps-based counter.
- Current owner paid $120k; list at $200k implies a 67% gain — meaningful room to come down on a strong offer.
Risks & watch-outs
- Climate carrying-cost: extreme-heat days projected 7→17/yr by 2055 (HVAC capex compounding) — expect insurance premiums to compound above CPI over the hold.
Questions for the listing agent
- Built in 1974 — when were the roof, HVAC, electrical panel, plumbing, and water heater last replaced?
- Is there a deadline driving the sale (1031 exchange, divorce, estate, relocation)? That informs how much negotiation room exists.
- What's the average days-on-market for RENTAL listings here right now (not sales)? A rising rental-DOM trend means longer vacancies and softer asking-rent achievability than the comps imply.
- What's the recent tenant-quality profile in this submarket — average credit score on applications, eviction rate, late-payment / NSF rate, and stable-employment percentage? A property-management company in the area should have these aggregated.
- How much new for-sale + rental construction is in the pipeline within 1–3 miles? Heavy new supply typically softens prices + rents 12–24 months out; constrained supply supports both.
Investment metrics
- 1% rule
- 0.80% ✗
- Cap rate
- 6.61%
- Cash-on-cash
- 1.12%
- DSCR
- 1.05
- GRM
- 10.4
CMA / ARV
- ARV (on-the-fly)
- $260,680
- Comps found
- 11
Show comp detail 11 sales within ~0.75 mi
| Address | Dist | Beds/Ba | Sqft | Sold | Price | $/sf | Match |
|---|---|---|---|---|---|---|---|
| 153 Riverside Dr E | 0.05mi | 3/2.0 | 992 (+1%) | 23mo | $265,000 | $267 | 72 |
| 273 Riverside Dr E | 0.27mi | 3/1.0 | 894 (-9%) | 4mo | $250,900 | $281 | 70 |
| 296 Cherry St | 0.30mi | 3/1.5 | 980 (0%) | 20mo | $260,000 | $265 | 68 |
| 277 New Market Rd | 0.52mi | 3/1.0 | 960 (-2%) | 8mo | $255,000 | $266 | 66 |
| 189 Maple Ave | 0.26mi | 3/1.0 | 897 (-8%) | 12mo | $237,900 | $265 | 64 |
| 349 Maple Ave | 0.53mi | 3/1.0 | 992 (+1%) | 13mo | $262,900 | $265 | 63 |
| 15524 Evergreen Valley Rd | 0.59mi | 3/1.0 | 876 (-11%) | 7mo | $285,000 | $325 | 49 |
| 385 Walker | 0.71mi | 3/2.0 | 1,050 (+7%) | 4mo | $278,000 | $265 | 47 |
| 15428 Evergreen Valley Rd | 0.50mi | 3/1.0 | 864 (-12%) | 16mo | $235,000 | $272 | 43 |
| 145 Memorial Park Dr | 0.41mi | 3/2.0 | 1,120 (+14%) | 15mo | $300,000 | $268 | 41 |
| 392 Walker Way | 0.71mi | 3/1.5 | 1,100 (+12%) | 11mo | $237,500 | $216 | 35 |
Match score weights: distance 35% · size 25% · config 20% · recency 20%. Top-matched comps best support the ARV.
Projected returns pro-forma
-3.0% appreciation · 3.0% rent growth · sell at horizon
- IRR
- -14.6%
- Equity multiple
- 0.48×
- Total profit
- $-29,150
- Equity at exit
- $29,821
- IRR
- -5.9%
- Equity multiple
- 0.62×
- Total profit
- $-21,418
- Equity at exit
- $17,292
Cash invested: $56,000 (down + closing). Projections, not guarantees.
Landlord ↔ Tenant lean methodology
- Overall (STATE)
- 55 Moderately Landlord-Leaning
- State Virginia
- 55 Moderately Landlord-Leaning · D+2
- County
- — inherits STATE
- City
- — inherits STATE
ZIP-level market 22853
- Home prices YoY
- -22.6%
- Active inventory
- 22
- Price-to-rent
- 10.4×
Monthly cashflow live
- Estimated rent
- $1,595 medium interval (Pro) →
- Mortgage (P&I)
- −$1,049
- Tax from tax record
- −$75 /mo · $905/yr
- Insurance
- −$83
- HOA
- −$0
- Vacancy / Maint / Mgmt
- −$335
- Net cashflow
- $52
Break-even live
Sensitivity live
| Price | -10% $166 | -5% $109 | +0% $52 | +5% $-4 | +10% $-61 |
|---|---|---|---|---|---|
| Rent | -10% $-74 | -5% $-11 | +0% $52 | +5% $115 | +10% $178 |
| Rate | -1.0pp $153 | -0.5pp $103 | base $52 | +0.5pp $1 | +1.0pp $-52 |
UW: 25.0% down · 7.5% · 30yr · 1.5% tax · 5.0% vac · 8.0% maint · 8.0% mgmt
Financing live
Cash to close
- Down payment
- $50,000
- Closing costs
- $6,000
- Reserves months
- —
- Total cash needed
- —
Loan-product check · same deal, 3 products live
Conventional
25% down · 7.5% · 30yr
- Down + closing
- —
- Monthly P&I
- —
- Monthly cashflow
- —
- DSCR
- —
- Eligible?
- —
Personal DTI + credit; lowest rate.
DSCR
20% down · 8.5% · 30yr
- Down + closing
- —
- Monthly P&I
- —
- Monthly cashflow
- —
- DSCR
- —
- Eligible?
- —
No personal income docs; deal must DSCR.
Hard money
10% down · 12.0% · 12mo
- Down + closing
- —
- Monthly P&I
- —
- Monthly cashflow
- —
- DSCR
- —
- Eligible?
- —
Short-term bridge; refi at stabilization.
Rent comps 1 comps
| Address | Beds | Baths | Sqft | Rent | $/sqft | DOM | Units | Dist |
|---|---|---|---|---|---|---|---|---|
| 5473 Orchard Dr Timberville, VA | 2.0 | 1.0 | 850 | $1,595 | $1.88 | 23d | 1 | 0.92mi |
Listing history 6 events
-
2026-06-13status $200,000 Pending 5 DOM
-
2026-06-10days on market $200,000 Active 5 DOM
-
2026-06-09days on market $200,000 Active 4 DOM
-
2026-06-08days on market $200,000 Active 3 DOM
-
2026-06-07remarks 699-char remark
-
2026-06-07$200,000 Active 2 DOM
ⓘ Source: listings_history table (triggers on properties + properties_extension) + one-shot
backfill from property_details.listing_events for pre-trigger history.
Tax reassessment forecast VA · Resets to sale price
- Current annual tax
- $905 · $75/mo
- Projected year-2 tax
- $1,640 · $137/mo
- Expected delta
- +$735/yr (+$61/mo · 81.2%)
ⓘ Screening estimate from a state-policy table — verify with the county assessor before closing.
Climate risk First Street
- Flood 1/10 Low FEMA zone X (unshaded) · 0% chance over 30 yrs
- Wildfire 4/10 Moderate
- Heat 5/10 Major 7 d/yr ≥101°F today · 17 d/yr by 30 yrs out
- Wind 2/10 Low 100% chance of damaging wind over 30 yrs
- Air quality 1/10 Low 0 unhealthy d/yr today · 0 by 30 yrs out
Nearby sold comps map
Loading sold comps map…
Walkable amenities ~0.75 mi
Loading nearby amenities…
Taxation est. · year 1
- Rental income
- $19,140
- − Mortgage interest
- −$11,203
- − Property taxes
- −$905
- − Insurance
- −$1,000
- − Repairs & maintenance
- −$1,531
- − Management
- −$1,531
- − Depreciation
- −$5,818
- Taxable loss
- −$2,849
- Est. tax savings @ 24.0%
- +$684
- After-tax cash flow
- $1,313/yr
For passive investors: Depreciation is non-cash, so a rental often shows a tax loss while cash-flowing — sheltering income. Rental losses are passive: they offset passive income freely, and up to $25,000/yr can offset ordinary (W-2) income if you actively participate and your MAGI is under $100k (phasing out to $0 by $150k); unused losses carry forward. On sale, claimed depreciation is recaptured at up to 25%, and gains may owe capital-gains tax (a 1031 exchange can defer both). Figures are a year-1 estimate at your 24.0% rate — not tax advice; consult a CPA.
Schools (NCES district)
- District
- Rockingham County Public School District
- NCES district ID
- 5103390
- Math proficiency
- 47% ▼ -36.00%
- Reading proficiency
- 64% ▼ -12.00%
- Median HH income
- $53,178
- Composite
- 47.58/100
- National rank
- #2264
- State rank
- #77 of 131 in VA
Livability — Timberville
- Score
- 67/100
- State rank
- #283
- US rank
- #10125
Category grades
Schools grade is shown separately in the Schools card above.
Census & demographics
- Census place
- Timberville, VA
- Population (ZIP)
- 4,876
Population outlook (Rockingham County) Hauer SSP2
- Today (2025)
- 83,435 people
- By 2030
- 85,223 · +2.1%
- By 2040
- 87,667 · +5.1%
- By 2050
- 88,550 · +6.1%
- By 2075
- 90,331 · +8.3%
- By 2100
- 85,122 · +2.0%
Race, ethnicity, and origin ACS 2023
- Neighborhood character
- Predominantly White (87%)
- Race & ethnicity
- White 87% Hispanic / Latino 10% Two or more races 5% Black 1%
- Hispanic origin (detail)
- Mexican 5% Puerto Rican 2%
- Common ancestry
- Serbian 6% Italian 2% Slovak 1%
- Foreign-born
- 5% · Canada
- Languages at home
- 87% English-only · Spanish 12% Russian/Polish/Slavic 1%
Political lean MEDSL · Rockingham
- 2024 margin
- Solid R (+37.0) · D 30.9% · R 68.0% · Other 1.1%
- 2008→2024 swing
- -1.0pp toward R · 2008: -36.0pp · 2024: -37.0pp
- All cycles
- 2024: R+37.0 2020: R+40.4 2016: R+43.5 2012: R+40.6 2008: R+36.0
Not yet ingested
- Civics
- —
Market trends
- HPI YoY
- ▼ -55.44%
- Current HPI
- 189.9975
- Rent YoY
- —
- Metro
- —
- State GDP YoY
- ▲ 2.40%
- F500 in state
- 50
Industry mix (Fortune 500 HQ in VA)
| Industry | F500 HQs | Revenue |
|---|---|---|
| Aerospace / Defense | 4 | $236B |
|
||
| Technology / Defense | 3 | $32B |
|
||
| Financial Services | 2 | $176B |
|
||
| Utilities | 2 | $27B |
|
||
| Insurance | 2 | $25B |
|
||
| Technology | 2 | $15B |
|
||
Price history
+54.0% since first listed4 events — show timeline
- 2026-06-05 Listed $200,000 GAAR
- 2008-07-09 Sold (Public Records) $120,000 Public Records
- 2008-07-09 Sold (MLS) $120,000 HRAR
- 2007-12-28 Listed $129,900 HRAR
Property tax history
+3.9%/yrLatest (2025): $905 · +0.0% YoY. Source: county tax records.
Cash-flow waterfall
monthlySold comps — $/sqft
last 12 mo · ≤1 miLoading sold comps…