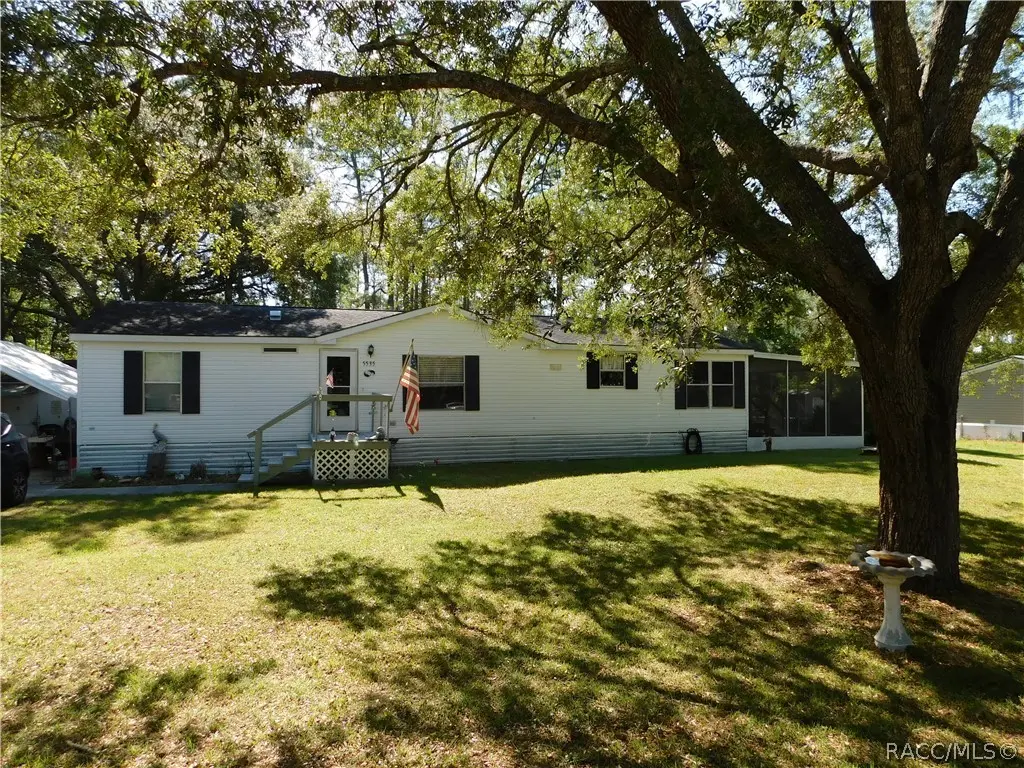
5535 S Will Pt · Homosassa Springs, FL
Flood risk 8/10 · Major
- FEMA flood zone
- X (unshaded)
- Chance of flooding over 30 yrs
- 0.78%
- Est. flood insurance / yr
- $507 – $1,088
Fire risk 5/10 · Moderate
- Est. fire insurance / yr
- $947 – $1,759
Heat risk 10/10 · Severe
- Hot days now (above 108°F)
- 7 days/yr
- Hot days in 30 yrs
- 26 days/yr
Wind risk 9/10 · Severe
- Chance of severe wind over 30 yrs
- 99.0%
Air-quality risk 1/10 · Minimal
- Unhealthy air days now
- 0 days/yr
- Unhealthy air days in 30 yrs
- 0 days/yr
Risk factors via First Street. Map © Google.
Why this score? — see what drove the C+ grade
The composite is a weighted blend of 9 inputs, each scored 0–100. Each bar is that input's sub-score; the figure is the points it added to the 100-point composite (weight × sub-score).
- Cash flow +27.6/30.0
- DSCR +9.7/10.0
- ARV discount +7.4/15.0
- 1% rule +6.3/10.0
- Schools +4.1/10.0
- Livability +3.6/5.0
- Rent growth +2.5/5.0
- Condition / age +2.5/5.0
- Appreciation +0.0/10.0
$169,900
🖨 Deal sheet (PDF) 📄 Offer letter ✓ Due diligence
Listing remarks
Welcome home to peaceful country living! Escape to the relaxed Nature Coast Florida lifestyle in this charming 3-bedroom, 2-bath home nestled on a generous half-acre lot on a quiet dead-end road. Whether you're looking for a full-time residence, seasonal retreat, or investment opportunity, this home checks all the boxes. The spacious back deck is ready for an above-ground pool or serves as the perfect setting for entertaining family and friends, relaxing with your morning coffee, or enjoying peaceful evenings outdoors. A fenced area provides the perfect place for pets to play, while the detached workshop offers endless possibilities for hobbies, storage, or projects. Conveniently located ne
Key facts
- Spacious back deck
- Half-acre lot
- Fenced area
Tags
Property features AI
Exterior
- Parking: Paved driveway; Detached carport; Carport plus 2 total parking spaces
- Utilities: Private well water; Septic tank sewer
- Home design: Manufactured home (double wide); Residential property
- Construction: Asphalt shingle roof; Mobile home dimensions approximately 24' x 56'
- Exterior features: Sliding doors; Shed(s), storage, and workshop on the property; Level lot; Private maintained, unimproved road frontage
Interior
- Kitchen: Dishwasher; Oven; Range; Refrigerator; Pantry; Eat-in kitchen
- Bedrooms: Total rooms: 5
- Flooring: Carpet; Laminate; Tile
- Bathrooms: 2 full bathrooms
- Heating & cooling: Heat pump heating; Central air conditioning
- Interior features: Cathedral ceilings; Eat-in kitchen; Open floor plan; Pantry; Walk-in closets; Blinds and window treatments
- Laundry & utility: Washer; Dryer
Neighborhood map
What this means for you Summary
Snapshot
- This is a 3-bed/2.0-bath manufactured listed at $170k.
Deal economics
- At list price, monthly cash flow is $439 ($5k/yr) — positive.
- The deal already cash-flows at list — no discount required.
- Meets the 1% rule at list price ($2k rent vs $170k).
- Cap rate 9.9% vs local median 5.9% in Homosassa Springs — top-decile yield for the area; either an underpriced asset or a hidden risk that comps aren't pricing in. Stress-test before assuming the spread holds.
Location & tenants
- Location reads 71/100 on livability (#391 in FL) — a middle-class / working-renter tenant base. Strengths: cost of living A+, housing A+, health & safety A+; Watch: crime C-, amenities F, commute F.
- Citrus (rural): math 49% / reading 50% proficiency, ranked #44 of 73 in FL (top 60%) — families likely to look elsewhere, expect single-tenant / working-renter base with shorter leases.
- Zoned schools: Homosassa Elementary School (math 62% / reading 47%, grade C, #892 of 2,144 statewide, top 44%, 411 students, 78% FRL); Lecanto Middle School (math 49% / reading 49%, grade C-, #265 of 571 statewide, top 48%, 809 students, 55% FRL); Lecanto High School (math 46% / reading 53%, grade D, #179 of 667 statewide, top 29%, 1,630 students, 46% FRL) — zoned schools at 60% FRL track the district average.
- Market conditions: 586 active listings in the ZIP; 1 comparable units currently listed for rent nearby; 2,443 units permitted in Citrus County in 2024 (0 in 5+ unit buildings).
- This rent runs 39% of the median local income ($59k/yr) — at the standard rent-burdened threshold; future hikes will face affordability resistance.
Forward outlook
- Local home prices are declining (-3.0%/yr); year-one equity from $1k of loan paydown is wiped out by about $5k of value loss. Plan a longer hold.
- Citrus County population projected to shrink 10% by 2050 — rents likely to lag national; underwrite the cash flow, not the appreciation.
- At projected returns (-3.0% appreciation + 3.0% rent growth), your $48k cash investment doubles in ~10 years — after that, you're playing with house money.
Negotiation context
- Only 6 days on market — expect competitive offers; lowballing is unlikely to land.
- Current owner paid $83k; list at $170k implies a 105% gain — meaningful room to come down on a strong offer.
Risks & watch-outs
- Watch-outs: flood insurance adds $66/mo.
- Climate carrying-cost: severe flood risk; severe wind risk, 99% chance of damaging wind over 30y; moderate wildfire risk; extreme-heat days projected 7→26/yr by 2055 (HVAC capex compounding) — expect insurance premiums to compound above CPI over the hold.
Questions for the listing agent
- What's the actual annual flood-insurance premium (NFIP or private), and is the property in a SFHA with mandatory coverage?
- Is there a deadline driving the sale (1031 exchange, divorce, estate, relocation)? That informs how much negotiation room exists.
- Schools are F-rated, which usually means shorter tenancies and higher turnover. Who's the typical renter profile here, and what's been the actual vacancy rate?
- What's the average days-on-market for RENTAL listings here right now (not sales)? A rising rental-DOM trend means longer vacancies and softer asking-rent achievability than the comps imply.
- What's the recent tenant-quality profile in this submarket — average credit score on applications, eviction rate, late-payment / NSF rate, and stable-employment percentage? A property-management company in the area should have these aggregated.
- How much new for-sale + rental construction is in the pipeline within 1–3 miles? Heavy new supply typically softens prices + rents 12–24 months out; constrained supply supports both.
Investment metrics
- 1% rule
- 1.13% ✓
- Cap rate
- 9.86%
- Cash-on-cash
- 12.75%
- DSCR
- 1.57
- GRM
- 7.3
CMA / ARV
- ARV (on-the-fly)
- $169,344
- Comps found
- 11
Show comp detail 11 sales within ~0.75 mi
| Address | Dist | Beds/Ba | Sqft | Sold | Price | $/sf | Match |
|---|---|---|---|---|---|---|---|
| 5573 S Will Pt | 0.02mi | 3/2.0 | 1,248 (-7%) | 5mo | $115,000 | $92 | 83 |
| 5729 S Leopard Pt | 0.23mi | 3/2.0 | 1,296 (-4%) | 2mo | $150,000 | $116 | 82 |
| 5511 S Bob White Dr | 0.34mi | 3/2.0 | 1,404 (+4%) | 5mo | $103,425 | $74 | 73 |
| 5372 S June Ter | 0.18mi | 3/2.0 | 1,216 (-10%) | 13mo | $190,000 | $156 | 65 |
| 5535 S Scarlett Oak Ter | 0.66mi | 2/2.0 (-1) | 1,344 (0%) | 2mo | $170,000 | $126 | 63 |
| 5320 S Heloise Ter | 0.22mi | 3/2.0 | 1,493 (+11%) | 10mo | $203,000 | $136 | 63 |
| 5442 S Glenn Acres Ter | 0.54mi | 4/2.0 (+1) | 1,344 (0%) | 10mo | $200,000 | $149 | 62 |
| 6180 W Nielsen Ct | 0.39mi | 3/2.0 | 1,248 (-7%) | 12mo | $180,000 | $144 | 60 |
| 5292 S Bayliner St | 0.71mi | 3/2.0 | 1,404 (+4%) | 1mo | $170,000 | $121 | 59 |
| 5214 S Frame Pt | 0.44mi | 2/2.0 (-1) | 1,246 (-7%) | 4mo | $100,000 | $80 | 59 |
| 6871 W Sasser St | 0.45mi | 3/2.0 | 1,152 (-14%) | 2mo | $175,000 | $152 | 54 |
Match score weights: distance 35% · size 25% · config 20% · recency 20%. Top-matched comps best support the ARV.
Projected returns pro-forma
-3.0% appreciation · 3.0% rent growth · sell at horizon
- IRR
- 0.2%
- Equity multiple
- 1.01×
- Total profit
- $397
- Equity at exit
- $25,333
- IRR
- 9.9%
- Equity multiple
- 1.76×
- Total profit
- $36,235
- Equity at exit
- $14,690
Cash invested: $47,572 (down + closing). Projections, not guarantees.
Landlord ↔ Tenant lean methodology
- Overall (STATE)
- 87 Strongly Landlord-Friendly
- State Florida
- 87 Strongly Landlord-Friendly · R+3
- County
- — inherits STATE
- City
- — inherits STATE
ZIP-level market 34446
- Home prices YoY
- -10.4%
- Active inventory
- 586
- Price-to-rent
- 7.3×
Monthly cashflow live
- Estimated rent
- $1,928 medium interval (Pro) →
- Mortgage (P&I)
- −$891
- Tax from tax record
- −$56 /mo · $675/yr
- Insurance
- −$71
- Flood insurance flood zone
- −$66 /mo · $798/yr
- HOA
- −$0
- Vacancy / Maint / Mgmt
- −$405
- Net cashflow
- $439
Break-even live
Sensitivity live
| Price | -10% $535 | -5% $487 | +0% $439 | +5% $391 | +10% $343 |
|---|---|---|---|---|---|
| Rent | -10% $287 | -5% $363 | +0% $439 | +5% $515 | +10% $591 |
| Rate | -1.0pp $524 | -0.5pp $482 | base $439 | +0.5pp $395 | +1.0pp $350 |
UW: 25.0% down · 7.5% · 30yr · 1.5% tax · 5.0% vac · 8.0% maint · 8.0% mgmt
Financing live
Cash to close
- Down payment
- $42,475
- Closing costs
- $5,097
- Reserves months
- —
- Total cash needed
- —
Loan-product check · same deal, 3 products live
Conventional
25% down · 7.5% · 30yr
- Down + closing
- —
- Monthly P&I
- —
- Monthly cashflow
- —
- DSCR
- —
- Eligible?
- —
Personal DTI + credit; lowest rate.
DSCR
20% down · 8.5% · 30yr
- Down + closing
- —
- Monthly P&I
- —
- Monthly cashflow
- —
- DSCR
- —
- Eligible?
- —
No personal income docs; deal must DSCR.
Hard money
10% down · 12.0% · 12mo
- Down + closing
- —
- Monthly P&I
- —
- Monthly cashflow
- —
- DSCR
- —
- Eligible?
- —
Short-term bridge; refi at stabilization.
Rent comps 1 comps
| Address | Beds | Baths | Sqft | Rent | $/sqft | DOM | Units | Dist |
|---|---|---|---|---|---|---|---|---|
| 5323 S Knobhill Ter Homosassa, FL | 3.0 | 2.0 | 925 | $1,400 | $1.51 | 23d | 1 | 1.03mi |
Listing history 6 events
-
2026-06-17days on market $169,900 Pending 6 DOM
-
2026-06-07statusdays on market $169,900 Pending 5 DOM
-
2026-06-03days on market $169,900 Active 2 DOM
-
2026-06-02$169,900 Active 1 DOM
-
2026-05-31remarks 699-char remark
-
2026-05-31$169,900 Active 1 DOM
ⓘ Source: listings_history table (triggers on properties + properties_extension) + one-shot
backfill from property_details.listing_events for pre-trigger history.
Tax reassessment forecast FL · Resets to sale price
- Current annual tax
- $675 · $56/mo
- Projected year-2 tax
- $1,410 · $118/mo
- Expected delta
- +$735/yr (+$61/mo · 108.9%)
ⓘ Screening estimate from a state-policy table — verify with the county assessor before closing.
Climate risk First Street
- Flood 8/10 Severe FEMA zone X (unshaded) · 78% chance over 30 yrs
- Wildfire 5/10 Major
- Heat 10/10 Extreme 7 d/yr ≥108°F today · 26 d/yr by 30 yrs out
- Wind 9/10 Extreme 99% chance of damaging wind over 30 yrs
- Air quality 1/10 Low 0 unhealthy d/yr today · 0 by 30 yrs out
Nearby sold comps map
Loading sold comps map…
Walkable amenities ~0.75 mi
Loading nearby amenities…
Taxation est. · year 1
- Rental income
- $23,140
- − Mortgage interest
- −$9,517
- − Property taxes
- −$675
- − Insurance
- −$1,647
- − Repairs & maintenance
- −$1,851
- − Management
- −$1,851
- − Depreciation
- −$4,943
- Taxable income
- $2,656
- Est. tax owed @ 24.0%
- −$637
- After-tax cash flow
- $4,629/yr
For passive investors: Depreciation is non-cash, so a rental often shows a tax loss while cash-flowing — sheltering income. Rental losses are passive: they offset passive income freely, and up to $25,000/yr can offset ordinary (W-2) income if you actively participate and your MAGI is under $100k (phasing out to $0 by $150k); unused losses carry forward. On sale, claimed depreciation is recaptured at up to 25%, and gains may owe capital-gains tax (a 1031 exchange can defer both). Figures are a year-1 estimate at your 24.0% rate — not tax advice; consult a CPA.
Schools (NCES district)
- District
- Citrus
- NCES district ID
- 1200270
- Math proficiency
- 49% ▼ -10.00%
- Reading proficiency
- 50% ▼ -6.00%
- Median HH income
- $38,618
- Composite
- 41.28/100
- National rank
- #3519
- State rank
- #44 of 73 in FL
Livability — Homosassa Springs
- Score
- 71/100
- State rank
- #391
- US rank
- #6877
Category grades
Schools grade is shown separately in the Schools card above.
Census & demographics
- Census place
- Homosassa Springs, FL
- County
- Citrus County · 111,314 people
- Metro
- Homosassa Springs, FL
- Population (ZIP)
- 19,102
- Household income
- $58,802
- Rent vs Own
- Severe rent burden
- 121.0
Population outlook (Citrus County) Hauer SSP2
- Today (2025)
- 138,622 people
- By 2030
- 136,886 · -1.3%
- By 2040
- 132,009 · -4.8%
- By 2050
- 125,196 · -9.7%
- By 2075
- 108,570 · -21.7%
- By 2100
- 84,454 · -39.1%
Race, ethnicity, and origin ACS 2023
- Neighborhood character
- Predominantly White (87%)
- Race & ethnicity
- White 87% Two or more races 8% Hispanic / Latino 6%
- Hispanic origin (detail)
- Mexican 2% Puerto Rican 3%
- Common ancestry
- Romanian 4% Lithuanian 4% Slovak 3%
- Foreign-born
- 5% · Canada
- Languages at home
- 95% English-only · Spanish 4%
Political lean MEDSL · Citrus
- 2024 margin
- Solid R (+45.9) · D 26.8% · R 72.6%
- 2008→2024 swing
- -29.8pp toward R · 2008: -16.1pp · 2024: -45.9pp
- All cycles
- 2024: R+45.9 2020: R+41.0 2016: R+39.7 2012: R+21.9 2008: R+16.1
Not yet ingested
- Civics
- —
Market trends
- HPI YoY
- ▼ -32.11%
- Current HPI
- 277.2576
- Rent YoY
- —
- Metro
- Homosassa Springs, FL
- State GDP YoY
- ▲ 3.28%
- F500 in state
- 36
Industry mix (Fortune 500 HQ in FL)
| Industry | F500 HQs | Revenue |
|---|---|---|
| Industrial Technology | 2 | $29B |
|
||
| Insurance | 2 | $17B |
|
||
| Retail | 1 | $60B |
|
||
| Technology Distribution | 1 | $58B |
|
||
| Homebuilding | 1 | $35B |
|
||
| Technology Manufacturing | 1 | $35B |
|
||
Price history
+104.7% since first listed2 events — show timeline
- 2026-05-30 Listed $169,900 RACC
- 2019-10-03 Sold (Public Records) $83,000 Public Records
Property tax history
+9.9%/yrLatest (2025): $675 · +9.1% YoY. Source: county tax records.
Cash-flow waterfall
monthlySold comps — $/sqft
last 12 mo · ≤1 miLoading sold comps…