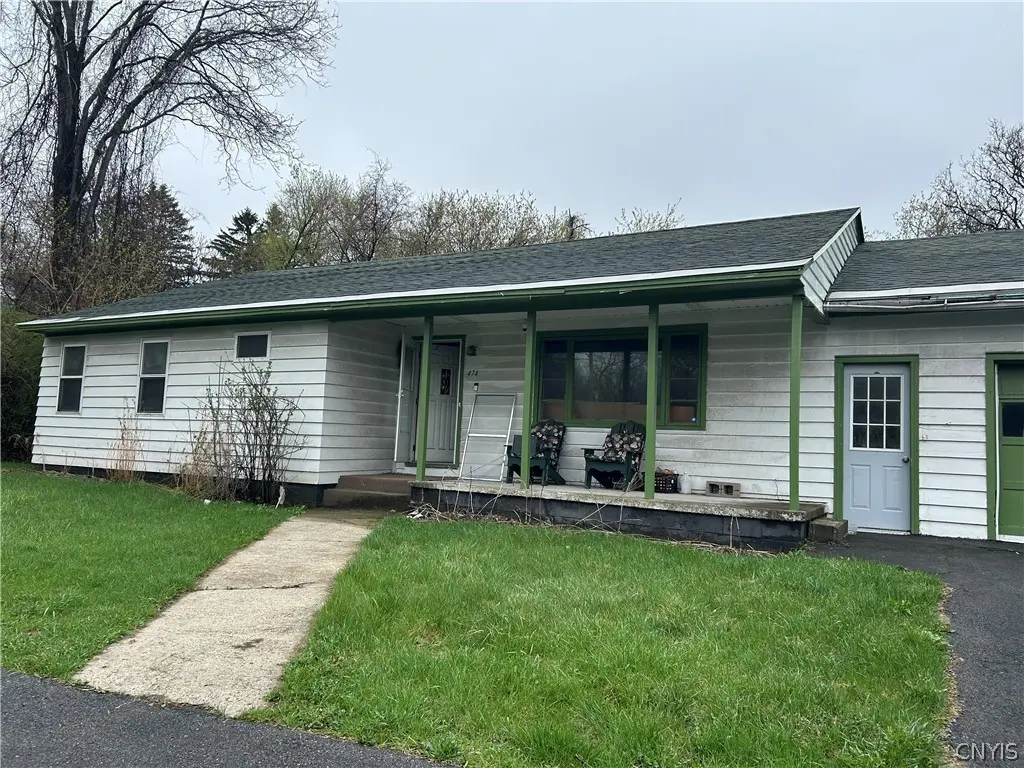
474 E Seneca Trnpke Tpke · Syracuse, NY
Flood risk 1/10 · Minimal
- FEMA flood zone
- X (unshaded)
- Chance of flooding over 30 yrs
- 0.0%
- Est. flood insurance / yr
- $473 – $860
Fire risk 1/10 · Minimal
- Est. fire insurance / yr
- $691 – $1,283
Heat risk 2/10 · Minimal
- Hot days now (above 93°F)
- 7 days/yr
- Hot days in 30 yrs
- 14 days/yr
Wind risk 1/10 · Minimal
- Chance of severe wind over 30 yrs
- 0.0%
Air-quality risk 2/10 · Minimal
- Unhealthy air days now
- 0 days/yr
- Unhealthy air days in 30 yrs
- 1 days/yr
Risk factors via First Street. Map © Google.
Why this score? — see what drove the B+ grade
The composite is a weighted blend of 9 inputs, each scored 0–100. Each bar is that input's sub-score; the figure is the points it added to the 100-point composite (weight × sub-score).
- Cash flow +27.5/30.0
- ARV discount +12.7/15.0
- Appreciation +10.0/10.0
- DSCR +9.6/10.0
- 1% rule +6.5/10.0
- Livability +3.9/5.0
- Rent growth +2.5/5.0
- Condition / age +2.5/5.0
- Schools +1.8/10.0
$129,900
🖨 Deal sheet (PDF) 📄 Offer letter ✓ Due diligence
Listing remarks
With a little bid of work and elbow grease this is definitely a great house. When you walk in the front door, you will see a large living room, leading into a formal dining room and updated eat-in kitchen. down the hall 2 very large bedrooms, master bedroom/suite has it's own bathroom and a 2nd bathroom as well. Basement is very large, it's all framed in and ready to have more living space! VERY VERY LARGE AND PRIVATE BACKYARD, A GREAT HOUSE AND DEFINETELY A MUST SEE!
Key facts
- Large bedrooms
- Formal dining room
- Private backyard
Tags
Property features AI
Exterior
- Parking: Attached garage; Circular driveway; 1 garage space
- Utilities: Public water (connected); Sewer connected
- Home design: One-story property; Resale fixer condition
- Construction: Aluminum siding; Block foundation; Existing construction
- Exterior features: Irregular lot; Near public transit; Residential lot; City street frontage; Full basement
Interior
- Kitchen: Eat-in kitchen
- Bedrooms: 2 main-level bedrooms
- Flooring: Hardwood; Vinyl; Varies
- Bathrooms: 2 full bathrooms; 1 half bathroom; 2 main-level bathrooms
- Heating & cooling: Gas heating; Forced air; See remarks for additional heating/cooling details
- Interior features: Separate/formal dining room; Eat-in kitchen; Other interior features (see remarks)
Neighborhood map
What this means for you Summary
Snapshot
- This is a 2-bed/2.5-bath single-family listed at $130k.
Deal economics
- At list price, monthly cash flow is $383 ($5k/yr) — positive.
- The deal already cash-flows at list — no discount required.
- Meets the 1% rule at list price ($1k rent vs $130k).
Location & tenants
- Location reads 77/100 on livability (#187 in NY, #2,869 nationally) — a middle-class / working-renter tenant base. Strengths: amenities A+, commute A+, cost of living A+; Watch: crime F, employment D-.
- Syracuse City School District (urban): math 18% / reading 26% proficiency, ranked #590 of 590 in NY (top 100%) — low school quality limits family demand, transient renter base, plan for 1-2y turnover; 74% free/reduced lunch — lower-income household profile, screen leases tightly.
- Zoned schools: Syracuse Latin School (math 31% / reading 62%, grade D-, #1,262 of 2,108 statewide, top 60%, 642 students, 42% FRL); Clary Middle School (math 2% / reading 14%, grade F, #724 of 729 statewide, top 99%, 275 students, 89% FRL); Corcoran High School (math 61% / reading 62%, grade B-, #842 of 1,100 statewide, top 77%, 1,252 students, 87% FRL) — zoned schools at 73% FRL track the district average.
- Zoned-school proficiency averages 39% at this address vs 22% district-wide (+17 pts) — the actual schools serving this property are materially stronger than the Syracuse City School District average implies; a family-tenant draw the district grade alone would hide.
- Market conditions: 68 active listings in the ZIP; 6 comparable units currently listed for rent nearby; rentals at typical pace (median 15d on market — plan ~3-4 weeks tenant-placement turnaround); 616 units permitted in Onondaga County in 2024 (256 in 5+ unit buildings).
Forward outlook
- In year one you build about $14k of equity ($898 loan paydown + $13k appreciation (10.0% local appreciation)).
- Onondaga County population projected to shrink 9% by 2050 — rents likely to lag national; underwrite the cash flow, not the appreciation.
- At projected returns (10.0% appreciation + 3.0% rent growth), your $36k cash investment doubles in ~2 years — after that, you're playing with house money.
- By year 3, paydown + projected appreciation supports a ~$35k cash-out refi (75% LTV) — recoverable capital for the next deal without selling this one.
Negotiation context
- Only 12 days on market — expect competitive offers; lowballing is unlikely to land.
Risks & watch-outs
- Watch-outs: built in 1950 — expect roof / HVAC / electrical / plumbing capex.
Questions for the listing agent
- Built in 1950 — when were the roof, HVAC, electrical panel, plumbing, and water heater last replaced?
- Is there a deadline driving the sale (1031 exchange, divorce, estate, relocation)? That informs how much negotiation room exists.
- Schools are D-rated, which usually means shorter tenancies and higher turnover. Who's the typical renter profile here, and what's been the actual vacancy rate?
- Crime grade is F in this area — have there been break-ins, vandalism, or insurance claims at this property in the last 3 years? What carrier currently insures it and at what premium?
- What's the average days-on-market for RENTAL listings here right now (not sales)? A rising rental-DOM trend means longer vacancies and softer asking-rent achievability than the comps imply.
- What's the recent tenant-quality profile in this submarket — average credit score on applications, eviction rate, late-payment / NSF rate, and stable-employment percentage? A property-management company in the area should have these aggregated.
- How much new for-sale + rental construction is in the pipeline within 1–3 miles? Heavy new supply typically softens prices + rents 12–24 months out; constrained supply supports both.
Investment metrics
- 1% rule
- 1.15% ✓
- Cap rate
- 9.83%
- Cash-on-cash
- 12.63%
- DSCR
- 1.56
- GRM
- 7.3
CMA / ARV
- ARV (on-the-fly)
- $146,784
- Comps found
- 12
Show comp detail 12 sales within ~0.75 mi
| Address | Dist | Beds/Ba | Sqft | Sold | Price | $/sf | Match |
|---|---|---|---|---|---|---|---|
| 430 Monticello Dr N | 0.33mi | 2/1.0 | 1,048 (-1%) | 2mo | $146,000 | $139 | 76 |
| 400 Monticello Dr N | 0.30mi | 2/1.0 | 970 (-8%) | 3mo | $127,000 | $131 | 64 |
| 418 Clarence Ave | 0.31mi | 2/1.0 | 924 (-12%) | 2mo | $120,000 | $130 | 56 |
| 140 Weymouth Rd | 0.64mi | 2/1.0 | 1,050 (-1%) | 10mo | $210,000 | $200 | 55 |
| 339 Lafayette Rd | 0.69mi | 2/1.5 | 1,120 (+6%) | 7mo | $253,485 | $226 | 48 |
| 330 E Florence Ave | 0.45mi | 3/1.0 (+1) | 1,172 (+11%) | 8mo | $156,000 | $133 | 44 |
| 158 Sunrise Dr | 0.47mi | 2/1.0 | 975 (-8%) | 20mo | $172,000 | $176 | 43 |
| 119 Cordova St | 0.44mi | 3/1.5 (+1) | 1,136 (+8%) | 19mo | $140,000 | $123 | 42 |
| 336 E Florence Ave | 0.44mi | 3/1.0 (+1) | 1,162 (+10%) | 18mo | $99,875 | $86 | 37 |
| 419 Seneca Dr | 0.36mi | 2/1.0 | 904 (-14%) | 23mo | $150,000 | $166 | 34 |
| 401 Sunrise Dr | 0.67mi | 3/1.0 (+1) | 1,192 (+13%) | 14mo | $206,000 | $173 | 25 |
| 170 W Florence Ave | 0.73mi | 3/1.0 (+1) | 936 (-11%) | 20mo | $125,000 | $134 | 19 |
Match score weights: distance 35% · size 25% · config 20% · recency 20%. Top-matched comps best support the ARV.
Projected returns pro-forma
10.0% appreciation · 3.0% rent growth · sell at horizon
- IRR
- 33.5%
- Equity multiple
- 3.61×
- Total profit
- $95,080
- Equity at exit
- $117,024
- IRR
- 28.9%
- Equity multiple
- 8.17×
- Total profit
- $260,747
- Equity at exit
- $252,367
Cash invested: $36,372 (down + closing). Projections, not guarantees.
Landlord ↔ Tenant lean methodology
- Overall (STATE)
- 15 Strongly Tenant-Friendly
- State New York
- 15 Strongly Tenant-Friendly · D+10
- County
- — inherits STATE
- City
- — inherits STATE
ZIP-level market 13205
- Home prices YoY
- 3.0%
- Active inventory
- 68
- Price-to-rent
- 7.3×
Monthly cashflow live
- Estimated rent
- $1,491 high interval (Pro) →
- Mortgage (P&I)
- −$681
- Tax from tax record
- −$60 /mo · $715/yr
- Insurance
- −$54
- HOA
- −$0
- Vacancy / Maint / Mgmt
- −$313
- Net cashflow
- $383
Break-even live
Sensitivity live
| Price | -10% $456 | -5% $419 | +0% $383 | +5% $346 | +10% $309 |
|---|---|---|---|---|---|
| Rent | -10% $265 | -5% $324 | +0% $383 | +5% $442 | +10% $500 |
| Rate | -1.0pp $448 | -0.5pp $416 | base $383 | +0.5pp $349 | +1.0pp $315 |
UW: 25.0% down · 7.5% · 30yr · 1.5% tax · 5.0% vac · 8.0% maint · 8.0% mgmt
Financing live
Cash to close
- Down payment
- $32,475
- Closing costs
- $3,897
- Reserves months
- —
- Total cash needed
- —
Loan-product check · same deal, 3 products live
Conventional
25% down · 7.5% · 30yr
- Down + closing
- —
- Monthly P&I
- —
- Monthly cashflow
- —
- DSCR
- —
- Eligible?
- —
Personal DTI + credit; lowest rate.
DSCR
20% down · 8.5% · 30yr
- Down + closing
- —
- Monthly P&I
- —
- Monthly cashflow
- —
- DSCR
- —
- Eligible?
- —
No personal income docs; deal must DSCR.
Hard money
10% down · 12.0% · 12mo
- Down + closing
- —
- Monthly P&I
- —
- Monthly cashflow
- —
- DSCR
- —
- Eligible?
- —
Short-term bridge; refi at stabilization.
Rent comps 6 comps
| Address | Beds | Baths | Sqft | Rent | $/sqft | DOM | Units | Dist |
|---|---|---|---|---|---|---|---|---|
| 683 E Seneca Tpke Syracuse, NY | 1.0–2.0 | 1.0–2.0 | 937 | $1,550 | $1.65 | 15d | 4 | 0.34mi |
| 102 Newbury Hollow Ln Syracuse, NY | 2.0 | 1.5 | 1200 | $1,550 | $1.29 | 15d | 1 | 0.70mi |
| 116 Newbury Hollow Ln Syracuse, NY | 1.0–2.0 | 1.0 | 825 | $1,295 | $1.57 | 15d | 7 | 0.73mi |
| 147 E Matson Ave Syracuse, NY | 3.0 | 2.5 | 1421 | $2,000 | $1.41 | 22d | 1 | 0.81mi |
| 2859 S Salina St Unit 2 Syracuse, NY | 2.0 | 1.0 | 1000 | $1,200 | $1.20 | 45d | 1 | 1.25mi |
| 300 Mains Ave Unit Bradford-7 Syracuse, NY | 2.0 | 1.0 | 1200 | $1,100 | $0.92 | 15d | 1 | 1.27mi |
Listing history 2 events
-
2026-04-29status Pending
-
2026-04-17$129,900 Active
ⓘ Source: listings_history table (triggers on properties + properties_extension) + one-shot
backfill from property_details.listing_events for pre-trigger history.
Tax reassessment forecast NY · Partial reset (capped growth)
- Current annual tax
- $715 · $60/mo
- Projected year-2 tax
- $1,455 · $121/mo
- Expected delta
- +$740/yr (+$62/mo · 103.5%)
ⓘ Screening estimate from a state-policy table — verify with the county assessor before closing.
Climate risk First Street
- Flood 1/10 Low FEMA zone X (unshaded) · 0% chance over 30 yrs
- Wildfire 1/10 Low
- Heat 2/10 Low 7 d/yr ≥93°F today · 14 d/yr by 30 yrs out
- Wind 1/10 Low 0% chance of damaging wind over 30 yrs
- Air quality 2/10 Low 0 unhealthy d/yr today · 1 by 30 yrs out
Nearby sold comps map
Loading sold comps map…
Walkable amenities ~0.75 mi
Loading nearby amenities…
Taxation est. · year 1
- Rental income
- $17,888
- − Mortgage interest
- −$7,276
- − Property taxes
- −$715
- − Insurance
- −$650
- − Repairs & maintenance
- −$1,431
- − Management
- −$1,431
- − Depreciation
- −$3,779
- Taxable income
- $2,606
- Est. tax owed @ 24.0%
- −$625
- After-tax cash flow
- $3,967/yr
For passive investors: Depreciation is non-cash, so a rental often shows a tax loss while cash-flowing — sheltering income. Rental losses are passive: they offset passive income freely, and up to $25,000/yr can offset ordinary (W-2) income if you actively participate and your MAGI is under $100k (phasing out to $0 by $150k); unused losses carry forward. On sale, claimed depreciation is recaptured at up to 25%, and gains may owe capital-gains tax (a 1031 exchange can defer both). Figures are a year-1 estimate at your 24.0% rate — not tax advice; consult a CPA.
Schools (NCES district)
- District
- Syracuse City School District
- NCES district ID
- 3628590
- Math proficiency
- 18% ▼ -5.00%
- Reading proficiency
- 26% ▬ 0.00%
- Median HH income
- $32,097
- Composite
- 17.83/100
- National rank
- #9007
- State rank
- #590 of 590 in NY
Livability — Syracuse
- Score
- 77/100
- State rank
- #187
- US rank
- #2869
Category grades
Schools grade is shown separately in the Schools card above.
Census & demographics
- Census place
- Syracuse, NY
- City population
- 152,627
- Population (ZIP)
- 18,562
Population outlook (Onondaga County) Hauer SSP2
- Today (2025)
- 467,894 people
- By 2030
- 463,381 · -1.0%
- By 2040
- 447,697 · -4.3%
- By 2050
- 426,399 · -8.9%
- By 2075
- 373,661 · -20.1%
- By 2100
- 307,967 · -34.2%
Race, ethnicity, and origin ACS 2023
- Neighborhood character
- Diverse neighborhood (Simpson 0.67)
- Race & ethnicity
- Black 44% White 37% Two or more races 10% Hispanic / Latino 6% Asian 3%
- Hispanic origin (detail)
- Puerto Rican 4%
- Common ancestry
- Romanian 2% Italian 2% Swiss 1%
- Foreign-born
- 9% · Canada, China, Vietnam
- Languages at home
- 87% English-only · Spanish 5% Arabic 1% Other Indo-European 1%
Political lean MEDSL · Onondaga
- 2024 margin
- D (+17.3) · D 58.6% · R 41.4%
- 2008→2024 swing
- -3.0pp toward R · 2008: 20.3pp · 2024: 17.3pp
- All cycles
- 2024: D+17.3 2020: D+20.6 2016: D+12.8 2012: D+21.1 2008: D+20.3
Not yet ingested
- Civics
- —
Market trends
- HPI YoY
- ▲ 10.12%
- Current HPI
- 345.8854
- Rent YoY
- —
- Metro
- —
- State GDP YoY
- ▲ 2.60%
- F500 in state
- 92
Industry mix (Fortune 500 HQ in NY)
| Industry | F500 HQs | Revenue |
|---|---|---|
| Financial Services | 10 | $950B |
|
||
| Consumer Goods | 9 | $162B |
|
||
| Insurance | 4 | $225B |
|
||
| Telecommunications | 2 | $144B |
|
||
| Pharmaceuticals | 2 | $112B |
|
||
| Media / Entertainment | 2 | $69B |
|
||
Price history
2 events — show timeline
- 2026-04-29 Pending — CNYIS
- 2026-04-17 Listed $129,900 CNYIS
Property tax history
+0.1%/yrLatest (2025): $715 · +0.0% YoY. Source: county tax records.
Cash-flow waterfall
monthlySold comps — $/sqft
last 12 mo · ≤1 miLoading sold comps…