 🏗️ New Construction
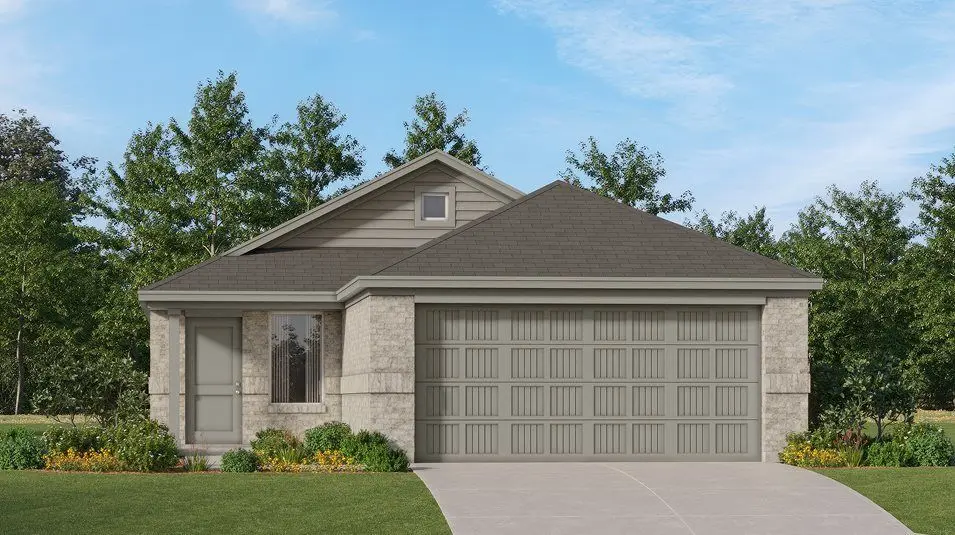
Kitson Plan · San Antonio, TX
Flood risk No data
- FEMA flood zone
- —
- Chance of flooding over 30 yrs
- —
- Est. flood insurance / yr
- —
Fire risk No data
- Est. fire insurance / yr
- —
Heat risk No data
- Hot days now (above threshold)
- —
- Hot days in 30 yrs
- —
Wind risk No data
- Chance of severe wind over 30 yrs
- —
Air-quality risk No data
- Unhealthy air days now
- —
- Unhealthy air days in 30 yrs
- —
Risk factors via First Street. Map © Google.
Why this score? — see what drove the F grade
The composite is a weighted blend of 9 inputs, each scored 0–100. Each bar is that input's sub-score; the figure is the points it added to the 100-point composite (weight × sub-score).
- ARV discount +7.5/15.0
- Cash flow +7.1/30.0
- Appreciation +6.0/10.0
- Livability +4.0/5.0
- Condition / age +2.5/5.0
- 1% rule +2.0/10.0
- Schools +1.8/10.0
- DSCR +1.3/10.0
- Rent growth +0.7/5.0
$206,499
🖨 Deal sheet 📄 Offer letter ✓ Due diligence
Listing remarks
This single-level home showcases a spacious open floorplan shared between the kitchen, dining area and family room for easy entertaining during gatherings. An owner's suite enjoys a private location in a rear corner of the home, complemented by an en-suite bathroom and walk-in closet. There are two secondary bedrooms along the side of the home, which are comfortable spaces for household members and overnight guests.
Key facts
- Walk-in closet
- Open floorplan
- Secondary bedrooms
Tags
Property features AI
Finance
- Other: Listing status: Active
- Financial info: List price $205,999
Exterior
- Parking: 2 garage spaces; 2 total parking spaces
- Home design: Kitson plan (new construction); Address: San Antonio, TX 78221
- Construction: New construction (Plan); Listed 2026
- Exterior features: Living area approximately 1402
Interior
- Kitchen: New-construction plan kitchen
- Bedrooms: 3 bedrooms
- Bathrooms: 2 full bathrooms
- Interior features: Open living area (plan)
Neighborhood map
What this means for you Summary
Snapshot
- This is a 3-bed/2.0-bath single-family listed at $206k.
Deal economics
- At list price, monthly cash flow is $-325 ($-4k/yr) — negative.
- To cash-flow at today's rent, offer at most $182k (11.8% below list).
- To meet the 1% rule (rent ≥ 1% of price), the offer needs to be $159k (22.9% below list).
- Recommended offer: $159k (22.9% below list) — sets the bar for 1% rule.
- Cap rate 4.6% vs local median 3.8% in San Antonio — meaningfully above typical; check what's discounted (condition, days-on-market, listing class) to confirm the premium yield is real.
Location & tenants
- Location reads 80/100 on livability (#31 in TX, #1,616 nationally) — a professional / high-income tenant draw. Strengths: amenities A+, commute A+, cost of living A+; Watch: schools C-, crime F.
- Southside ISD (rural): math 16% / reading 25% proficiency, ranked #771 of 826 in TX (top 93%) — low school quality limits family demand, transient renter base, plan for 1-2y turnover; 76% free/reduced lunch — lower-income household profile, screen leases tightly.
- Market conditions: Rents falling (-7.2%/yr); 369 active listings in the ZIP; 20 comparable units currently listed for rent nearby; rentals at typical pace (median 24d on market — plan ~3-4 weeks tenant-placement turnaround); 8,308 units permitted in Bexar County in 2024 (2,506 in 5+ unit buildings).
Forward outlook
- In year one you build about $6k of equity ($2k loan paydown + $5k appreciation (2.0% local appreciation)).
- Bexar County population projected at +50% by 2050 — long-run rental-demand tailwind backs the buy-and-hold thesis.
- By year 6, paydown + projected appreciation supports a ~$34k cash-out refi (75% LTV) — recoverable capital for the next deal without selling this one.
Negotiation context
- It's been on market 48 days — a 3% lower offer ($200k) is reasonable based on typical stale-listing flexibility.
Questions for the listing agent
- What do current leases actually rent for vs. the listed asking? Can we see a recent rent roll and the last 12 months of T-12 income?
- It's been on market 48 days. Have you received any prior offers? Is the seller open to a 23% concession, seller financing, or rate buy-down credit?
- Is there a deadline driving the sale (1031 exchange, divorce, estate, relocation)? That informs how much negotiation room exists.
- Crime grade is F in this area — have there been break-ins, vandalism, or insurance claims at this property in the last 3 years? What carrier currently insures it and at what premium?
- The area grade is low — what's the realistic commute time and amenity access for the typical tenant pool here? Any planned neighborhood developments (good or bad) we should know about?
- What's the average days-on-market for RENTAL listings here right now (not sales)? A rising rental-DOM trend means longer vacancies and softer asking-rent achievability than the comps imply.
- What's the recent tenant-quality profile in this submarket — average credit score on applications, eviction rate, late-payment / NSF rate, and stable-employment percentage? A property-management company in the area should have these aggregated.
- How much new for-sale + rental construction is in the pipeline within 1–3 miles? Heavy new supply typically softens prices + rents 12–24 months out; constrained supply supports both.
Investment metrics
- 1% rule
- 0.70% ✗
- Cap rate
- 4.59%
- Cash-on-cash
- -6.08%
- DSCR
- 0.73
- GRM
- 12.0
CMA / ARV
- ARV (median comp)
- $229,109
- List price
- $206,499
- Delta
- -9.87%
- Verdict
- FAIR
- Comps
- 20 within 1.0 mi
Show comp detail 12 sales within ~0.75 mi
| Address | Dist | Beds/Ba | Sqft | Sold | Price | $/sf | Match |
|---|---|---|---|---|---|---|---|
| 1706 Charlie Cv | 0.24mi | 3/2.0 | 1,411 (+1%) | 1mo | $194,999 | $138 | 87 |
| 1714 Charlie Cv | 0.26mi | 3/2.0 | 1,402 (0%) | 1mo | $193,999 | $138 | 87 |
| 1731 Charlie Cv | 0.29mi | 3/2.0 | 1,402 (0%) | 1mo | $197,999 | $141 | 86 |
| 1740 Charlie Cv | 0.29mi | 3/2.0 | 1,402 (0%) | 2mo | $191,999 | $137 | 85 |
| 1752 Charlie Cv | 0.32mi | 3/2.0 | 1,411 (+1%) | 1mo | $184,999 | $131 | 83 |
| 13234 Club House Blvd | 0.71mi | 4/2.0 (+1) | 1,377 (-2%) | 1mo | $246,675 | $179 | 58 |
| 1722 Charlie Cv | 0.27mi | 4/2.0 (+1) | 1,600 (+14%) | 2mo | $209,999 | $131 | 57 |
| 1736 Charlie Cv | 0.35mi | 4/2.0 (+1) | 1,575 (+12%) | 2mo | $205,999 | $131 | 56 |
| 14711 Star Cactus | 0.55mi | 3/2.0 | 1,206 (-14%) | 1mo | $200,500 | $166 | 50 |
| 2003 Organ Pipe Cactus | 0.54mi | 3/2.0 | 1,206 (-14%) | 1mo | $207,500 | $172 | 50 |
| 14836 Gold Lace Cactus | 0.58mi | 4/2.5 (+1) | 1,543 (+10%) | 0mo | $215,000 | $139 | 49 |
| 2213 Organ Pipe Cactus | 0.71mi | 3/2.0 | 1,206 (-14%) | 0mo | $217,030 | $180 | 44 |
Match score weights: distance 35% · size 25% · config 20% · recency 20%. Top-matched comps best support the ARV.
Projected returns pro-forma
2.03% appreciation · 0.0% rent growth · sell at horizon
- IRR
- -2.7%
- Equity multiple
- 0.86×
- Total profit
- $-9,297
- Equity at exit
- $90,720
- IRR
- 0.6%
- Equity multiple
- 1.09×
- Total profit
- $5,455
- Equity at exit
- $130,909
Cash invested: $64,151 (down + closing). Projections, not guarantees.
Landlord ↔ Tenant lean methodology
- Overall (STATE)
- 87 Strongly Landlord-Friendly
- State Texas
- 87 Strongly Landlord-Friendly · R+5
- County
- — inherits STATE
- City
- — inherits STATE
ZIP-level market 78221
- Home prices YoY
- 0.8%
- Rents YoY
- -7.2%
- Active inventory
- 369
- Price-to-rent
- 10.8×
Monthly cashflow live
- Estimated rent
- $1,593 high interval (Pro) →
- Mortgage (P&I)
- −$1,201
- Tax est. 1.5%
- −$286 /mo · $3,437/yr
- Insurance
- −$95
- HOA
- −$0
- Vacancy / Maint / Mgmt
- −$335
- Net cashflow
- $-325
Break-even live
UW: 25.0% down · 7.5% · 30yr · 1.5% tax · 5.0% vac · 8.0% maint · 8.0% mgmt
Financing live
Cash to close
- Down payment
- $57,277
- Closing costs
- $6,873
- Reserves months
- —
- Total cash needed
- —
Loan-product check · same deal, 3 products live
Conventional
25% down · 7.5% · 30yr
- Down + closing
- —
- Monthly P&I
- —
- Monthly cashflow
- —
- DSCR
- —
- Eligible?
- —
Personal DTI + credit; lowest rate.
DSCR
20% down · 8.5% · 30yr
- Down + closing
- —
- Monthly P&I
- —
- Monthly cashflow
- —
- DSCR
- —
- Eligible?
- —
No personal income docs; deal must DSCR.
Hard money
10% down · 12.0% · 12mo
- Down + closing
- —
- Monthly P&I
- —
- Monthly cashflow
- —
- DSCR
- —
- Eligible?
- —
Short-term bridge; refi at stabilization.
Rent comps 20 comps
| Address | Beds | Baths | Sqft | Rent | $/sqft | DOM | Units | Dist |
|---|---|---|---|---|---|---|---|---|
| 1711 Cody Clf San Antonio, TX | 3.0 | 2.5 | 1689 | $1,695 | $1.00 | 24d | 1 | 0.25mi |
| 1003 Beck Rd San Antonio, TX | 3.0 | 2.0 | 1213 | $1,490 | $1.23 | 4d | 1 | 0.43mi |
| 1030 Snedeker DR San Antonio, TX | 4.0 | 2.0 | 1500 | $1,499 | $1.00 | 24d | 1 | 0.43mi |
| 13806 S Strange Way San Antonio, TX | 4.0 | 2.0 | 1668 | $1,795 | $1.08 | 24d | 1 | 0.61mi |
| 1038 Janzen Rd San Antonio, TX | 3.0 | 2.0 | 1125 | $1,725 | $1.53 | 22d | 1 | 0.84mi |
| 1115 Janzen Rd San Antonio, TX | 3.0 | 2.0 | 1300 | $1,595 | $1.23 | 44d | 1 | 0.86mi |
| 1019 Magrum Way San Antonio, TX | 3.0 | 2.0 | 1300 | $1,445 | $1.11 | 11d | 1 | 0.90mi |
| 1019 Snedeker Dr San Antonio, TX | 3.0 | 2.0 | 1200 | $1,449 | $1.21 | 24d | 1 | 0.97mi |
| 13222 Dutra Rd San Antonio, TX | 3.0 | 2.0 | 1266 | $1,595 | $1.26 | 24d | 1 | 0.97mi |
| 907 Stricker Path San Antonio, TX | 3.0 | 2.0 | 1129 | $1,500 | $1.33 | 24d | 1 | 0.98mi |
| 1343 Art Wall Way San Antonio, TX | 3.0 | 2.0 | 1440 | $1,395 | $0.97 | 44d | 1 | 1.02mi |
| 1327 Mission Grande Unit 710 San Antonio, TX | 2.0 | 2.0 | 945 | $1,081 | $1.14 | 3d | 1 | 1.24mi |
| 934 Cook Bnd San Antonio, TX | 4.0 | 2.0 | 1627 | $1,445 | $0.89 | 24d | 1 | 1.27mi |
| 12030 Picard Bnd San Antonio, TX | 3.0 | 2.0 | 1450 | $1,495 | $1.03 | 3d | 1 | 1.29mi |
| 12055 Links Pkwy San Antonio, TX | 3.0 | 2.0 | 1479 | $1,625 | $1.10 | 24d | 1 | 1.30mi |
| 12015 Still Pass San Antonio, TX | 4.0 | 2.0 | 1635 | $1,600 | $0.98 | 20d | 1 | 1.34mi |
| 742 Haas Way San Antonio, TX | 4.0 | 2.0 | 1699 | $2,100 | $1.24 | 18d | 1 | 1.38mi |
| 718 Albatross Way San Antonio, TX | 3.0 | 2.0 | 1436 | $1,650 | $1.15 | 12d | 1 | 1.42mi |
| 12910 Clubhouse Blvd San Antonio, TX | 1.0–3.0 | 1.0–2.0 | 920 | $1,384 | $1.50 | 2d | 27 | 1.44mi |
| 11963 Sand Wedge Way San Antonio, TX | 3.0 | 3.5 | 1474 | $1,575 | $1.07 | 4d | 1 | 1.45mi |
Listing history 16 events
-
2026-06-18days on market $206,499 Active 48 DOM
-
2026-06-17days on market $206,499 Active 47 DOM
-
2026-06-16days on market $206,499 Active 46 DOM
-
2026-06-15days on market $206,499 Active 45 DOM
-
2026-06-13days on market $206,499 Active 43 DOM
-
2026-06-13pricedays on market $206,499 Active 42 DOM
-
2026-06-09days on market $205,999 Active 39 DOM
-
2026-06-08days on market $205,999 Active 38 DOM
-
2026-06-07days on market $205,999 Active 37 DOM
-
2026-06-04days on market $205,999 Active 34 DOM
-
2026-06-03days on market $205,999 Active 33 DOM
-
2026-06-02days on market $205,999 Active 32 DOM
-
2026-06-01days on market $205,999 Active 31 DOM
-
2026-05-31days on market $205,999 Active 30 DOM
-
2026-05-13price $205,999 419-char remark
-
2026-05-01$208,999 Active 419-char remark
ⓘ Source: listings_history table (triggers on properties + properties_extension) + one-shot
backfill from property_details.listing_events for pre-trigger history.
Nearby sold comps map
Loading sold comps map…
Walkable amenities ~0.75 mi
Loading nearby amenities…
Taxation est. · year 1
- Rental income
- $19,116
- − Mortgage interest
- −$12,834
- − Property taxes
- −$3,437
- − Insurance
- −$1,146
- − Repairs & maintenance
- −$1,529
- − Management
- −$1,529
- − Depreciation
- −$6,665
- Taxable loss
- −$8,024
- Est. tax savings @ 24.0%
- +$1,926
- After-tax cash flow
- $-1,973/yr
For passive investors: Depreciation is non-cash, so a rental often shows a tax loss while cash-flowing — sheltering income. Rental losses are passive: they offset passive income freely, and up to $25,000/yr can offset ordinary (W-2) income if you actively participate and your MAGI is under $100k (phasing out to $0 by $150k); unused losses carry forward. On sale, claimed depreciation is recaptured at up to 25%, and gains may owe capital-gains tax (a 1031 exchange can defer both). Figures are a year-1 estimate at your 24.0% rate — not tax advice; consult a CPA.
Schools (NCES district)
- District
- Southside ISD
- NCES district ID
- 4840920
- Math proficiency
- 16% ▼ -15.00%
- Reading proficiency
- 25% ▼ -2.00%
- Median HH income
- $43,526
- Composite
- 17.68/100
- National rank
- #9027
- State rank
- #771 of 826 in TX
Livability — San Antonio
- Score
- 80/100
- State rank
- #31
- US rank
- #1616
Category grades
Schools grade is shown separately in the Schools card above.
Census & demographics
- County
- Bexar County · 1,990,555 people
- City population
- 1,806,925
- Metro
- San Antonio-New Braunfels, TX
- Population (ZIP)
- 42,178
- Household income
- $63,811
- Rent vs Own
- Severe rent burden
- 1180.0
Population outlook (Bexar County) Hauer SSP2
- Today (2025)
- 2,336,851 people
- By 2030
- 2,560,728 · +9.6%
- By 2040
- 3,020,569 · +29.3%
- By 2050
- 3,493,522 · +49.5%
- By 2075
- 4,668,459 · +99.8%
- By 2100
- 5,533,242 · +136.8%
Race, ethnicity, and origin ACS 2023
- Neighborhood character
- Predominantly Hispanic (89%)
- Race & ethnicity
- Hispanic / Latino 89% Two or more races 28% White 9% Native American 2%
- Hispanic origin (detail)
- Mexican 74%
- Common ancestry
- Lithuanian 1% Romanian 1%
- Foreign-born
- 16% · Canada
- Languages at home
- 45% English-only · Spanish 54%
Political lean MEDSL · Bexar
- 2024 margin
- Lean D (+9.8) · D 54.3% · R 44.6% · Other 1.1%
- 2008→2024 swing
- +4.2pp toward D · 2008: 5.6pp · 2024: 9.8pp
- All cycles
- 2024: D+9.8 2020: D+18.2 2016: D+13.5 2012: D+4.6 2008: D+5.6
Not yet ingested
- Civics
- —
Market trends
- HPI YoY
- ▲ 2.03%
- Current HPI
- 251.1635
- Rent YoY
- ▼ -7.21%
- Metro
- San Antonio-New Braunfels, TX
- State GDP YoY
- ▲ 3.95%
- F500 in state
- 110
Industry mix (Fortune 500 HQ in TX)
| Industry | F500 HQs | Revenue |
|---|---|---|
| Energy | 16 | $1,198B |
|
||
| Technology | 5 | $198B |
|
||
| Engineering / Construction | 4 | $72B |
|
||
| Energy Services | 3 | $60B |
|
||
| Utilities | 3 | $41B |
|
||
| Healthcare | 2 | $330B |
|
||
Cash-flow waterfall
monthlySold comps — $/sqft
last 12 mo · ≤1 miLoading sold comps…