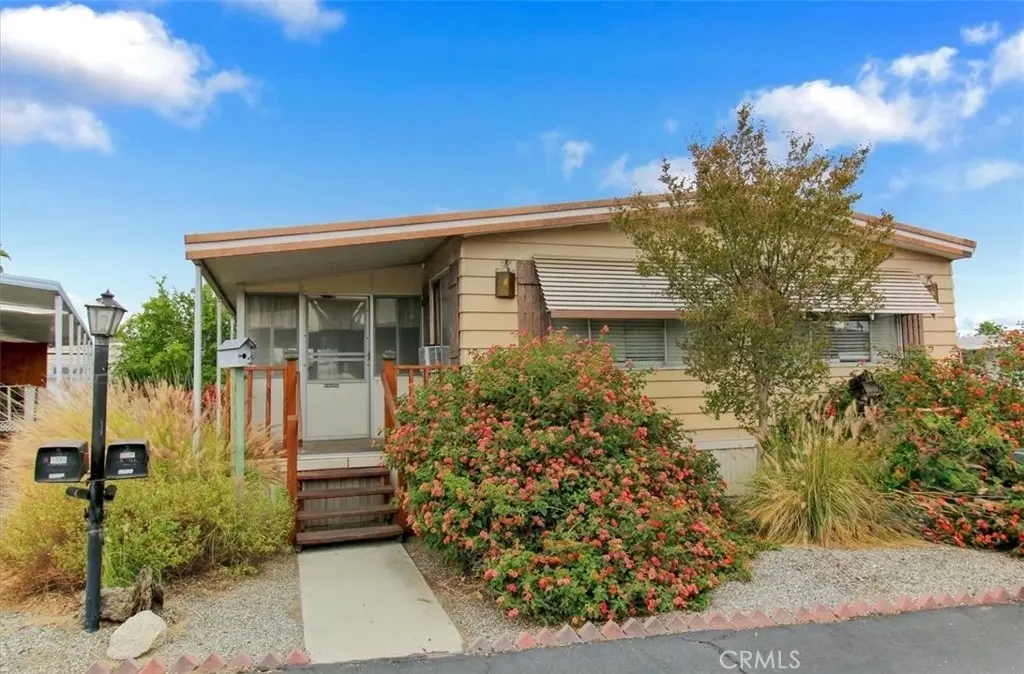
332 N Lyon #76 · Hemet, CA
Flood risk 1/10 · Minimal
- FEMA flood zone
- X (unshaded)
- Chance of flooding over 30 yrs
- 0.0%
- Est. flood insurance / yr
- $507 – $1,088
Fire risk 1/10 · Minimal
- Est. fire insurance / yr
- $659 – $1,223
Heat risk 7/10 · Major
- Hot days now (above 104°F)
- 6 days/yr
- Hot days in 30 yrs
- 16 days/yr
Wind risk 1/10 · Minimal
- Chance of severe wind over 30 yrs
- —
Air-quality risk 6/10 · Moderate
- Unhealthy air days now
- 12 days/yr
- Unhealthy air days in 30 yrs
- 14 days/yr
Risk factors via First Street. Map © Google.
Why this score? — see what drove the D grade
The composite is a weighted blend of 9 inputs, each scored 0–100. Each bar is that input's sub-score; the figure is the points it added to the 100-point composite (weight × sub-score).
- Cash flow +15.0/30.0
- ARV discount +7.5/15.0
- 1% rule +5.0/10.0
- DSCR +5.0/10.0
- Condition / age +3.8/5.0
- Rent growth +2.9/5.0
- Livability +2.6/5.0
- Schools +2.5/10.0
- Appreciation +0.0/10.0
$39,999
🖨 Deal sheet (PDF) 📄 Offer letter ✓ Due diligence
Listing remarks
Motivated seller! Here's your chance to own your very own little piece of paradise! This charming 2-bedroom 2 bath home has been recently painted and newer carpeting installed. One of the best locations in the park! Located on a nice sized corner lot directly across from the Eden Roc 55+ senior park Villa's clubhouse. Ample guest parking is also right across the street for added convenience of having your guest/family members over for those great get togethers! The interior of this home has laminate wood flooring throughout and newer carpeting in both bedrooms. Spacious main bedroom with walk in closet. Immaculately clean interior! Relax and feel a sense of peacefulness while drinking your
Key facts
- Shed
- Lemon tree
- Pomegranate tree
Tags
Property features AI
Finance
- Other: Located in Eden Roc Mobile Home Park near the clubhouse (corner of Devonshire and Lyon)
- Financial info: Land lease of $850 per month (park rent includes trash, water, sewer)
- HOA & community: Senior community; Community features include biking and hiking
Exterior
- Parking: Located in Eden Roc Park Villa
- Utilities: Public sewer; District/public water
- Home design: Single-story mobile home; Mobile home remains on site; Mobile home dimensions approximately 24' x 54'
- Construction: Year built reported by builder
- Exterior features: Community pool; Corner lot; Close to clubhouse
Interior
- Bathrooms: 1 full bathroom; 1 quarter bathroom
- Interior features: Entry at side of home; Entry level is the main floor
- Laundry & utility: Inside laundry room; Washer included; Dryer included
Neighborhood map
What this means for you Summary
Snapshot
- This is a 2-bed/2.0-bath manufactured listed at $40k. Condition is rated good.
Deal economics
- At list price, monthly cash flow is $1k ($15k/yr) — positive.
- The deal already cash-flows at list — no discount required.
- Meets the 1% rule at list price ($2k rent vs $40k).
- Recommended offer: $39k (3.0% below list) — sets the bar for market timing.
- Cap rate 43.9% vs local median 4.8% in Hemet — top-decile yield for the area; either an underpriced asset or a hidden risk that comps aren't pricing in. Stress-test before assuming the spread holds.
Location & tenants
- Location reads 51/100 on livability (#1,056 in CA) — a working-class tenant base; expect higher turnover. Strengths: housing A+; Watch: crime D+, schools F, amenities F.
- Hemet Unified (suburban): math 19% / reading 41% proficiency, ranked #360 of 517 in CA (top 70%) — families likely to look elsewhere, expect single-tenant / working-renter base with shorter leases; 66% free/reduced lunch — lower-income household profile, screen leases tightly.
- Market conditions: Rents rising (+1.8%/yr); 270 active listings in the ZIP; 40 comparable units currently listed for rent nearby; rentals at typical pace (median 20d on market — plan ~3-4 weeks tenant-placement turnaround); 9,195 units permitted in Riverside County in 2024 (1,512 in 5+ unit buildings).
- At $1,935/mo this rent would consume 47% of the median local household income ($49k/yr) (locally 2144% of renters already pay >50% of income on rent) — very limited rent-growth headroom before tenants either downsize or default.
Forward outlook
- Local home prices are declining (-3.0%/yr); year-one equity from $276 of loan paydown is wiped out by about $1k of value loss. Plan a longer hold.
- Riverside County population projected at +22% by 2050 — long-run rental-demand tailwind backs the buy-and-hold thesis.
- At projected returns (-3.0% appreciation + 1.8% rent growth), your $11k cash investment doubles in ~1 year — after that, you're playing with house money.
Negotiation context
- It's been on market 37 days — a 3% lower offer ($39k) is reasonable based on typical stale-listing flexibility.
Risks & watch-outs
- Climate carrying-cost: extreme-heat days projected 6→16/yr by 2055 (HVAC capex compounding) — expect insurance premiums to compound above CPI over the hold.
Questions for the listing agent
- It's been on market 37 days. Have you received any prior offers? Is the seller open to a 3% concession, seller financing, or rate buy-down credit?
- Built in 1975 — when were the roof, HVAC, electrical panel, plumbing, and water heater last replaced?
- Is there a deadline driving the sale (1031 exchange, divorce, estate, relocation)? That informs how much negotiation room exists.
- Schools are F-rated, which usually means shorter tenancies and higher turnover. Who's the typical renter profile here, and what's been the actual vacancy rate?
- Crime grade is D in this area — have there been break-ins, vandalism, or insurance claims at this property in the last 3 years? What carrier currently insures it and at what premium?
- The area grade is low — what's the realistic commute time and amenity access for the typical tenant pool here? Any planned neighborhood developments (good or bad) we should know about?
- What's the average days-on-market for RENTAL listings here right now (not sales)? A rising rental-DOM trend means longer vacancies and softer asking-rent achievability than the comps imply.
- What's the recent tenant-quality profile in this submarket — average credit score on applications, eviction rate, late-payment / NSF rate, and stable-employment percentage? A property-management company in the area should have these aggregated.
- How much new for-sale + rental construction is in the pipeline within 1–3 miles? Heavy new supply typically softens prices + rents 12–24 months out; constrained supply supports both.
Investment metrics
- 1% rule
- 4.84% ✓
- Cap rate
- 43.87%
- Cash-on-cash
- 134.19%
- DSCR
- 6.97
- GRM
- 1.7
CMA / ARV
- ARV (on-the-fly)
- $111,456
- Comps found
- 12
Show comp detail 12 sales within ~0.75 mi
| Address | Dist | Beds/Ba | Sqft | Sold | Price | $/sf | Match |
|---|---|---|---|---|---|---|---|
| 332 N Lyon Ave #67 | 0.08mi | 2/2.0 | 1,248 (-4%) | 3mo | $49,500 | $40 | 88 |
| 1895 W Devonshire #20 | 0.21mi | 2/2.0 | 1,344 (+4%) | 1mo | $44,000 | $33 | 83 |
| 1895 W Devonshire Ave #76 | 0.21mi | 2/2.0 | 1,344 (+4%) | 4mo | $55,000 | $41 | 81 |
| 1895 W Devonshire Ave #74 | 0.21mi | 3/2.0 (+1) | 1,344 (+4%) | 2mo | $80,000 | $60 | 77 |
| 542 Castille | 0.26mi | 2/2.0 | 1,392 (+7%) | 2mo | $239,000 | $172 | 74 |
| 1525 W Oakland Ave #62 | 0.15mi | 2/2.0 | 1,440 (+11%) | 2mo | $40,000 | $28 | 73 |
| 1420 Cabrillo Dr | 0.28mi | 2/2.0 | 1,440 (+11%) | 1mo | $247,500 | $172 | 68 |
| 1380 Cabrillo | 0.29mi | 2/2.0 | 1,152 (-11%) | 2mo | $260,000 | $226 | 66 |
| 1645 Sonora | 0.34mi | 2/2.0 | 1,440 (+11%) | 4mo | $199,900 | $139 | 62 |
| 430 N Palm #102 | 0.52mi | 2/1.5 | 1,200 (-7%) | 2mo | $45,000 | $38 | 60 |
| 1445-#88 W Florida | 0.37mi | 3/2.0 (+1) | 1,440 (+11%) | 1mo | $124,000 | $86 | 58 |
| 1450 Carlotta | 0.45mi | 2/2.0 | 1,440 (+11%) | 4mo | $204,000 | $142 | 58 |
Match score weights: distance 35% · size 25% · config 20% · recency 20%. Top-matched comps best support the ARV.
Projected returns pro-forma
-3.0% appreciation · 1.76% rent growth · sell at horizon
- IRR
- —
- Equity multiple
- 7.33×
- Total profit
- $70,931
- Equity at exit
- $5,964
- IRR
- —
- Equity multiple
- 14.84×
- Total profit
- $155,054
- Equity at exit
- $3,458
Cash invested: $11,200 (down + closing). Projections, not guarantees.
Landlord ↔ Tenant lean methodology
- Overall (STATE)
- 18 Strongly Tenant-Friendly
- State California
- 18 Strongly Tenant-Friendly · D+13
- County
- — inherits STATE
- City
- — inherits STATE
ZIP-level market 92543
- Home prices YoY
- -26.7%
- Rents YoY
- 1.8%
- Active inventory
- 270
- Price-to-rent
- 1.7×
Monthly cashflow live
- Estimated rent
- $1,935 high interval (Pro) →
- Mortgage (P&I)
- −$210
- Tax est. 1.5%
- −$50 /mo · $600/yr
- Insurance
- −$17
- HOA
- −$0
- Vacancy / Maint / Mgmt
- −$406
- Net cashflow
- $1,252
Break-even live
Sensitivity live
| Price | -10% $1,280 | -5% $1,266 | +0% $1,252 | +5% $1,239 | +10% $1,225 |
|---|---|---|---|---|---|
| Rent | -10% $1,100 | -5% $1,176 | +0% $1,252 | +5% $1,329 | +10% $1,405 |
| Rate | -1.0pp $1,273 | -0.5pp $1,263 | base $1,252 | +0.5pp $1,242 | +1.0pp $1,232 |
UW: 25.0% down · 7.5% · 30yr · 1.5% tax · 5.0% vac · 8.0% maint · 8.0% mgmt
Financing live
Cash to close
- Down payment
- $10,000
- Closing costs
- $1,200
- Reserves months
- —
- Total cash needed
- —
Loan-product check · same deal, 3 products live
Conventional
25% down · 7.5% · 30yr
- Down + closing
- —
- Monthly P&I
- —
- Monthly cashflow
- —
- DSCR
- —
- Eligible?
- —
Personal DTI + credit; lowest rate.
DSCR
20% down · 8.5% · 30yr
- Down + closing
- —
- Monthly P&I
- —
- Monthly cashflow
- —
- DSCR
- —
- Eligible?
- —
No personal income docs; deal must DSCR.
Hard money
10% down · 12.0% · 12mo
- Down + closing
- —
- Monthly P&I
- —
- Monthly cashflow
- —
- DSCR
- —
- Eligible?
- —
Short-term bridge; refi at stabilization.
Rent comps 40 comps
| Address | Beds | Baths | Sqft | Rent | $/sqft | DOM | Units | Dist |
|---|---|---|---|---|---|---|---|---|
| 1270 Rosalia Ave Unit 1 Hemet, CA | 2.0 | 1.0 | 900 | $1,800 | $2.00 | 44d | 1 | 0.22mi |
| 250 N Elk St Hemet, CA | 2.0 | 1.0 | 900 | $1,625 | $1.81 | 15d | 1 | 0.24mi |
| 1862 Pueblo Dr Hemet, CA | 2.0 | 2.0 | 977 | $1,900 | $1.94 | 44d | 1 | 0.24mi |
| 1862 Pueblo Dr Unit 1862 Hemet, CA | 2.0 | 2.0 | 977 | $1,750 | $1.79 | 25d | 1 | 0.24mi |
| 446 N Elk St Unit D Hemet, CA | 2.0 | 1.0 | 980 | $1,675 | $1.71 | 25d | 1 | 0.24mi |
| 543 La Cresta Dr Hemet, CA | 2.0 | 2.0 | 1544 | $1,595 | $1.03 | 44d | 1 | 0.26mi |
| 1315 W Latham Ave Hemet, CA | 3.0 | 2.5 | 1340 | $2,550 | $1.90 | 44d | 1 | 0.29mi |
| 1964 W Oakland Ave Hemet, CA | 2.0 | 2.0 | 977 | $1,695 | $1.73 | 19d | 1 | 0.30mi |
| 601 Corona St Hemet, CA | 2.0 | 2.0 | 882 | $1,700 | $1.93 | 0d | 1 | 0.33mi |
| 627 Solano Dr Hemet, CA | 2.0 | 2.0 | 882 | $1,800 | $2.04 | 19d | 1 | 0.33mi |
| 663 Mariposa Dr Hemet, CA | 2.0 | 2.0 | 1440 | $1,500 | $1.04 | 25d | 1 | 0.36mi |
| 1700 Walden Ln Hemet, CA | 3.0 | 2.0 | 1430 | $2,670 | $1.87 | 25d | 1 | 0.56mi |
| 2098 W Acacia Ave Hemet, CA | 1.0–3.0 | 1.0–2.0 | 895 | $2,035 | $2.27 | 0d | 1 | 0.62mi |
| 828 Coramdeo Ct Hemet, CA | 3.0 | 2.0 | 1543 | $3,000 | $1.94 | 44d | 1 | 0.65mi |
| 2014 Iris Way Hemet, CA | 3.0 | 2.0 | 1192 | $2,850 | $2.39 | 44d | 1 | 0.66mi |
| 2770 W Devonshire Ave Hemet, CA | 1.0–2.0 | 1.0–2.0 | 707 | $1,945 | $2.75 | 0d | 10 | 0.72mi |
| 1850 Amberwood Dr Hemet, CA | 2.0 | 2.0 | 1170 | $1,561 | $1.33 | 44d | 1 | 0.75mi |
| 2403 W Acacia Ave Hemet, CA | 2.0 | 2.0 | 910 | $1,995 | $2.19 | 8d | 1 | 0.77mi |
| 471 Whitney Dr Hemet, CA | 2.0 | 2.0 | 1085 | $1,800 | $1.66 | 6d | 1 | 0.78mi |
| 2469 W Acacia Ave Hemet, CA | 2.0 | 2.0 | 910 | $1,750 | $1.92 | 25d | 1 | 0.79mi |
| 1461 W Mayberry Ave Hemet, CA | 2.0 | 2.0 | 1044 | $1,750 | $1.68 | 44d | 1 | 0.83mi |
| 415 S Tahquitz Ave Hemet, CA | 3.0 | 2.0 | 1766 | $2,900 | $1.64 | 19d | 1 | 0.88mi |
| 471 S Simpson Ave Unit D Hemet, CA | 2.0 | 2.0 | 900 | $1,750 | $1.94 | 44d | 1 | 0.92mi |
| 2208 El Grande St Hemet, CA | 2.0 | 2.0 | 1327 | $2,100 | $1.58 | 19d | 1 | 0.94mi |
| 2208 El Grande St Hemet, CA | 2.0 | 2.0 | 1327 | $2,000 | $1.51 | 0d | 1 | 0.94mi |
| 363 S Gilbert St Hemet, CA | 3.0 | 2.0 | 1200 | $1,900 | $1.58 | 5d | 1 | 0.95mi |
| 363 S Gilbert St Unit B Hemet, CA | 3.0 | 2.0 | 1200 | $1,900 | $1.58 | 15d | 1 | 0.95mi |
| 853 Ensenada Dr Hemet, CA | 2.0 | 2.0 | 1350 | $1,875 | $1.39 | 13d | 1 | 0.95mi |
| 853 Ensenada Dr Hemet, CA | 2.0 | 2.0 | 1350 | $1,875 | $1.39 | 25d | 1 | 0.95mi |
| 811 Alondra Dr Hemet, CA | 2.0 | 2.0 | 1166 | $1,875 | $1.61 | 6d | 1 | 0.96mi |
| 1241 Sandlewood Dr Hemet, CA | 2.0 | 1.5 | 1504 | $2,000 | $1.33 | 44d | 1 | 1.00mi |
| 3030 W Acacia Ave Hemet, CA | 1.0–2.0 | 1.0–2.0 | 807 | $1,780 | $2.20 | 0d | 8 | 1.01mi |
| 611 S Palm Ave Unit K Hemet, CA | 2.0 | 2.0 | 1254 | $1,895 | $1.51 | 8d | 1 | 1.02mi |
| 1521 W Westmont Ave Hemet, CA | 2.0 | 2.0 | 1197 | $2,000 | $1.67 | 44d | 1 | 1.04mi |
| 424 W Mayberry Ave Unit 1 Hemet, CA | 1.0 | 1.0 | 1664 | $850 | $0.51 | 8d | 1 | 1.07mi |
| 743 Via Linda Dr Hemet, CA | 2.0 | 2.0 | 1206 | $1,995 | $1.65 | 6d | 1 | 1.07mi |
| 876 W Whittier Ave Unit 878 Hemet, CA | 2.0 | 2.0 | 1127 | $2,150 | $1.91 | 25d | 1 | 1.14mi |
| 683 Jonquil St Hemet, CA | 3.0 | 2.0 | 1150 | $2,448 | $2.13 | 25d | 1 | 1.16mi |
| 101 San Mateo Cir Hemet, CA | 2.0 | 2.0 | 1152 | $1,790 | $1.55 | 0d | 1 | 1.18mi |
| 3471 Dublin Ct Hemet, CA | 3.0 | 2.0 | 1276 | $2,895 | $2.27 | 5d | 1 | 1.20mi |
Listing history 16 events
-
2026-06-21days on market $39,999 Active 37 DOM
-
2026-06-18days on market $39,999 Active 34 DOM
-
2026-06-17days on market $39,999 Active 33 DOM
-
2026-06-16days on market $39,999 Active 32 DOM
-
2026-06-15days on market $39,999 Active 31 DOM
-
2026-06-13days on market $39,999 Active 29 DOM
-
2026-06-09days on market $39,999 Active 25 DOM
-
2026-06-08days on market $39,999 Active 24 DOM
-
2026-06-07days on market $39,999 Active 23 DOM
-
2026-06-04days on market $39,999 Active 20 DOM
-
2026-06-03days on market $39,999 Active 19 DOM
-
2026-06-02days on market $39,999 Active 18 DOM
-
2026-06-01days on market $39,999 Active 17 DOM
-
2026-05-31days on market $39,999 Active 16 DOM
-
2026-05-26price $39,999
-
2026-05-15$42,900 Active
ⓘ Source: listings_history table (triggers on properties + properties_extension) + one-shot
backfill from property_details.listing_events for pre-trigger history.
Climate risk First Street
- Flood 1/10 Low FEMA zone X (unshaded) · 0% chance over 30 yrs
- Wildfire 1/10 Low
- Heat 7/10 Severe 6 d/yr ≥104°F today · 16 d/yr by 30 yrs out
- Wind 1/10 Low
- Air quality 6/10 Major 12 unhealthy d/yr today · 14 by 30 yrs out
Nearby sold comps map
Loading sold comps map…
Walkable amenities ~0.75 mi
Loading nearby amenities…
Taxation est. · year 1
- Rental income
- $23,223
- − Mortgage interest
- −$2,241
- − Property taxes
- −$600
- − Insurance
- −$200
- − Repairs & maintenance
- −$1,858
- − Management
- −$1,858
- − Depreciation
- −$1,164
- Taxable income
- $15,303
- Est. tax owed @ 24.0%
- −$3,673
- After-tax cash flow
- $11,357/yr
For passive investors: Depreciation is non-cash, so a rental often shows a tax loss while cash-flowing — sheltering income. Rental losses are passive: they offset passive income freely, and up to $25,000/yr can offset ordinary (W-2) income if you actively participate and your MAGI is under $100k (phasing out to $0 by $150k); unused losses carry forward. On sale, claimed depreciation is recaptured at up to 25%, and gains may owe capital-gains tax (a 1031 exchange can defer both). Figures are a year-1 estimate at your 24.0% rate — not tax advice; consult a CPA.
Condition & rehab AI · 12 photos
This charming 2-bedroom home is in good condition with recent updates, making it a great investment opportunity.
Value-add opportunities
- Resale Paint exterior — Enhances curb appeal and value
- Rental Replace window screens — Improves comfort and energy efficiency
Renovation cost estimate screening
Value-add ROI direction
- Resale Paint exterior — Enhances curb appeal and value ↑
- Rental Replace window screens — Improves comfort and energy efficiency ↑
ⓘ Cost ranges are severity-bucket heuristics (US national rule-of-thumb). Get contractor quotes + a written scope before underwriting a rehab budget.
Schools (NCES district)
- District
- Hemet Unified
- NCES district ID
- 0616920
- Math proficiency
- 19% ▼ -3.00%
- Reading proficiency
- 41% ▲ 4.00%
- Median HH income
- $39,962
- Composite
- 25.16/100
- National rank
- #7517
- State rank
- #360 of 517 in CA
Livability — Hemet
- Score
- 51/100
- State rank
- #1056
- US rank
- #25208
Category grades
Schools grade is shown separately in the Schools card above.
Census & demographics
- Census place
- Hemet, CA
- County
- Riverside County · 2,287,001 people
- City population
- 137,670
- Metro
- Riverside-San Bernardino-Ontario, CA
- Population (ZIP)
- 39,937
- Household income
- $49,396
- Rent vs Own
- Severe rent burden
- 2144.0
Population outlook (Riverside County) Hauer SSP2
- Today (2025)
- 2,664,475 people
- By 2030
- 2,802,692 · +5.2%
- By 2040
- 3,050,904 · +14.5%
- By 2050
- 3,256,783 · +22.2%
- By 2075
- 3,655,058 · +37.2%
- By 2100
- 3,766,594 · +41.4%
Race, ethnicity, and origin ACS 2023
- Neighborhood character
- Diverse neighborhood (Simpson 0.61)
- Race & ethnicity
- Hispanic / Latino 54% White 30% Two or more races 18% Black 10% Native American 2% Asian 2%
- Hispanic origin (detail)
- Mexican 48% Puerto Rican 1%
- Common ancestry
- Slovak 1% Romanian 1% Portuguese 1%
- Foreign-born
- 21% · Canada
- Languages at home
- 59% English-only · Spanish 38% Arabic 1% Tagalog/Filipino 1%
Political lean MEDSL · Riverside
- 2024 margin
- Toss-up / Even · D 48.0% · R 49.3% · Other 2.6%
- 2008→2024 swing
- -3.6pp toward R · 2008: 2.3pp · 2024: -1.3pp
- All cycles
- 2024: R+1.3 2020: D+8.0 2016: D+4.3 2012: R+0.4 2008: D+2.3
Not yet ingested
- Civics
- —
Market trends
- HPI YoY
- ▼ -147.46%
- Current HPI
- 405.1277
- Rent YoY
- ▲ 1.76%
- Metro
- Riverside-San Bernardino-Ontario, CA
- State GDP YoY
- ▲ 3.21%
- F500 in state
- 116
Industry mix (Fortune 500 HQ in CA)
| Industry | F500 HQs | Revenue |
|---|---|---|
| Technology | 27 | $1,492B |
|
||
| Financial Services | 3 | $174B |
|
||
| Retail | 3 | $44B |
|
||
| Insurance | 3 | $26B |
|
||
| Media / Entertainment | 2 | $115B |
|
||
| Pharmaceuticals / Biotech | 2 | $62B |
|
||
Price history
-6.8% since first listed2 events — show timeline
- 2026-05-26 Price Changed $39,999 CRMLS
- 2026-05-15 Listed $42,900 CRMLS
Cash-flow waterfall
monthlySold comps — $/sqft
last 12 mo · ≤1 miLoading sold comps…