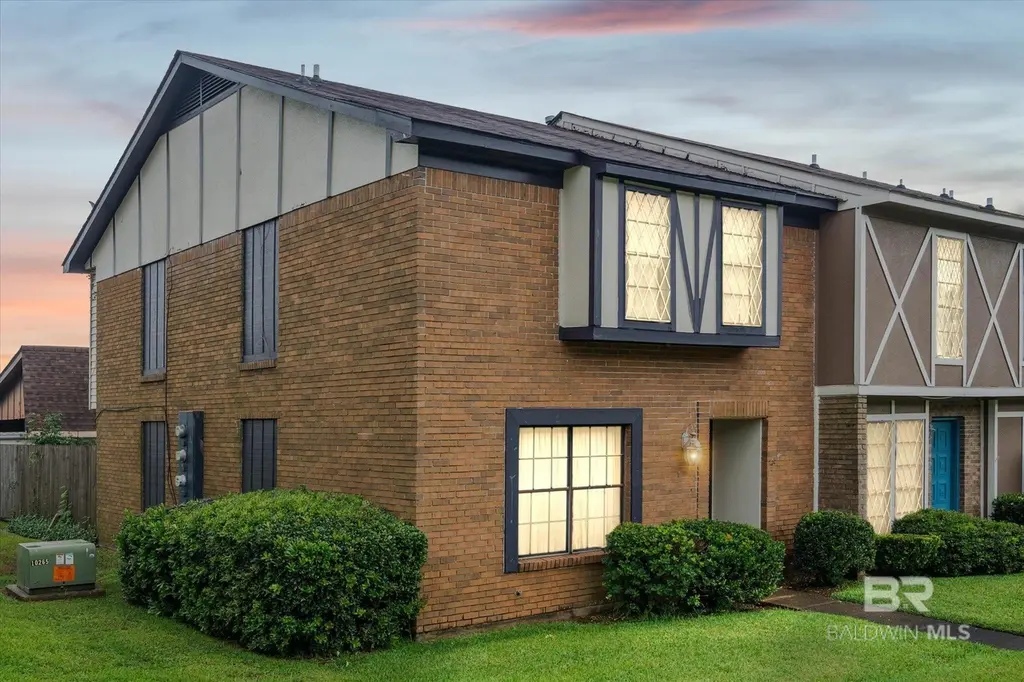
529 Highland Woods Dr #529 · Mobile, AL
Flood risk 1/10 · Minimal
- FEMA flood zone
- X (unshaded)
- Chance of flooding over 30 yrs
- 0.0%
- Est. flood insurance / yr
- $507 – $1,088
Fire risk 1/10 · Minimal
- Est. fire insurance / yr
- $916 – $1,700
Heat risk 9/10 · Severe
- Hot days now (above 105°F)
- 7 days/yr
- Hot days in 30 yrs
- 21 days/yr
Wind risk 9/10 · Severe
- Chance of severe wind over 30 yrs
- 99.0%
Air-quality risk 1/10 · Minimal
- Unhealthy air days now
- 0 days/yr
- Unhealthy air days in 30 yrs
- 0 days/yr
Risk factors via First Street. Map © Google.
Why this score? — see what drove the C+ grade
The composite is a weighted blend of 9 inputs, each scored 0–100. Each bar is that input's sub-score; the figure is the points it added to the 100-point composite (weight × sub-score).
- Cash flow +21.8/30.0
- ARV discount +15.0/15.0
- 1% rule +7.1/10.0
- DSCR +7.0/10.0
- Rent growth +4.0/5.0
- Livability +3.8/5.0
- Schools +2.3/10.0
- Condition / age +2.2/5.0
- Appreciation +0.0/10.0
$139,900
🖨 Deal sheet 📄 Offer letter ✓ Due diligence
Listing remarks
Fixer upper, Handyman special, Conveniently located near shopping, grocery stores, restaurants, and the University of South Alabama, this spacious3-bedroom, 2.5 bath townhome is an investor's dream, a great central location. The main level features a spacious living room, separate family room/den, kitchen with dining area overlooking the private fenced courtyard, a half bath, and convenient laundry area. Upstairs, the primary suite includes a private bath and 2 walk-in closets with two additional bedrooms and a full bath provide plenty of space, attached exterior storage room, and covered parking for two vehicles located directly behind the townhome, this home is a must see. Buyer responsib
Key facts
- $150 HOA
- Garage
- Built 1974
Tags
Property features AI
Finance
- HOA & community: Condominium ownership; Monthly association fee of $150 covering trash and other items; No community amenities listed
Exterior
- Parking: Detached double carport (2 covered spaces)
- Utilities: Public water; Electric service by Alabama Power
- Home design: Townhouse; Attached property; Two levels; Corner unit
- Construction: Brick, metal siding, and other exterior materials; Slab foundation; See remarks for roof
- Exterior features: Patio; Rear porch; Has view; Less than 1 acre lot; No waterfront
Interior
- Kitchen: Other appliances (see remarks)
- Bedrooms: Master bedroom with multiple walk-in closets
- Flooring: Carpet; Wood
- Bathrooms: 2 full bathrooms; 1 half bathroom
- Heating & cooling: Electric heating
- Interior features: Other rooms (see remarks); No fireplace; Unfurnished
Neighborhood map
What this means for you Summary
Snapshot
- This is a 3-bed/2.5-bath townhouse listed at $140k. Condition is rated fair.
Deal economics
- At list price, monthly cash flow is $218 ($3k/yr) — positive.
- The deal already cash-flows at list — no discount required.
- Meets the 1% rule at list price ($2k rent vs $140k).
- Cap rate 8.2% vs local median 4.9% in Mobile — top-decile yield for the area; either an underpriced asset or a hidden risk that comps aren't pricing in. Stress-test before assuming the spread holds.
Location & tenants
- Location reads 75/100 on livability (#20 in AL, #4,262 nationally) — a middle-class / working-renter tenant base. Strengths: commute A+, cost of living A+, housing A+; Watch: schools D-, crime F, employment D-.
- Mobile County (urban): math 15% / reading 39% proficiency, ranked #81 of 129 in AL (top 63%) — low school quality limits family demand, transient renter base, plan for 1-2y turnover; 67% free/reduced lunch — lower-income household profile, screen leases tightly.
- Market conditions: Rents rising fast (+6.2%/yr); 338 active listings in the ZIP; 15 comparable units currently listed for rent nearby; rentals at typical pace (median 21d on market — plan ~3-4 weeks tenant-placement turnaround); 1,678 units permitted in Mobile County in 2024 (264 in 5+ unit buildings).
- This rent runs 33% of the median local income ($61k/yr) — at the standard rent-burdened threshold; future hikes will face affordability resistance.
Forward outlook
- Local home prices are declining (-3.0%/yr); year-one equity from $967 of loan paydown is wiped out by about $4k of value loss. Plan a longer hold.
- Mobile County population projected to shrink 8% by 2050 — rents likely to lag national; underwrite the cash flow, not the appreciation.
- At projected returns (-3.0% appreciation + 6.2% rent growth), your $39k cash investment doubles in ~10 years — after that, you're playing with house money.
Negotiation context
- Only 8 days on market — expect competitive offers; lowballing is unlikely to land.
Risks & watch-outs
- Climate carrying-cost: severe wind risk, 99% chance of damaging wind over 30y; extreme-heat days projected 7→21/yr by 2055 (HVAC capex compounding) — expect insurance premiums to compound above CPI over the hold.
Questions for the listing agent
- Have any recent inspections been done? Can we get a copy of the seller's disclosures and any deferred-maintenance estimates?
- Built in 1974 — when were the roof, HVAC, electrical panel, plumbing, and water heater last replaced?
- What does the HOA fee cover, when was the last increase, and are there any pending special assessments or reserve-fund shortfalls?
- Is there a deadline driving the sale (1031 exchange, divorce, estate, relocation)? That informs how much negotiation room exists.
- Schools are D-rated, which usually means shorter tenancies and higher turnover. Who's the typical renter profile here, and what's been the actual vacancy rate?
- Crime grade is F in this area — have there been break-ins, vandalism, or insurance claims at this property in the last 3 years? What carrier currently insures it and at what premium?
- What's the average days-on-market for RENTAL listings here right now (not sales)? A rising rental-DOM trend means longer vacancies and softer asking-rent achievability than the comps imply.
- What's the recent tenant-quality profile in this submarket — average credit score on applications, eviction rate, late-payment / NSF rate, and stable-employment percentage? A property-management company in the area should have these aggregated.
- How much new for-sale + rental construction is in the pipeline within 1–3 miles? Heavy new supply typically softens prices + rents 12–24 months out; constrained supply supports both.
Investment metrics
- 1% rule
- 1.21% ✓
- Cap rate
- 8.17%
- Cash-on-cash
- 6.69%
- DSCR
- 1.30
- GRM
- 6.9
CMA / ARV
- ARV (on-the-fly)
- $217,008
- Comps found
- 6
Show comp detail 6 sales within ~0.75 mi
| Address | Dist | Beds/Ba | Sqft | Sold | Price | $/sf | Match |
|---|---|---|---|---|---|---|---|
| 6087 N Highland Cir | 0.19mi | 3/2.0 | 1,533 (-3%) | 24mo | $208,000 | $136 | 64 |
| 270 Hillcrest Rd #707 | 0.71mi | 3/2.5 | 1,500 (-5%) | 13mo | $205,000 | $137 | 47 |
| 181 General Bullard Ave | 0.54mi | 3/2.0 | 1,740 (+10%) | 13mo | $257,000 | $148 | 45 |
| 270 Hillcrest Rd #304 | 0.64mi | 3/2.5 | 1,364 (-14%) | 4mo | $165,000 | $121 | 44 |
| 270 Hillcrest Rd #405 | 0.64mi | 3/2.5 | 1,412 (-11%) | 12mo | $195,000 | $138 | 42 |
| 270 Hillcrest Rd #402 | 0.64mi | 3/2.5 | 1,386 (-12%) | 20mo | $187,500 | $135 | 33 |
Match score weights: distance 35% · size 25% · config 20% · recency 20%. Top-matched comps best support the ARV.
Projected returns pro-forma
-3.0% appreciation · 6.15% rent growth · sell at horizon
- IRR
- -2.0%
- Equity multiple
- 0.92×
- Total profit
- $-3,122
- Equity at exit
- $20,860
- IRR
- 11.2%
- Equity multiple
- 2.02×
- Total profit
- $39,853
- Equity at exit
- $12,096
Cash invested: $39,172 (down + closing). Projections, not guarantees.
Landlord ↔ Tenant lean methodology
- Overall (STATE)
- 90 Strongly Landlord-Friendly
- State Alabama
- 90 Strongly Landlord-Friendly · R+15
- County
- — inherits STATE
- City
- — inherits STATE
ZIP-level market 36608
- Rents YoY
- 6.2%
- Active inventory
- 338
- Price-to-rent
- 6.9×
Monthly cashflow live
- Estimated rent
- $1,690 high interval (Pro) →
- Mortgage (P&I)
- −$734
- Tax est. 1.5%
- −$175 /mo · $2,098/yr
- Insurance
- −$58
- HOA
- −$150
- Vacancy / Maint / Mgmt
- −$355
- Net cashflow
- $218
Break-even live
UW: 25.0% down · 7.5% · 30yr · 1.5% tax · 5.0% vac · 8.0% maint · 8.0% mgmt
Financing live
Cash to close
- Down payment
- $34,975
- Closing costs
- $4,197
- Reserves months
- —
- Total cash needed
- —
Loan-product check · same deal, 3 products live
Conventional
25% down · 7.5% · 30yr
- Down + closing
- —
- Monthly P&I
- —
- Monthly cashflow
- —
- DSCR
- —
- Eligible?
- —
Personal DTI + credit; lowest rate.
DSCR
20% down · 8.5% · 30yr
- Down + closing
- —
- Monthly P&I
- —
- Monthly cashflow
- —
- DSCR
- —
- Eligible?
- —
No personal income docs; deal must DSCR.
Hard money
10% down · 12.0% · 12mo
- Down + closing
- —
- Monthly P&I
- —
- Monthly cashflow
- —
- DSCR
- —
- Eligible?
- —
Short-term bridge; refi at stabilization.
Rent comps 15 comps
| Address | Beds | Baths | Sqft | Rent | $/sqft | DOM | Units | Dist |
|---|---|---|---|---|---|---|---|---|
| 6016 Magnolia Pl E Mobile, AL | 3.0 | 2.0 | 1600 | $1,800 | $1.12 | 43d | 1 | 0.41mi |
| 4670 Rosewood Dr Mobile, AL | 3.0 | 2.0 | 1192 | $1,200 | $1.01 | 13d | 1 | 0.60mi |
| 6427 Airport Blvd Mobile, AL | 2.0–3.0 | 2.0–2.5 | 1214 | $1,537 | $1.27 | 43d | 10 | 0.68mi |
| 112 S University Blvd Mobile, AL | 4.0 | 4.5 | 1472 | $1,810 | $1.23 | 13d | 5 | 0.74mi |
| 1056 Linlen Ave Mobile, AL | 3.0 | 3.0 | 1975 | $2,300 | $1.16 | 43d | 1 | 0.80mi |
| 6474B Cedar Bend Ct Mobile, AL | 2.0 | 2.0 | 1444 | $1,600 | $1.11 | 43d | 1 | 0.93mi |
| 6701 Dickens Ferry Rd #30 Mobile, AL | 3.0 | 2.5 | 1342 | $1,395 | $1.04 | 21d | 1 | 1.10mi |
| 6700 Wall St Mobile, AL | 2.0–3.0 | 1.0–2.0 | 1231 | $1,571 | $1.28 | 13d | 6 | 1.17mi |
| 101 Foreman Rd Mobile, AL | 1.0–3.0 | 1.0–2.0 | 835 | $1,279 | $1.53 | 43d | 9 | 1.18mi |
| 5900 Grelot Rd Mobile, AL | 2.0 | 2.0–2.5 | 1259 | $1,600 | $1.27 | 13d | 2 | 1.21mi |
| 304 N University Blvd Unit 1043721P Mobile, AL | 4.0 | 2.5 | 1496 | $4,148 | $2.77 | 21d | 1 | 1.22mi |
| 424 Byron Ave E Mobile, AL | 4.0 | 2.0 | 1917 | $2,500 | $1.30 | 21d | 1 | 1.26mi |
| 316 Syracuse St Mobile, AL | 3.0 | 2.0 | 1776 | $1,875 | $1.06 | 13d | 1 | 1.28mi |
| 6075 Grelot Rd Mobile, AL | 2.0 | 1.0 | 1050 | $1,215 | $1.16 | 13d | 1 | 1.28mi |
| 1601 Hillcrest Rd Mobile, AL | 2.0 | 2.0 | 1250 | $1,603 | $1.28 | 13d | 1 | 1.49mi |
HOA detail
- Monthly dues
- $150 · $1,800/yr
Listing history 7 events
-
2026-06-07status $139,900 Pending 8 DOM
-
2026-06-03days on market $139,900 Active 8 DOM
-
2026-06-02days on market $139,900 Active 7 DOM
-
2026-06-01days on market $139,900 Active 6 DOM
-
2026-05-31days on market $139,900 Active 5 DOM
-
2026-05-30days on market $139,900 Active 4 DOM
-
2026-05-26$139,900 Active
ⓘ Source: listings_history table (triggers on properties + properties_extension) + one-shot
backfill from property_details.listing_events for pre-trigger history.
Climate risk First Street
- Flood 1/10 Low FEMA zone X (unshaded) · 0% chance over 30 yrs
- Wildfire 1/10 Low
- Heat 9/10 Extreme 7 d/yr ≥105°F today · 21 d/yr by 30 yrs out
- Wind 9/10 Extreme 99% chance of damaging wind over 30 yrs
- Air quality 1/10 Low 0 unhealthy d/yr today · 0 by 30 yrs out
Nearby sold comps map
Loading sold comps map…
Walkable amenities ~0.75 mi
Loading nearby amenities…
Taxation est. · year 1
- Rental income
- $20,280
- − Mortgage interest
- −$7,837
- − Property taxes
- −$2,098
- − Insurance
- −$700
- − Repairs & maintenance
- −$1,622
- − Management
- −$1,622
- − HOA
- −$1,800
- − Depreciation
- −$4,070
- Taxable income
- $531
- Est. tax owed @ 24.0%
- −$127
- After-tax cash flow
- $2,492/yr
For passive investors: Depreciation is non-cash, so a rental often shows a tax loss while cash-flowing — sheltering income. Rental losses are passive: they offset passive income freely, and up to $25,000/yr can offset ordinary (W-2) income if you actively participate and your MAGI is under $100k (phasing out to $0 by $150k); unused losses carry forward. On sale, claimed depreciation is recaptured at up to 25%, and gains may owe capital-gains tax (a 1031 exchange can defer both). Figures are a year-1 estimate at your 24.0% rate — not tax advice; consult a CPA.
Condition & rehab AI · 26 photos
This townhouse requires moderate renovations to modernize the kitchen and bathrooms, paint interior walls, and replace carpeted stairs. It has a good roof and foundation, but some exterior paint and landscaping could be improved.
Repairs flagged
- Major Kitchen cabinets — Worn and outdated
- Major Bathroom cabinets — Worn and outdated
- Moderate Exterior paint — Some discoloration
Value-add opportunities
- Both Replace kitchen cabinets and countertops — Modernizes kitchen and increases value
- Both Replace bathroom cabinets and fixtures — Modernizes bathrooms and increases value
- Both Paint interior walls — Freshens up interior and increases value
- Both Replace carpeted stairs — Modernizes entryway and increases value
Renovation cost estimate screening
| Repair item | Severity | Est. cost |
|---|---|---|
| Kitchen cabinets · Worn and outdated | Major | $15,000–50,000 |
| Bathroom cabinets · Worn and outdated | Major | $15,000–50,000 |
| Exterior paint · Some discoloration | Moderate | $3,000–15,000 |
| Total estimated repair cost · 3 items | $33,000–115,000 |
Value-add ROI direction
- Both Replace kitchen cabinets and countertops — Modernizes kitchen and increases value ↑
- Both Replace bathroom cabinets and fixtures — Modernizes bathrooms and increases value ↑
- Both Paint interior walls — Freshens up interior and increases value ↑
- Both Replace carpeted stairs — Modernizes entryway and increases value ↑
ⓘ Cost ranges are severity-bucket heuristics (US national rule-of-thumb). Get contractor quotes + a written scope before underwriting a rehab budget.
Schools (NCES district)
- District
- Mobile County
- NCES district ID
- 0102370
- Math proficiency
- 15% ▼ -28.00%
- Reading proficiency
- 39% ▬ 0.00%
- Median HH income
- $42,455
- Composite
- 22.9/100
- National rank
- #8002
- State rank
- #81 of 129 in AL
Livability — Mobile
- Score
- 75/100
- State rank
- #20
- US rank
- #4262
Category grades
Schools grade is shown separately in the Schools card above.
Census & demographics
- Census place
- Mobile, AL
- County
- Mobile County · 246,577 people
- City population
- 205,729
- Metro
- Mobile, AL
- Population (ZIP)
- 38,890
- Household income
- $61,146
- Rent vs Own
- Severe rent burden
- 1823.0
Population outlook (Mobile County) Hauer SSP2
- Today (2025)
- 415,303 people
- By 2030
- 411,755 · -0.9%
- By 2040
- 399,670 · -3.8%
- By 2050
- 382,616 · -7.9%
- By 2075
- 337,353 · -18.8%
- By 2100
- 283,391 · -31.8%
Race, ethnicity, and origin ACS 2023
- Neighborhood character
- Diverse neighborhood (Simpson 0.56)
- Race & ethnicity
- White 56% Black 35% Two or more races 4% Hispanic / Latino 4% Asian 2%
- Common ancestry
- Lithuanian 3% Italian 2% Slovak 2%
- Foreign-born
- 4% · Canada
- Languages at home
- 95% English-only · Spanish 2% Arabic 1% Other Indo-European 1%
Political lean MEDSL · Mobile
- 2024 margin
- R (+16.4) · D 41.3% · R 57.7%
- 2008→2024 swing
- -7.7pp toward R · 2008: -8.7pp · 2024: -16.4pp
- All cycles
- 2024: R+16.4 2020: R+11.9 2016: R+13.9 2012: R+9.3 2008: R+8.7
Not yet ingested
- Civics
- —
Market trends
- HPI YoY
- ▼ -224.52%
- Current HPI
- 198.9469
- Rent YoY
- ▲ 6.15%
- Metro
- Mobile, AL
- State GDP YoY
- ▲ 2.94%
- F500 in state
- 4
Industry mix (Fortune 500 HQ in AL)
| Industry | F500 HQs | Revenue |
|---|---|---|
| Financial Services | 1 | $8B |
|
||
| Healthcare | 1 | $5B |
|
||
Price history
1 event — show timeline
- 2026-05-26 Listed $139,900 BCAR
Cash-flow waterfall
monthlySold comps — $/sqft
last 12 mo · ≤1 miLoading sold comps…