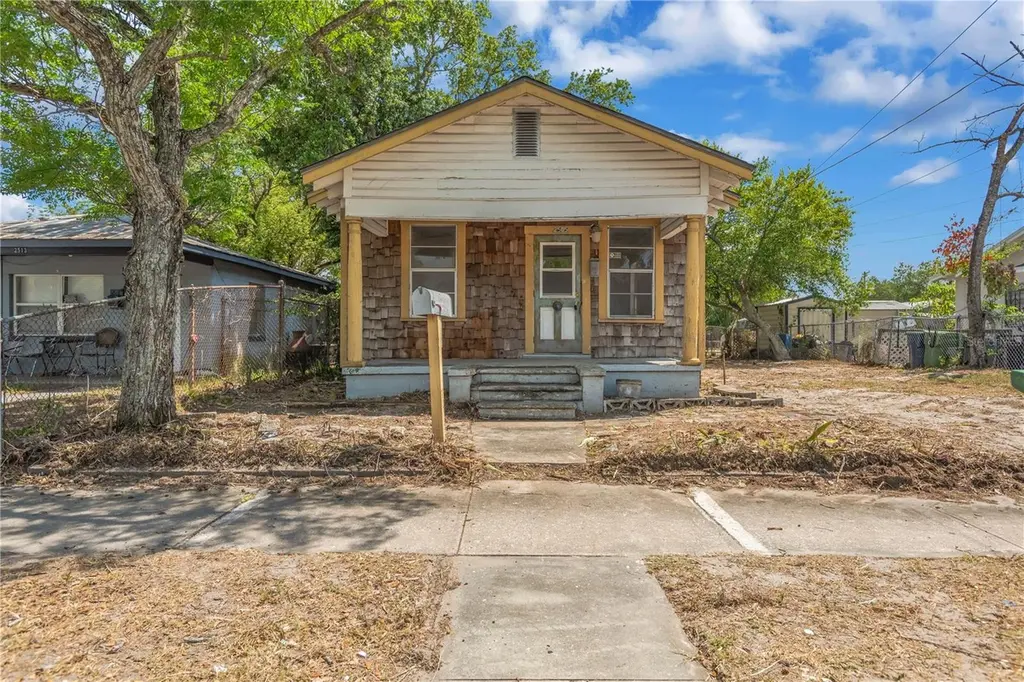
2505 E 17th Ave · Tampa, FL
Flood risk 1/10 · Minimal
- FEMA flood zone
- X (unshaded)
- Chance of flooding over 30 yrs
- 0.0%
- Est. flood insurance / yr
- $507 – $1,088
Fire risk 1/10 · Minimal
- Est. fire insurance / yr
- $947 – $1,759
Heat risk 10/10 · Severe
- Hot days now (above 108°F)
- 7 days/yr
- Hot days in 30 yrs
- 27 days/yr
Wind risk 9/10 · Severe
- Chance of severe wind over 30 yrs
- 99.0%
Air-quality risk 3/10 · Minor
- Unhealthy air days now
- 3 days/yr
- Unhealthy air days in 30 yrs
- 4 days/yr
Risk factors via First Street. Map © Google.
Why this score? — see what drove the C+ grade
The composite is a weighted blend of 9 inputs, each scored 0–100. Each bar is that input's sub-score; the figure is the points it added to the 100-point composite (weight × sub-score).
- Cash flow +21.4/30.0
- Appreciation +10.0/10.0
- ARV discount +7.5/15.0
- DSCR +6.8/10.0
- 1% rule +4.7/10.0
- Schools +4.2/10.0
- Livability +4.0/5.0
- Rent growth +2.6/5.0
- Condition / age +2.5/5.0
$159,900
🖨 Deal sheet 📄 Offer letter ✓ Due diligence
Listing remarks
HOTTEST DEAL IN TAMPA!! This Fixer Upper Home is being sold AS-IS to a CASH buyer. This is a great home for you to purchase and add some sweat equity, or an investor opportunity to flip or rent. This Tampa gem has great bones to provide the perfect canvas for you to flex your creativity. The listing price is the starting offer price. No replacements or repairs will be done by the seller. Please schedule a showing and Inspect the home before offer submission. Please conduct inspections prior to offer submission. Terms - Seller is looking for contracts with zero inspection and 10-day closing. Seller will select title company. Proof Of Funds must accompany the offer. If purchasing in a compan
Key facts
- 4,841 sq ft lot
- Built 1941
- Listed 44 days
Property features AI
Finance
- Other: Unfurnished; Zoned RM-24; No CDD; No homestead; No lease restrictions
Exterior
- Parking: Driveway
- Utilities: Public water; Public sewer; Public utilities
- Home design: Single family residence; 1 story; Faces north
- Construction: Frame construction; Shingle roof; Crawlspace foundation; Built on a lot approximately 47 x 103 (0.11 acre)
- Exterior features: Covered front porch; Chain link fence; Shed(s) on the property; Other exterior features
Interior
- Kitchen: Range
- Bedrooms: 2 bedrooms
- Flooring: Wood flooring
- Bathrooms: 1 full bathroom
- Heating & cooling: Other heating; Other cooling
- Interior features: Other interior features
- Laundry & utility: Laundry located outside
Neighborhood map
What this means for you Summary
Snapshot
- This is a 2-bed/1.0-bath single-family listed at $160k.
Deal economics
- At list price, monthly cash flow is $237 ($3k/yr) — positive.
- The deal already cash-flows at list — no discount required.
- To meet the 1% rule (rent ≥ 1% of price), the offer needs to be $155k (3.2% below list).
- Recommended offer: $155k (3.2% below list) — sets the bar for 1% rule.
Location & tenants
- Location reads 79/100 on livability (#142 in FL, #2,135 nationally) — a middle-class / working-renter tenant base. Strengths: commute A+, housing A+, health & safety A+; Watch: schools C-, crime D+.
- Hillsborough (suburban): math 47% / reading 50% proficiency, ranked #41 of 73 in FL (top 56%) — families likely to look elsewhere, expect single-tenant / working-renter base with shorter leases.
- Market conditions: Rents flat; 187 active listings in the ZIP; 40 comparable units currently listed for rent nearby; rentals at typical pace (median 21d on market — plan ~3-4 weeks tenant-placement turnaround); lower-income renter base — watch delinquency; 9,053 units permitted in Hillsborough County in 2024 (4,555 in 5+ unit buildings).
- At $1,548/mo this rent would consume 50% of the median local household income ($37k/yr) (locally 1374% of renters already pay >50% of income on rent) — very limited rent-growth headroom before tenants either downsize or default.
Forward outlook
- In year one you build about $17k of equity ($1k loan paydown + $16k appreciation (10.0% local appreciation)).
- Hillsborough County population projected at +37% by 2050 — long-run rental-demand tailwind backs the buy-and-hold thesis.
- At projected returns (10.0% appreciation + 0.6% rent growth), your $45k cash investment doubles in ~3 years — after that, you're playing with house money.
- By year 3, paydown + projected appreciation supports a ~$43k cash-out refi (75% LTV) — recoverable capital for the next deal without selling this one.
Negotiation context
- It's been on market 44 days — a 3% lower offer ($155k) is reasonable based on typical stale-listing flexibility.
- 2 sale attempts; this cycle's ask is 7% above the opening price — seller raised mid-cycle; expect resistance to lowballs.
Risks & watch-outs
- Watch-outs: built in 1941 — expect roof / HVAC / electrical / plumbing capex.
- Climate carrying-cost: severe wind risk, 99% chance of damaging wind over 30y; extreme-heat days projected 7→27/yr by 2055 (HVAC capex compounding) — expect insurance premiums to compound above CPI over the hold.
Questions for the listing agent
- It's been on market 44 days. Have you received any prior offers? Is the seller open to a 3% concession, seller financing, or rate buy-down credit?
- Built in 1941 — when were the roof, HVAC, electrical panel, plumbing, and water heater last replaced?
- Is there a deadline driving the sale (1031 exchange, divorce, estate, relocation)? That informs how much negotiation room exists.
- Crime grade is D in this area — have there been break-ins, vandalism, or insurance claims at this property in the last 3 years? What carrier currently insures it and at what premium?
- What's the average days-on-market for RENTAL listings here right now (not sales)? A rising rental-DOM trend means longer vacancies and softer asking-rent achievability than the comps imply.
- What's the recent tenant-quality profile in this submarket — average credit score on applications, eviction rate, late-payment / NSF rate, and stable-employment percentage? A property-management company in the area should have these aggregated.
- How much new for-sale + rental construction is in the pipeline within 1–3 miles? Heavy new supply typically softens prices + rents 12–24 months out; constrained supply supports both.
Investment metrics
- 1% rule
- 0.97% ✗
- Cap rate
- 8.07%
- Cash-on-cash
- 6.35%
- DSCR
- 1.28
- GRM
- 8.6
CMA / ARV
No comps found within radius.
Projected returns pro-forma
10.0% appreciation · 0.58% rent growth · sell at horizon
- IRR
- 28.0%
- Equity multiple
- 3.20×
- Total profit
- $98,446
- Equity at exit
- $144,051
- IRR
- 23.8%
- Equity multiple
- 7.06×
- Total profit
- $271,188
- Equity at exit
- $310,651
Cash invested: $44,772 (down + closing). Projections, not guarantees.
Landlord ↔ Tenant lean methodology
- Overall (STATE)
- 87 Strongly Landlord-Friendly
- State Florida
- 87 Strongly Landlord-Friendly · R+3
- County
- — inherits STATE
- City
- — inherits STATE
ZIP-level market 33605
- Home prices YoY
- 3.7%
- Rents YoY
- 0.6%
- Active inventory
- 187
- Price-to-rent
- 8.6×
Monthly cashflow live
- Estimated rent
- $1,548 high interval (Pro) →
- Mortgage (P&I)
- −$839
- Tax from tax record
- −$81 /mo · $968/yr
- Insurance
- −$67
- HOA
- −$0
- Vacancy / Maint / Mgmt
- −$325
- Net cashflow
- $237
Break-even live
UW: 25.0% down · 7.5% · 30yr · 1.5% tax · 5.0% vac · 8.0% maint · 8.0% mgmt
Financing live
Cash to close
- Down payment
- $39,975
- Closing costs
- $4,797
- Reserves months
- —
- Total cash needed
- —
Loan-product check · same deal, 3 products live
Conventional
25% down · 7.5% · 30yr
- Down + closing
- —
- Monthly P&I
- —
- Monthly cashflow
- —
- DSCR
- —
- Eligible?
- —
Personal DTI + credit; lowest rate.
DSCR
20% down · 8.5% · 30yr
- Down + closing
- —
- Monthly P&I
- —
- Monthly cashflow
- —
- DSCR
- —
- Eligible?
- —
No personal income docs; deal must DSCR.
Hard money
10% down · 12.0% · 12mo
- Down + closing
- —
- Monthly P&I
- —
- Monthly cashflow
- —
- DSCR
- —
- Eligible?
- —
Short-term bridge; refi at stabilization.
Rent comps 40 comps
| Address | Beds | Baths | Sqft | Rent | $/sqft | DOM | Units | Dist |
|---|---|---|---|---|---|---|---|---|
| 2704 E Columbus Dr Apt A Tampa, FL | 1.0 | 1.0 | 385 | $1,250 | $3.25 | 15d | 1 | 0.11mi |
| 2010 E Palm Ave #14221 Tampa, FL | 1.0 | 1.0 | 675 | $1,750 | $2.59 | 24d | 1 | 0.43mi |
| 1910 E Palm Ave Tampa, FL | 1.0 | 1.0 | 665 | $1,712 | $2.58 | 5d | 2 | 0.52mi |
| 1910 E Palm Ave Tampa, FL | 1.0 | 1.0 | 665 | $1,675 | $2.52 | 3d | 3 | 0.52mi |
| 2634 E 26th Ave Tampa, FL | 2.0 | 1.0 | 496 | $1,500 | $3.02 | 12d | 1 | 0.53mi |
| 2909 N 17th St Tampa, FL | 2.0 | 1.0 | 750 | $1,350 | $1.80 | 22d | 1 | 0.57mi |
| 2916 N 16th St Tampa, FL | 1.0 | 1.0 | 500 | $1,100 | $2.20 | 24d | 1 | 0.68mi |
| 3005 Sanchez St Apt 4 Tampa, FL | 1.0 | 1.0 | 550 | $900 | $1.64 | 3d | 1 | 0.73mi |
| 3005 Sanchez St Unit 3 Tampa, FL | 1.0 | 1.0 | 550 | $995 | $1.81 | 24d | 1 | 0.73mi |
| 3005 Sanchez St Unit 5 Tampa, FL | 2.0 | 1.0 | 750 | $1,050 | $1.40 | 3d | 1 | 0.73mi |
| 2409 E 2nd Ave Tampa, FL | 2.0 | 1.0–2.0 | 882 | $3,549 | $4.02 | 2d | 23 | 0.74mi |
| 3405 N 34th St Unit C Tampa, FL | 1.0 | 1.0 | 600 | $795 | $1.32 | 3d | 1 | 0.75mi |
| 1704 N 17th St Tampa, FL | 1.0 | 1.0 | 339 | $1,781 | $5.25 | 2d | 9 | 0.78mi |
| 1411 E 24th Ave Unit b Tampa, FL | 1.0 | 1.0 | 350 | $1,100 | $3.14 | 2d | 1 | 0.84mi |
| 1307 E 17th Ave Unit El Cafecito Loft Tampa, FL | 1.0 | 1.0 | 600 | $1,450 | $2.42 | 24d | 1 | 0.84mi |
| 1301 E Columbus Dr Unit 1 Tampa, FL | 1.0 | 1.0 | 750 | $1,995 | $2.66 | 24d | 1 | 0.88mi |
| 1302 E 21st Ave Tampa, FL | 1.0–2.0 | 1.0–2.0 | 800 | $1,408 | $1.76 | 5d | 9 | 0.93mi |
| 1211 E 18th Ave Unit 2 Tampa, FL | 2.0 | 1.0 | 725 | $1,800 | $2.48 | 18d | 1 | 0.93mi |
| 2402 E Doctor Martin Luther King Junior Blvd Unit 4 Tampa, FL | 1.0 | 1.0 | 610 | $800 | $1.31 | 10d | 1 | 1.02mi |
| 2402 E Doctor Martin Luther King Junior Blvd Tampa, FL | 2.0 | 1.0 | 710 | $1,699 | $2.39 | 24d | 1 | 1.02mi |
| 1003 E 15th Ave Tampa, FL | 1.0 | 1.0 | 750 | $1,275 | $1.70 | 24d | 1 | 1.08mi |
| 1720 Nick Nuccio Pkwy Tampa, FL | 3.0 | 1.0–3.0 | 955 | $3,170 | $3.32 | 24d | 40 | 1.10mi |
| 2610 Durham St Tampa, FL | 1.0 | 1.0 | 701 | $1,250 | $1.78 | 20d | 1 | 1.10mi |
| 2610 Durham St Apt B Tampa, FL | 1.0 | 1.0 | 701 | $1,250 | $1.78 | 24d | 1 | 1.10mi |
| 2403 Durham St Tampa, FL | 2.0 | 1.0 | 702 | $1,195 | $1.70 | 4d | 1 | 1.13mi |
| 2403 Durham St Unit 1 Tampa, FL | 1.0 | 1.0 | 702 | $1,195 | $1.70 | 14d | 1 | 1.13mi |
| 1620 Nuccio Pkwy Tampa, FL | 2.0 | 1.0–2.0 | 770 | $3,438 | $4.46 | 2d | 308 | 1.16mi |
| 1105 E 28th Ave Tampa, FL | 3.0 | 1.0 | 744 | $1,525 | $2.05 | 5d | 1 | 1.18mi |
| 3408 E Doctor Martin Luther King Junior Blvd Unit 5 Tampa, FL | 2.0 | 1.0 | 654 | $1,595 | $2.44 | 15d | 1 | 1.20mi |
| 3408 E Doctor Martin Luther King Junior Blvd Unit 8 Tampa, FL | 2.0 | 1.0 | 654 | $1,495 | $2.29 | 17d | 1 | 1.20mi |
| 3408 E Doctor Martin Luther King Junior Blvd Unit 8 Tampa, FL | 2.0 | 1.0 | 654 | $1,495 | $2.29 | 20d | 1 | 1.20mi |
| 3408 E Doctor Martin Luther King Junior Blvd Apt 3 Tampa, FL | 2.0 | 1.0 | 654 | $1,625 | $2.48 | 24d | 1 | 1.20mi |
| 3408 E Doctor Martin Luther King Junior Blvd Unit 4 Tampa, FL | 2.0 | 1.0 | 654 | $1,575 | $2.41 | 24d | 1 | 1.20mi |
| 1006 E 26th Ave Tampa, FL | 1.0 | 1.0 | 500 | $1,280 | $2.56 | 24d | 1 | 1.20mi |
| 2406 E Clark St Unit C Tampa, FL | 1.0 | 1.0 | 441 | $995 | $2.26 | 22d | 1 | 1.21mi |
| 2501 E Chelsea St Tampa, FL | 1.0 | 1.0 | 600 | $1,100 | $1.83 | 22d | 1 | 1.24mi |
| 2817 N Taliaferro Ave Unit 3 Tampa, FL | 1.0 | 1.0 | 650 | $1,275 | $1.96 | 18d | 1 | 1.31mi |
| 2817 N Taliaferro Ave Tampa, FL | 1.0 | 1.0 | 650 | $1,275 | $1.96 | 24d | 1 | 1.31mi |
| 1014 E 31st Ave Unit A Tampa, FL | 2.0 | 1.0 | 600 | $1,149 | $1.92 | 24d | 1 | 1.34mi |
| 1014 E 31st Ave Unit B Tampa, FL | 1.0 | 1.0 | 550 | $995 | $1.81 | 24d | 1 | 1.34mi |
Listing history 20 events
-
2026-06-19price $159,900 Active 44 DOM
-
2026-06-18days on market $179,900 Active 44 DOM
-
2026-06-17days on market $179,900 Active 43 DOM
-
2026-06-16days on market $179,900 Active 42 DOM
-
2026-06-15days on market $179,900 Active 41 DOM
-
2026-06-13days on market $179,900 Active 39 DOM
-
2026-06-13days on market $179,900 Active 38 DOM
-
2026-06-09days on market $179,900 Active 35 DOM
-
2026-06-08days on market $179,900 Active 34 DOM
-
2026-06-07days on market $179,900 Active 33 DOM
-
2026-06-04days on market $179,900 Active 30 DOM
-
2026-06-03days on market $179,900 Active 29 DOM
-
2026-06-02days on market $179,900 Active 28 DOM
-
2026-06-02price $179,900 Active 27 DOM
-
2026-06-01days on market $149,900 Active 27 DOM
-
2026-05-31days on market $149,900 Active 26 DOM
-
2026-05-05$149,900 Active 967-char remark
-
2025-09-10$80,000
-
2025-09-10historical
-
2025-09-10historical
ⓘ Source: listings_history table (triggers on properties + properties_extension) + one-shot
backfill from property_details.listing_events for pre-trigger history.
Tax reassessment forecast FL · Resets to sale price
- Current annual tax
- $968 · $81/mo
- Projected year-2 tax
- $1,327 · $111/mo
- Expected delta
- +$359/yr (+$30/mo · 37.1%)
ⓘ Screening estimate from a state-policy table — verify with the county assessor before closing.
Climate risk First Street
- Flood 1/10 Low FEMA zone X (unshaded) · 0% chance over 30 yrs
- Wildfire 1/10 Low
- Heat 10/10 Extreme 7 d/yr ≥108°F today · 27 d/yr by 30 yrs out
- Wind 9/10 Extreme 99% chance of damaging wind over 30 yrs
- Air quality 3/10 Moderate 3 unhealthy d/yr today · 4 by 30 yrs out
Nearby sold comps map
Loading sold comps map…
Walkable amenities ~0.75 mi
Loading nearby amenities…
Taxation est. · year 1
- Rental income
- $18,574
- − Mortgage interest
- −$8,957
- − Property taxes
- −$968
- − Insurance
- −$800
- − Repairs & maintenance
- −$1,486
- − Management
- −$1,486
- − Depreciation
- −$4,652
- Taxable income
- $226
- Est. tax owed @ 24.0%
- −$54
- After-tax cash flow
- $2,789/yr
For passive investors: Depreciation is non-cash, so a rental often shows a tax loss while cash-flowing — sheltering income. Rental losses are passive: they offset passive income freely, and up to $25,000/yr can offset ordinary (W-2) income if you actively participate and your MAGI is under $100k (phasing out to $0 by $150k); unused losses carry forward. On sale, claimed depreciation is recaptured at up to 25%, and gains may owe capital-gains tax (a 1031 exchange can defer both). Figures are a year-1 estimate at your 24.0% rate — not tax advice; consult a CPA.
Schools (NCES district)
- District
- Hillsborough
- NCES district ID
- 1200870
- Math proficiency
- 47% ▼ -8.00%
- Reading proficiency
- 50% ▼ -4.00%
- Median HH income
- $50,622
- Composite
- 41.6/100
- National rank
- #3435
- State rank
- #41 of 73 in FL
Livability — Tampa
- Score
- 79/100
- State rank
- #142
- US rank
- #2135
Category grades
Schools grade is shown separately in the Schools card above.
Census & demographics
- Census place
- Tampa, FL
- County
- Hillsborough County · 1,540,968 people
- City population
- 523,346
- Metro
- Tampa-St. Petersburg-Clearwater, FL
- Population (ZIP)
- 16,030
- Household income
- $36,975
- Rent vs Own
- Severe rent burden
- 1374.0
Population outlook (Hillsborough County) Hauer SSP2
- Today (2025)
- 1,607,022 people
- By 2030
- 1,733,968 · +7.9%
- By 2040
- 1,979,565 · +23.2%
- By 2050
- 2,203,427 · +37.1%
- By 2075
- 2,667,893 · +66.0%
- By 2100
- 2,891,558 · +79.9%
Race, ethnicity, and origin ACS 2023
- Neighborhood character
- Diverse neighborhood (Simpson 0.66)
- Race & ethnicity
- Black 48% Hispanic / Latino 28% Two or more races 18% White 17% Asian 1%
- Hispanic origin (detail)
- Mexican 6% Puerto Rican 8% Cuban 6% Dominican 1%
- Common ancestry
- Hispanic 2% Romanian 1% Lithuanian 1%
- Foreign-born
- 17% · Canada, Vietnam, Jamaica
- Languages at home
- 72% English-only · Spanish 24% French/Haitian/Cajun 3% Other Asian/Pacific 1%
Political lean MEDSL · Hillsborough
- 2024 margin
- Toss-up / Even · D 47.8% · R 50.9% · Other 1.3%
- 2008→2024 swing
- -10.2pp toward R · 2008: 7.1pp · 2024: -3.1pp
- All cycles
- 2024: R+3.1 2020: D+6.9 2016: D+6.8 2012: D+6.7 2008: D+7.1
Not yet ingested
- Civics
- —
Market trends
- HPI YoY
- ▲ 17.43%
- Current HPI
- 494.1871
- Rent YoY
- ▲ 0.58%
- Metro
- Tampa-St. Petersburg-Clearwater, FL
- State GDP YoY
- ▲ 3.28%
- F500 in state
- 36
Industry mix (Fortune 500 HQ in FL)
| Industry | F500 HQs | Revenue |
|---|---|---|
| Industrial Technology | 2 | $29B |
|
||
| Insurance | 2 | $17B |
|
||
| Retail | 1 | $60B |
|
||
| Technology Distribution | 1 | $58B |
|
||
| Homebuilding | 1 | $35B |
|
||
| Technology Manufacturing | 1 | $35B |
|
||
Price history
+124.9% since first listed5 events — show timeline
- 2026-06-01 Price Changed $179,900 Stellar MLS as Distributed by MLS Grid
- 2026-05-05 Listed $149,900 Stellar MLS as Distributed by MLS Grid
- 2025-09-10 Listing Removed — Stellar MLS as Distributed by MLS Grid
- 2025-09-10 Listing Removed — Stellar MLS as Distributed by MLS Grid
- 2025-09-10 Listed $80,000 Stellar MLS as Distributed by MLS Grid
Property tax history
+8.8%/yrLatest (2025): $968 · +11.5% YoY. Source: county tax records.
Cash-flow waterfall
monthlySold comps — $/sqft
last 12 mo · ≤1 miLoading sold comps…