 Triplex
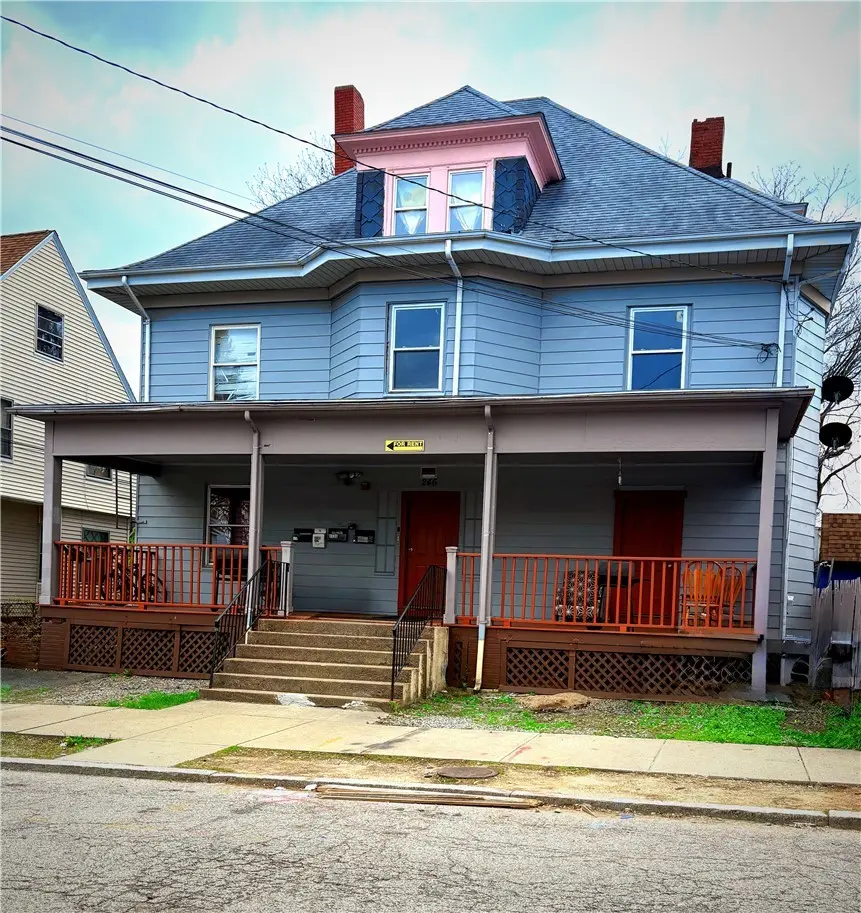
246 Sackett St · Providence, RI
Flood risk No data
- FEMA flood zone
- —
- Chance of flooding over 30 yrs
- —
- Est. flood insurance / yr
- —
Fire risk No data
- Est. fire insurance / yr
- —
Heat risk No data
- Hot days now (above threshold)
- —
- Hot days in 30 yrs
- —
Wind risk No data
- Chance of severe wind over 30 yrs
- —
Air-quality risk No data
- Unhealthy air days now
- —
- Unhealthy air days in 30 yrs
- —
Risk factors via First Street. Map © Google.
Why this score? — see what drove the B grade
The composite is a weighted blend of 9 inputs, each scored 0–100. Each bar is that input's sub-score; the figure is the points it added to the 100-point composite (weight × sub-score).
- Cash flow +30.0/30.0
- 1% rule +10.0/10.0
- DSCR +10.0/10.0
- ARV discount +7.5/15.0
- Rent growth +5.0/5.0
- Livability +4.2/5.0
- Condition / age +2.5/5.0
- Schools +1.0/10.0
- Appreciation +0.0/10.0
$439,000
🖨 Deal sheet 📄 Offer letter ✓ Due diligence
Multi-family units
County records classify this as Multi-Family (2-4 Unit). Listing-text estimate: 3 units. confirmed
Listing remarks
Investors Only Sold As-Is. A rare opportunity you don't want to miss. This large, solid home is priced well below its assessed value and sits in a great location. Currently generating strong rental income. This property can be converted into a 3-family home, unlocking significant long-term value. Soaring ceilings, good condition throughout, a large front porch, and a peaceful fenced backyard. Fire alarm system. Cash or private lender preferred due to current use. Property is being sold strictly as-is seller is very motivated and open to all offers. Don't miss this one.
Key facts
- Fire alarm system
- 3-family home
- Large front porch
Tags
Property features AI
Finance
- Other: Property appears offered as a multi-family investment (3 units across 3 buildings)
- Financial info: Operating expenses reported at $84,000; Unit rents reported: $5,700; $1,500; $1,500
- HOA & community: No HOA information provided
Exterior
- Parking: No garage; Space for 4 vehicles (total)
- Security: No security details provided
- Utilities: Public water; Public sewer; Electric service: 100 amps
- Home design: Multi-unit property with 3 buildings; Total of 3 residential units
- Construction: Vinyl siding
- Exterior features: Lot approximately 0.1148 acres; Lot area approximately 5,000 sq ft; Above-grade finished area listed (2,488)
Interior
- Kitchen: No specific kitchen appliance list provided
- Bedrooms: Three-bedroom units (two units); Two-bedroom unit (one unit)
- Flooring: Plywood; Vinyl
- Bathrooms: Five full bathrooms total across the property; Unit breakdown: one unit with 1 full bath, one unit with 2 full baths, one unit with 2 full baths
- Heating & cooling: Gas heating
- Interior features: Plywood and vinyl flooring; Electric water heater
- Laundry & utility: No laundry details provided
Neighborhood map
What this means for you Summary
Snapshot
- This is a 3 × 3-bed/1.7-bath units multifamily listed at $439k.
Deal economics
- At list price, monthly cash flow is $3k ($32k/yr) — positive. Per door: $891/mo.
- The deal already cash-flows at list — no discount required.
- Meets the 1% rule at list price ($7k rent vs $439k).
- Cap rate 13.6% vs local median 4.2% in Providence — top-decile yield for the area; either an underpriced asset or a hidden risk that comps aren't pricing in. Stress-test before assuming the spread holds.
Location & tenants
- Location reads 84/100 on livability (#2 in RI, #794 nationally) — a professional / high-income tenant draw. Strengths: amenities A+, commute A+, housing A+; Watch: employment C-, schools F.
- Providence (urban): math 8% / reading 16% proficiency, ranked #34 of 39 in RI (top 87%) — low school quality limits family demand, transient renter base, plan for 1-2y turnover; 79% free/reduced lunch — lower-income household profile, screen leases tightly.
- Market conditions: Rents rising fast (+15.3%/yr); 61 active listings in the ZIP; 776 units permitted in Providence County in 2024 (229 in 5+ unit buildings).
- At $6,987/mo this rent would consume 160% of the median local household income ($52k/yr) (locally 2189% of renters already pay >50% of income on rent) — very limited rent-growth headroom before tenants either downsize or default.
Forward outlook
- Local home prices are declining (-3.0%/yr); year-one equity from $3k of loan paydown is wiped out by about $13k of value loss. Plan a longer hold.
- Providence County population projected at +5% by 2050 — modest demand growth; plan on rents tracking national, not racing it.
- At projected returns (-3.0% appreciation + 8.0% rent growth), your $123k cash investment doubles in ~4 years — after that, you're playing with house money.
Negotiation context
- Only 4 days on market — expect competitive offers; lowballing is unlikely to land.
- 5 sale attempts since 8y ago with the ask held roughly flat each time — persistent listings suggest the price (not the market) is what's stuck; bring a comps-based counter.
- Current owner paid $130k; list at $439k implies a 238% gain — meaningful room to come down on a strong offer.
Risks & watch-outs
- Watch-outs: built in 1920 — expect roof / HVAC / electrical / plumbing capex.
Questions for the listing agent
- Can we see the unit-by-unit rent roll, current vacancy, and any below-market leases? What's the average tenancy length?
- What capital expenditures (roof, boiler, parking lot, exteriors) have been made in the last 5 years, and what's planned in the next 2?
- Built in 1920 — when were the roof, HVAC, electrical panel, plumbing, and water heater last replaced?
- Is there a deadline driving the sale (1031 exchange, divorce, estate, relocation)? That informs how much negotiation room exists.
- Schools are F-rated, which usually means shorter tenancies and higher turnover. Who's the typical renter profile here, and what's been the actual vacancy rate?
- What's the average days-on-market for RENTAL listings here right now (not sales)? A rising rental-DOM trend means longer vacancies and softer asking-rent achievability than the comps imply.
- What's the recent tenant-quality profile in this submarket — average credit score on applications, eviction rate, late-payment / NSF rate, and stable-employment percentage? A property-management company in the area should have these aggregated.
- How much new apartment / multifamily construction is in the pipeline within 1–3 miles? Heavy new supply (>2% of stock underway) typically softens rents 12–24 months out; light construction supports rent growth.
Investment metrics
- 1% rule
- 1.59% ✓
- Cap rate
- 13.60%
- Cash-on-cash
- 26.09%
- DSCR
- 2.16
- GRM
- 5.2
CMA / ARV
No comps found within radius.
Projected returns pro-forma
-3.0% appreciation · 8.0% rent growth · sell at horizon
- IRR
- 25.2%
- Equity multiple
- 2.11×
- Total profit
- $135,969
- Equity at exit
- $65,456
- IRR
- 35.8%
- Equity multiple
- 5.11×
- Total profit
- $505,570
- Equity at exit
- $37,957
Cash invested: $122,920 (down + closing). Projections, not guarantees.
Landlord ↔ Tenant lean methodology
- Overall (STATE)
- 31 Tenant-Leaning
- State Rhode Island
- 31 Tenant-Leaning · D+8
- County
- — inherits STATE
- City
- — inherits STATE
ZIP-level market 02907
- Home prices YoY
- -20.1%
- Rents YoY
- 15.3%
- Active inventory
- 61
- Price-to-rent
- 15.7×
Monthly cashflow live
- Estimated rent
- $6,987 high interval (Pro) →
- Mortgage (P&I)
- −$2,302
- Tax from tax record
- −$362 /mo · $4,350/yr
- Insurance
- −$183
- HOA
- −$0
- Vacancy / Maint / Mgmt
- −$1,467
- Net cashflow
- $2,672
Break-even live
3-unit breakdown (identical units grouped — click to expand)
| Units | Beds | Baths | Est. rent |
|---|---|---|---|
| 3× units | 3 | 1.7 | $6,987 |
| #1 | 3 | 1.7 | $2,329 |
| #2 | 3 | 1.7 | $2,329 |
| #3 | 3 | 1.7 | $2,329 |
| Total (3 units) | $6,987 | ||
UW: 25.0% down · 7.5% · 30yr · 1.5% tax · 5.0% vac · 8.0% maint · 8.0% mgmt
Financing live
Cash to close
- Down payment
- $109,750
- Closing costs
- $13,170
- Reserves months
- —
- Total cash needed
- —
Loan-product check · same deal, 3 products live
Conventional
25% down · 7.5% · 30yr
- Down + closing
- —
- Monthly P&I
- —
- Monthly cashflow
- —
- DSCR
- —
- Eligible?
- —
Personal DTI + credit; lowest rate.
DSCR
20% down · 8.5% · 30yr
- Down + closing
- —
- Monthly P&I
- —
- Monthly cashflow
- —
- DSCR
- —
- Eligible?
- —
No personal income docs; deal must DSCR.
Hard money
10% down · 12.0% · 12mo
- Down + closing
- —
- Monthly P&I
- —
- Monthly cashflow
- —
- DSCR
- —
- Eligible?
- —
Short-term bridge; refi at stabilization.
Listing history 18 events
-
2026-05-08status Pending
-
2026-05-06historical Active Under Contract
-
2026-05-03$439,000 Active
-
2025-12-19status Pending
-
2025-12-19historical
-
2025-12-17status Active
-
2025-12-11status Pending
-
2025-09-24price $479,000
-
2025-08-04$495,000 Active
-
2021-12-09historical
-
2021-09-17price $345,500
-
2021-09-10price $359,900
-
2021-08-05$369,900 Active
-
2018-04-27status Pending
-
2018-04-27soldstatus $130,000 Sold
-
2018-04-26soldstatus $130,000
-
2018-03-08historical Under Contract: Soliciting Back-up Offers
-
2018-02-22$149,900 Active
ⓘ Source: listings_history table (triggers on properties + properties_extension) + one-shot
backfill from property_details.listing_events for pre-trigger history.
Tax reassessment forecast RI · Partial reset (capped growth)
- Current annual tax
- $4,350 · $362/mo
- Projected year-2 tax
- $5,753 · $479/mo
- Expected delta
- +$1,403/yr (+$117/mo · 32.2%)
ⓘ Screening estimate from a state-policy table — verify with the county assessor before closing.
Nearby sold comps map
Loading sold comps map…
Walkable amenities ~0.75 mi
Loading nearby amenities…
Taxation est. · year 1
- Rental income
- $83,844
- − Mortgage interest
- −$24,591
- − Property taxes
- −$4,350
- − Insurance
- −$2,195
- − Repairs & maintenance
- −$6,708
- − Management
- −$6,708
- − Depreciation
- −$12,771
- Taxable income
- $26,522
- Est. tax owed @ 24.0%
- −$6,365
- After-tax cash flow
- $25,700/yr
For passive investors: Depreciation is non-cash, so a rental often shows a tax loss while cash-flowing — sheltering income. Rental losses are passive: they offset passive income freely, and up to $25,000/yr can offset ordinary (W-2) income if you actively participate and your MAGI is under $100k (phasing out to $0 by $150k); unused losses carry forward. On sale, claimed depreciation is recaptured at up to 25%, and gains may owe capital-gains tax (a 1031 exchange can defer both). Figures are a year-1 estimate at your 24.0% rate — not tax advice; consult a CPA.
Schools (NCES district)
- District
- Providence
- NCES district ID
- 4400900
- Math proficiency
- 8% ▼ -4.00%
- Reading proficiency
- 16% ▼ -2.00%
- Median HH income
- $38,197
- Composite
- 10.12/100
- National rank
- #9803
- State rank
- #34 of 39 in RI
Livability — Providence
- Score
- 84/100
- State rank
- #2
- US rank
- #794
Category grades
Schools grade is shown separately in the Schools card above.
Census & demographics
- Census place
- Providence, RI
- County
- Providence County · 548,917 people
- City population
- 212,734
- Metro
- Providence-Warwick, RI-MA
- Population (ZIP)
- 31,461
- Household income
- $52,485
- Rent vs Own
- Severe rent burden
- 2189.0
Population outlook (Providence County) Hauer SSP2
- Today (2025)
- 653,469 people
- By 2030
- 660,819 · +1.1%
- By 2040
- 672,747 · +3.0%
- By 2050
- 683,741 · +4.6%
- By 2075
- 720,435 · +10.2%
- By 2100
- 741,582 · +13.5%
Race, ethnicity, and origin ACS 2023
- Neighborhood character
- Predominantly Hispanic (70%)
- Race & ethnicity
- Hispanic / Latino 70% Two or more races 26% Black 10% White 10% Asian 5% Native American 2%
- Hispanic origin (detail)
- Puerto Rican 7% Dominican 50%
- Common ancestry
- Swiss 1% Lithuanian 1% Hispanic 1%
- Foreign-born
- 55% · Canada, Jamaica, Philippines
- Languages at home
- 25% English-only · Spanish 67% Other Asian/Pacific 3% French/Haitian/Cajun 1%
Political lean MEDSL · Providence
- 2024 margin
- D (+14.4) · D 56.1% · R 41.7% · Other 2.2%
- 2008→2024 swing
- -20.0pp toward R · 2008: 34.4pp · 2024: 14.4pp
- All cycles
- 2024: D+14.4 2020: D+22.9 2016: D+21.2 2012: D+34.9 2008: D+34.4
Not yet ingested
- Civics
- —
Market trends
- HPI YoY
- ▼ -125.19%
- Current HPI
- 498.142
- Rent YoY
- ▲ 15.32%
- Metro
- Providence-Warwick, RI-MA
- State GDP YoY
- ▲ 2.25%
- F500 in state
- 10
Industry mix (Fortune 500 HQ in RI)
| Industry | F500 HQs | Revenue |
|---|---|---|
| Healthcare | 1 | $373B |
|
||
| Food Distribution | 1 | $31B |
|
||
| Aerospace / Defense | 1 | $14B |
|
||
| Financial Services | 1 | $8B |
|
||
| Consumer Goods | 1 | $4B |
|
||
Price history
+192.9% since first listed18 events — show timeline
- 2026-05-08 Pending — RIS
- 2026-05-06 Contingent — RIS
- 2026-05-03 Listed $439,000 RIS
- 2025-12-19 Pending — RIS
- 2025-12-19 Listing Removed — RIS
- 2025-12-17 Relisted — RIS
- 2025-12-11 Pending — RIS
- 2025-09-24 Price Changed $479,000 RIS
- 2025-08-04 Listed $495,000 RIS
- 2021-12-09 Listing Removed — RIS
- 2021-09-17 Price Changed $345,500 RIS
- 2021-09-10 Price Changed $359,900 RIS
- 2021-08-05 Listed $369,900 RIS
- 2018-04-27 Pending — RIS
- 2018-04-27 Sold (MLS) $130,000 RIS
- 2018-04-26 Sold (Public Records) $130,000 Public Records
- 2018-03-08 Contingent — RIS
- 2018-02-22 Listed $149,900 RIS
Property tax history
-0.2%/yrLatest (2025): $4,350 · -27.0% YoY. Source: county tax records.
Cash-flow waterfall
monthlySold comps — $/sqft
last 12 mo · ≤1 miLoading sold comps…