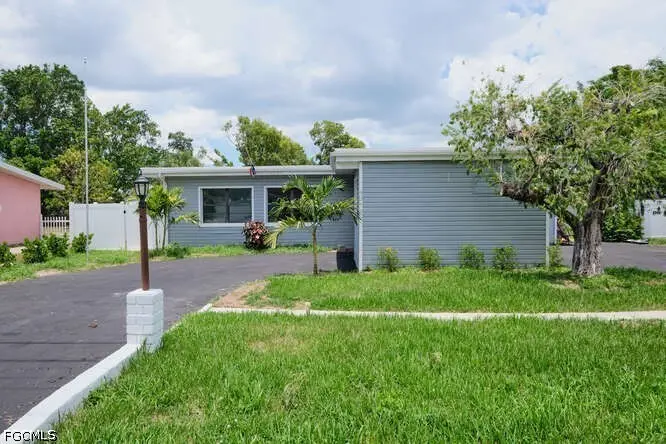
4370 Deleon St · Fort Myers, FL
Flood risk 5/10 · Moderate
- FEMA flood zone
- X (unshaded)
- Chance of flooding over 30 yrs
- 0.23%
- Est. flood insurance / yr
- $507 – $1,088
Fire risk 1/10 · Minimal
- Est. fire insurance / yr
- $947 – $1,759
Heat risk 10/10 · Severe
- Hot days now (above 107°F)
- 7 days/yr
- Hot days in 30 yrs
- 31 days/yr
Wind risk 10/10 · Severe
- Chance of severe wind over 30 yrs
- 99.0%
Air-quality risk 2/10 · Minimal
- Unhealthy air days now
- 1 days/yr
- Unhealthy air days in 30 yrs
- 1 days/yr
Risk factors via First Street. Map © Google.
Why this score? — see what drove the C- grade
The composite is a weighted blend of 9 inputs, each scored 0–100. Each bar is that input's sub-score; the figure is the points it added to the 100-point composite (weight × sub-score).
- ARV discount +15.0/15.0
- Cash flow +13.4/30.0
- 1% rule +5.5/10.0
- Livability +4.3/5.0
- Schools +4.1/10.0
- DSCR +4.0/10.0
- Condition / age +2.5/5.0
- Rent growth +1.7/5.0
- Appreciation +0.0/10.0
$199,000
🖨 Deal sheet (PDF) 📄 Offer letter ✓ Due diligence
Listing remarks
Welcome to this fully remodeled 3-bedroom, 2-bath pool home in the heart of Fort Myers, Florida! Boasting 1,642 sq ft of comfortable living space, this home combines modern updates with Florida lifestyle perks, making it perfect for families, first-time buyers, or investors. Step inside to discover a bright, open-concept living area that flows seamlessly into the updated kitchen, featuring ample cabinetry, stylish countertops, and plenty of room for cooking and entertaining. The split-bedroom layout ensures privacy for the primary suite, which includes a spacious closet and private bath, while two additional bedrooms provide flexibility for guests, office space, or hobbies. Enjoy the Florid
Key facts
- 9,374 sq ft lot
- Pool
- Built 1961
Property features AI
Finance
- Other: Private in-ground concrete pool
- Financial info: Pets allowed
- HOA & community: No association fee; Association includes cable TV
Exterior
- Security: Smoke detectors
- Utilities: Cable available; Public water; Public sewer; Municipal irrigation
- Home design: Single-story; Resale property; Faces east
- Construction: Block, concrete, stucco and wood frame construction; Built-up and flat roof
- Exterior features: Fence; Balcony; Screened porch/patio; Rectangular lot; West exposure
Interior
- Kitchen: Built-in oven; Electric cooktop; Microwave
- Flooring: Laminate flooring; Vinyl flooring
- Bathrooms: 2 full bathrooms
- Heating & cooling: Central heating (electric); Central air conditioning; Ceiling fans
- Interior features: Breakfast bar; Pantry; See remarks; Jalousie, single-hung and sliding windows; Unfurnished
- Laundry & utility: Inside laundry
Neighborhood map
What this means for you Summary
Snapshot
- This is a 3-bed/2.0-bath single-family listed at $199k.
Deal economics
- At list price, monthly cash flow is $5 ($60/yr) — positive.
- The deal already cash-flows at list — no discount required.
- Meets the 1% rule at list price ($2k rent vs $199k).
- Recommended offer: $196k (1.5% below list) — sets the bar for market timing.
- Cap rate 6.3% vs local median 3.3% in Fort Myers — top-decile yield for the area; either an underpriced asset or a hidden risk that comps aren't pricing in. Stress-test before assuming the spread holds.
Location & tenants
- Location reads 86/100 on livability (#14 in FL, #383 nationally) — a professional / high-income tenant draw. Strengths: amenities A+, commute A+, housing A+.
- Lee (suburban): math 47% / reading 50% proficiency, ranked #42 of 73 in FL (top 58%) — families likely to look elsewhere, expect single-tenant / working-renter base with shorter leases.
- Zoned schools: Heights Elementary School (math 74% / reading 67%, grade A-, #333 of 2,144 statewide, top 16%, 1,109 students, 38% FRL); Lexington Middle School (math 55% / reading 54%, grade B-, #183 of 571 statewide, top 34%, 1,138 students, 44% FRL); South Fort Myers High School (math 23% / reading 30%, grade F, #489 of 667 statewide, top 74%, 1,917 students, 50% FRL).
- Market conditions: Rents falling (-3.2%/yr); 287 active listings in the ZIP; 38 comparable units currently listed for rent nearby; rentals at typical pace (median 26d on market — plan ~3-4 weeks tenant-placement turnaround); 15,411 units permitted in Lee County in 2024 (4,686 in 5+ unit buildings).
- At $2,086/mo this rent would consume 48% of the median local household income ($52k/yr) (locally 1782% of renters already pay >50% of income on rent) — very limited rent-growth headroom before tenants either downsize or default.
Forward outlook
- Local home prices are declining (-3.0%/yr); year-one equity from $1k of loan paydown is wiped out by about $6k of value loss. Plan a longer hold.
- Lee County population projected at +44% by 2050 — long-run rental-demand tailwind backs the buy-and-hold thesis.
Negotiation context
- It's been on market 20 days — a 2% lower offer ($196k) is reasonable based on typical stale-listing flexibility.
- 13 sale attempts since 12y ago; this cycle's ask has dropped $99k (33%) from the opening price — seller is motivated, your offer sets the floor, not the list.
Risks & watch-outs
- Watch-outs: property tax is 3.1% of price.
- Climate carrying-cost: moderate flood risk; severe wind risk, 99% chance of damaging wind over 30y; extreme-heat days projected 7→31/yr by 2055 (HVAC capex compounding) — expect insurance premiums to compound above CPI over the hold.
Questions for the listing agent
- Built in 1961 — when were the roof, HVAC, electrical panel, plumbing, and water heater last replaced?
- Property tax is high relative to price — has the assessment been appealed recently, and will the sale trigger a re-assessment?
- Is there a deadline driving the sale (1031 exchange, divorce, estate, relocation)? That informs how much negotiation room exists.
- What's the average days-on-market for RENTAL listings here right now (not sales)? A rising rental-DOM trend means longer vacancies and softer asking-rent achievability than the comps imply.
- What's the recent tenant-quality profile in this submarket — average credit score on applications, eviction rate, late-payment / NSF rate, and stable-employment percentage? A property-management company in the area should have these aggregated.
- How much new for-sale + rental construction is in the pipeline within 1–3 miles? Heavy new supply typically softens prices + rents 12–24 months out; constrained supply supports both.
Investment metrics
- 1% rule
- 1.05% ✓
- Cap rate
- 6.32%
- Cash-on-cash
- 0.11%
- DSCR
- 1.00
- GRM
- 7.9
CMA / ARV
- ARV (on-the-fly)
- $364,524
- Comps found
- 6
Show comp detail 6 sales within ~0.75 mi
| Address | Dist | Beds/Ba | Sqft | Sold | Price | $/sf | Match |
|---|---|---|---|---|---|---|---|
| 1631 North Dr | 0.24mi | 3/2.0 | 1,580 (-4%) | 0mo | $265,000 | $168 | 82 |
| 1926 Collier Ave | 0.70mi | 3/2.0 | 1,688 (+3%) | 9mo | $313,250 | $186 | 55 |
| 1757 Jefferson Ave S | 0.63mi | 3/2.0 | 1,670 (+2%) | 18mo | $387,000 | $232 | 52 |
| 1653 Jamestown Ct | 0.45mi | 4/2.0 (+1) | 1,439 (-12%) | 12mo | $244,000 | $170 | 43 |
| 1457 Byron Rd | 0.62mi | 3/2.0 | 1,404 (-14%) | 8mo | $315,000 | $224 | 40 |
| 1567 Jefferson Ave | 0.70mi | 4/3.0 (+1) | 1,860 (+13%) | 21mo | $412,050 | $222 | 19 |
Match score weights: distance 35% · size 25% · config 20% · recency 20%. Top-matched comps best support the ARV.
Projected returns pro-forma
-3.0% appreciation · 0.0% rent growth · sell at horizon
- IRR
- -20.1%
- Equity multiple
- 0.32×
- Total profit
- $-37,847
- Equity at exit
- $29,672
- IRR
- -23.8%
- Equity multiple
- 0.01×
- Total profit
- $-55,379
- Equity at exit
- $17,206
Cash invested: $55,720 (down + closing). Projections, not guarantees.
Landlord ↔ Tenant lean methodology
- Overall (STATE)
- 87 Strongly Landlord-Friendly
- State Florida
- 87 Strongly Landlord-Friendly · R+3
- County
- — inherits STATE
- City
- — inherits STATE
ZIP-level market 33901
- Home prices YoY
- -25.9%
- Rents YoY
- -3.2%
- Active inventory
- 287
- Price-to-rent
- 7.9×
Monthly cashflow live
- Estimated rent
- $2,086 high interval (Pro) →
- Mortgage (P&I)
- −$1,044
- Tax from tax record
- −$517 /mo · $6,200/yr
- Insurance
- −$83
- HOA
- −$0
- Vacancy / Maint / Mgmt
- −$438
- Net cashflow
- $5
Break-even live
Sensitivity live
| Price | -10% $118 | -5% $61 | +0% $5 | +5% $-51 | +10% $-108 |
|---|---|---|---|---|---|
| Rent | -10% $-160 | -5% $-77 | +0% $5 | +5% $87 | +10% $170 |
| Rate | -1.0pp $105 | -0.5pp $56 | base $5 | +0.5pp $-47 | +1.0pp $-99 |
UW: 25.0% down · 7.5% · 30yr · 1.5% tax · 5.0% vac · 8.0% maint · 8.0% mgmt
Financing live
Cash to close
- Down payment
- $49,750
- Closing costs
- $5,970
- Reserves months
- —
- Total cash needed
- —
Loan-product check · same deal, 3 products live
Conventional
25% down · 7.5% · 30yr
- Down + closing
- —
- Monthly P&I
- —
- Monthly cashflow
- —
- DSCR
- —
- Eligible?
- —
Personal DTI + credit; lowest rate.
DSCR
20% down · 8.5% · 30yr
- Down + closing
- —
- Monthly P&I
- —
- Monthly cashflow
- —
- DSCR
- —
- Eligible?
- —
No personal income docs; deal must DSCR.
Hard money
10% down · 12.0% · 12mo
- Down + closing
- —
- Monthly P&I
- —
- Monthly cashflow
- —
- DSCR
- —
- Eligible?
- —
Short-term bridge; refi at stabilization.
Rent comps 38 comps
| Address | Beds | Baths | Sqft | Rent | $/sqft | DOM | Units | Dist |
|---|---|---|---|---|---|---|---|---|
| 4330 Deleon St Fort Myers, FL | 4.0 | 2.0 | 1660 | $2,850 | $1.72 | 25d | 1 | 0.09mi |
| 4346 Tufts Ave Fort Myers, FL | 3.0 | 2.0 | 1420 | $1,695 | $1.19 | 4d | 1 | 0.17mi |
| 4637 Deleon St Fort Myers, FL | 3.0 | 1.0–2.0 | 815 | $1,657 | $2.03 | 4d | 37 | 0.24mi |
| 4381 Lazio Way #501 Fort Myers, FL | 3.0 | 2.5 | 1936 | $1,800 | $0.93 | 25d | 1 | 0.51mi |
| 4361 Lazio Way #901 Fort Myers, FL | 3.0 | 2.5 | 1936 | $1,800 | $0.93 | 16d | 1 | 0.52mi |
| 4361 Lazio Way Fort Myers, FL | 3.0 | 2.5 | 1936 | $1,800 | $0.93 | 25d | 1 | 0.52mi |
| 4390 Lazio Way #405 Fort Myers, FL | 3.0 | 2.5 | 1957 | $3,450 | $1.76 | 5d | 1 | 0.53mi |
| 4380 Lazio Way #606 Fort Myers, FL | 3.0 | 2.5 | 1926 | $1,950 | $1.01 | 25d | 1 | 0.53mi |
| 4380 Lazio Way #603 Fort Myers, FL | 3.0 | 2.5 | 1989 | $1,750 | $0.88 | 25d | 1 | 0.53mi |
| 3835 Arlington St Fort Myers, FL | 2.0 | 1.0 | 1062 | $1,850 | $1.74 | 25d | 1 | 0.67mi |
| 1406 Park Shore Cir #3 Fort Myers, FL | 3.0 | 2.5 | 1648 | $2,000 | $1.21 | 25d | 1 | 0.71mi |
| 3736 Luzon St Fort Myers, FL | 3.0 | 2.0 | 1372 | $1,801 | $1.31 | 5d | 1 | 0.71mi |
| 2244 Winkler Ave #207 Fort Myers, FL | 2.0 | 2.0 | 1187 | $1,400 | $1.18 | 25d | 1 | 0.73mi |
| 2264 Winkler Ave Fort Myers, FL | 2.0 | 2.0 | 1160 | $1,270 | $1.09 | 25d | 2 | 0.76mi |
| 2264 Winkler Ave #202 Fort Myers, FL | 2.0 | 2.0 | 1160 | $1,450 | $1.25 | 5d | 1 | 0.77mi |
| 4135 Residence Dr #618 Fort Myers, FL | 3.0 | 2.0 | 1121 | $1,700 | $1.52 | 25d | 1 | 0.78mi |
| 2366 E Mall Dr #406 Fort Myers, FL | 2.0 | 2.0 | 1092 | $1,500 | $1.37 | 25d | 1 | 0.80mi |
| 4109 Residence Dr Fort Myers, FL | 2.0–3.0 | 2.0 | 1062 | $1,950 | $1.84 | 16d | 3 | 0.82mi |
| 4109 Residence Dr Fort Myers, FL | 2.0–3.0 | 2.0 | 1062 | $1,950 | $1.84 | 5d | 2 | 0.82mi |
| 4113 Residence Dr #211 Fort Myers, FL | 2.0 | 2.0 | 1080 | $1,400 | $1.30 | 16d | 1 | 0.84mi |
| 3891 Solomon Blvd Fort Myers, FL | 1.0–3.0 | 1.0–2.0 | 856 | $1,819 | $2.12 | 3d | 23 | 0.88mi |
| 1403 Davis Dr Fort Myers, FL | 3.0 | 3.0 | 1658 | $2,750 | $1.66 | 25d | 1 | 0.96mi |
| 1601 Red Cedar Dr Fort Myers, FL | 1.0–3.0 | 1.0–2.0 | 1000 | $1,594 | $1.59 | 3d | 36 | 0.97mi |
| 5212 Cedarbend Dr #1 Fort Myers, FL | 2.0 | 2.0 | 1236 | $1,600 | $1.29 | 25d | 1 | 1.05mi |
| 1442 Olmeda Way Fort Myers, FL | 2.0 | 2.0 | 1311 | $2,400 | $1.83 | 5d | 1 | 1.12mi |
| 5233 Cedarbend Dr #1 Fort Myers, FL | 2.0 | 2.0 | 1236 | $1,800 | $1.46 | 25d | 1 | 1.13mi |
| 5245 Cedarbend Dr #2 Fort Myers, FL | 2.0 | 2.0 | 1236 | $1,545 | $1.25 | 25d | 1 | 1.14mi |
| 5249 Cedarbend Dr #1 Fort Myers, FL | 2.0 | 2.0 | 1300 | $1,550 | $1.19 | 5d | 1 | 1.14mi |
| 5236 Cedarbend Dr #3 Fort Myers, FL | 2.0 | 2.0 | 1236 | $1,600 | $1.29 | 25d | 1 | 1.15mi |
| 33 Broadway Cir Fort Myers, FL | 3.0 | 2.0 | 1122 | $1,800 | $1.60 | 17d | 1 | 1.21mi |
| 6346 Saint Andrews Cir S Fort Myers, FL | 3.0 | 2.0 | 1174 | $2,400 | $2.04 | 5d | 1 | 1.23mi |
| 3585 Central Ave Fort Myers, FL | 1.0–2.0 | 1.0–2.0 | 1000 | $1,450 | $1.45 | 25d | 1 | 1.25mi |
| 6313 Saint Andrews Cir S Fort Myers, FL | 3.0 | 2.0 | 1418 | $2,350 | $1.66 | 4d | 1 | 1.26mi |
| 1659 Ricardo Ave Fort Myers, FL | 3.0 | 2.0 | 1985 | $2,300 | $1.16 | 25d | 1 | 1.27mi |
| 1463 Tanglewood Pkwy Fort Myers, FL | 3.0 | 2.0 | 1754 | $3,100 | $1.77 | 25d | 1 | 1.38mi |
| 1448 Covington Cir W Fort Myers, FL | 3.0 | 2.0 | 1350 | $3,500 | $2.59 | 25d | 1 | 1.38mi |
| 2103 Unity Ave Fort Myers, FL | 4.0 | 2.0 | 1456 | $1,900 | $1.30 | 25d | 1 | 1.39mi |
| 5335 Hawks Landing Dr Unit 202 Fort Myers, FL | 3.0 | 2.0 | 1154 | $1,555 | $1.35 | 25d | 1 | 1.49mi |
Listing history 50 events
-
2026-04-15status Pending
-
2026-04-07price $199,000
-
2026-03-26$297,999 Active
-
2026-03-25historical
-
2026-03-19price $298,770
-
2026-03-01price $299,770
-
2026-02-16price $282,000
-
2026-02-13price $283,000
-
2026-02-11price $283,499
-
2026-02-09price $283,999
-
2026-02-02price $284,999
-
2026-01-29price $287,000
-
2026-01-25price $289,500
-
2026-01-23status Active
-
2026-01-23status Active
-
2026-01-23historical
-
2026-01-22price $299,000
-
2026-01-22historical
-
2025-12-16price $295,000
-
2025-12-03price $300,000
-
2025-11-12price $317,999
-
2025-10-21price $324,999
-
2025-09-26price $339,900
-
2025-08-14$299,999 Active
-
2025-06-07price $349,900
-
2025-05-08$399,900 Active
-
2024-10-05$449,900 Active
-
2023-09-15historical
-
2023-09-04price $350,000
-
2023-08-29price $400,000
-
2023-08-12price $409,000
-
2023-08-02status Active
-
2023-08-02price $400,000
-
2023-07-27historical
-
2023-07-23price $435,000
-
2023-07-21price $447,500
-
2023-07-14price $450,000
-
2023-07-10price $479,000
-
2023-07-03$499,000 Active
-
2023-02-23soldstatus $293,000
-
2023-02-22soldstatus $280,000 Closed
-
2023-01-12status Pending
-
2023-01-12price $325,000
-
2023-01-11status Active
-
2023-01-11historical
-
2022-12-02$350,000 Active
-
2017-11-08soldstatus $161,000
-
2017-10-19soldstatus $161,000 Sold
-
2017-09-02status Pending With Contingencies
-
2017-08-14$162,900 Active
ⓘ Source: listings_history table (triggers on properties + properties_extension) + one-shot
backfill from property_details.listing_events for pre-trigger history.
Tax reassessment forecast FL · Resets to sale price
- Current annual tax
- $6,200 · $517/mo
- Projected year-2 tax
- $6,200 · $517/mo
- Expected delta
- $0/yr ($0/mo · 0.0%)
ⓘ Screening estimate from a state-policy table — verify with the county assessor before closing.
Climate risk First Street
- Flood 5/10 Major FEMA zone X (unshaded) · 23% chance over 30 yrs
- Wildfire 1/10 Low
- Heat 10/10 Extreme 7 d/yr ≥107°F today · 31 d/yr by 30 yrs out
- Wind 10/10 Extreme 99% chance of damaging wind over 30 yrs
- Air quality 2/10 Low 1 unhealthy d/yr today · 1 by 30 yrs out
Nearby sold comps map
Loading sold comps map…
Walkable amenities ~0.75 mi
Loading nearby amenities…
Taxation est. · year 1
- Rental income
- $25,035
- − Mortgage interest
- −$11,147
- − Property taxes
- −$6,200
- − Insurance
- −$995
- − Repairs & maintenance
- −$2,003
- − Management
- −$2,003
- − Depreciation
- −$5,789
- Taxable loss
- −$3,102
- Est. tax savings @ 24.0%
- +$744
- After-tax cash flow
- $804/yr
For passive investors: Depreciation is non-cash, so a rental often shows a tax loss while cash-flowing — sheltering income. Rental losses are passive: they offset passive income freely, and up to $25,000/yr can offset ordinary (W-2) income if you actively participate and your MAGI is under $100k (phasing out to $0 by $150k); unused losses carry forward. On sale, claimed depreciation is recaptured at up to 25%, and gains may owe capital-gains tax (a 1031 exchange can defer both). Figures are a year-1 estimate at your 24.0% rate — not tax advice; consult a CPA.
Schools (NCES district)
- District
- Lee
- NCES district ID
- 1201080
- Math proficiency
- 47% ▼ -11.00%
- Reading proficiency
- 50% ▼ -4.00%
- Median HH income
- $49,518
- Composite
- 41.49/100
- National rank
- #3458
- State rank
- #42 of 73 in FL
Livability — Fort Myers
- Score
- 86/100
- State rank
- #14
- US rank
- #383
Category grades
Schools grade is shown separately in the Schools card above.
Census & demographics
- Census place
- Fort Myers, FL
- County
- Lee County · 788,662 people
- City population
- 278,598
- Metro
- Cape Coral-Fort Myers, FL
- Population (ZIP)
- 24,481
- Household income
- $51,816
- Rent vs Own
- Severe rent burden
- 1782.0
Population outlook (Lee County) Hauer SSP2
- Today (2025)
- 871,946 people
- By 2030
- 955,468 · +9.6%
- By 2040
- 1,113,587 · +27.7%
- By 2050
- 1,256,891 · +44.1%
- By 2075
- 1,560,270 · +78.9%
- By 2100
- 1,726,848 · +98.0%
Race, ethnicity, and origin ACS 2023
- Neighborhood character
- Diverse neighborhood (Simpson 0.65)
- Race & ethnicity
- White 50% Hispanic / Latino 23% Black 22% Two or more races 15% Asian 1%
- Hispanic origin (detail)
- Mexican 6% Puerto Rican 4% Cuban 4%
- Common ancestry
- Hispanic 7% Estonian 2% Lithuanian 2%
- Foreign-born
- 22% · Canada, Jamaica
- Languages at home
- 68% English-only · Spanish 18% French/Haitian/Cajun 8% Other Indo-European 4%
Political lean MEDSL · Lee
- 2024 margin
- Strong R (+28.4) · D 35.5% · R 63.9%
- 2008→2024 swing
- -18.0pp toward R · 2008: -10.4pp · 2024: -28.4pp
- All cycles
- 2024: R+28.4 2020: R+19.2 2016: R+20.4 2012: R+16.6 2008: R+10.4
Not yet ingested
- Civics
- —
Market trends
- HPI YoY
- ▼ -108.70%
- Current HPI
- 311.8283
- Rent YoY
- ▼ -3.23%
- Metro
- Cape Coral-Fort Myers, FL
- State GDP YoY
- ▲ 3.28%
- F500 in state
- 36
Industry mix (Fortune 500 HQ in FL)
| Industry | F500 HQs | Revenue |
|---|---|---|
| Industrial Technology | 2 | $29B |
|
||
| Insurance | 2 | $17B |
|
||
| Retail | 1 | $60B |
|
||
| Technology Distribution | 1 | $58B |
|
||
| Homebuilding | 1 | $35B |
|
||
| Technology Manufacturing | 1 | $35B |
|
||
Price history
+780.5% since first listed58 events — show timeline
- 2026-04-15 Pending — FORTMLS
- 2026-04-07 Price Changed $199,000 FORTMLS
- 2026-03-26 Listed $297,999 FORTMLS
- 2026-03-25 Listing Removed — FORTMLS
- 2026-03-19 Price Changed $298,770 FORTMLS
- 2026-03-01 Price Changed $299,770 FORTMLS
- 2026-02-16 Price Changed $282,000 FORTMLS
- 2026-02-13 Price Changed $283,000 FORTMLS
- 2026-02-11 Price Changed $283,499 FORTMLS
- 2026-02-09 Price Changed $283,999 FORTMLS
- 2026-02-02 Price Changed $284,999 FORTMLS
- 2026-01-29 Price Changed $287,000 FORTMLS
- 2026-01-25 Price Changed $289,500 FORTMLS
- 2026-01-23 Relisted — FORTMLS
- 2026-01-23 Relisted — FORTMLS
- 2026-01-23 Listing Removed — FORTMLS
- 2026-01-22 Price Changed $299,000 FORTMLS
- 2026-01-22 Listing Removed — FORTMLS
- 2025-12-16 Price Changed $295,000 FORTMLS
- 2025-12-03 Price Changed $300,000 FORTMLS
- 2025-11-12 Price Changed $317,999 FORTMLS
- 2025-10-21 Price Changed $324,999 FORTMLS
- 2025-09-26 Price Changed $339,900 FORTMLS
- 2025-08-14 Listed $299,999 FORTMLS
- 2025-06-07 Price Changed $349,900 BEARMLS
- 2025-05-08 Listed $399,900 BEARMLS
- 2024-10-05 Listed $449,900 BEARMLS
- 2023-09-15 Listing Removed — FORTMLS
- 2023-09-04 Price Changed $350,000 FORTMLS
- 2023-08-29 Price Changed $400,000 FORTMLS
- 2023-08-12 Price Changed $409,000 FORTMLS
- 2023-08-02 Relisted — FORTMLS
- 2023-08-02 Price Changed $400,000 FORTMLS
- 2023-07-27 Listing Removed — FORTMLS
- 2023-07-23 Price Changed $435,000 FORTMLS
- 2023-07-21 Price Changed $447,500 FORTMLS
- 2023-07-14 Price Changed $450,000 FORTMLS
- 2023-07-10 Price Changed $479,000 FORTMLS
- 2023-07-03 Listed $499,000 FORTMLS
- 2023-02-23 Sold (Public Records) $293,000 Public Records
- 2023-02-22 Sold (MLS) $280,000 FORTMLS
- 2023-01-12 Pending — FORTMLS
- 2023-01-12 Price Changed $325,000 FORTMLS
- 2023-01-11 Relisted — FORTMLS
- 2023-01-11 Listing Removed — FORTMLS
- 2022-12-02 Listed $350,000 FORTMLS
- 2017-11-08 Sold (Public Records) $161,000 Public Records
- 2017-10-19 Sold (MLS) $161,000 FORTMLS
- 2017-09-02 Pending — FORTMLS
- 2017-08-14 Listed $162,900 FORTMLS
- 2017-08-11 Listing Removed — FORTMLS
- 2017-05-16 Listed $169,900 FORTMLS
- 2014-09-09 Sold (Public Records) $135,500 Public Records
- 2014-05-24 Listed $135,000 FORTMLS
- 2003-09-22 Sold (Public Records) $140,000 Public Records
- 2003-08-27 Sold (MLS) $140,000 FORTMLS
- 2003-07-11 Price Changed $144,900 FORTMLS
- 1972-11-01 Sold (Public Records) $22,600 Public Records
Property tax history
+18.4%/yrLatest (2025): $6,200 · +3.6% YoY. Source: county tax records.
Cash-flow waterfall
monthlySold comps — $/sqft
last 12 mo · ≤1 miLoading sold comps…