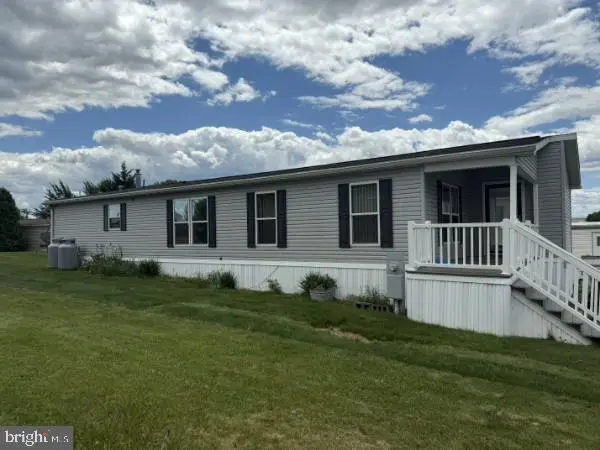
124 Lisa Cir · Lower Windsor, PA
Flood risk 1/10 · Minimal
- FEMA flood zone
- X (unshaded)
- Chance of flooding over 30 yrs
- 0.0%
- Est. flood insurance / yr
- $507 – $1,088
Fire risk 2/10 · Minimal
- Est. fire insurance / yr
- $511 – $949
Heat risk 5/10 · Moderate
- Hot days now (above 100°F)
- 7 days/yr
- Hot days in 30 yrs
- 15 days/yr
Wind risk 4/10 · Minor
- Chance of severe wind over 30 yrs
- 16.0%
Air-quality risk 3/10 · Minor
- Unhealthy air days now
- 3 days/yr
- Unhealthy air days in 30 yrs
- 4 days/yr
Risk factors via First Street. Map © Google.
Why this score? — see what drove the B- grade
The composite is a weighted blend of 9 inputs, each scored 0–100. Each bar is that input's sub-score; the figure is the points it added to the 100-point composite (weight × sub-score).
- Cash flow +30.0/30.0
- DSCR +10.0/10.0
- 1% rule +9.0/10.0
- ARV discount +7.5/15.0
- Schools +4.5/10.0
- Rent growth +2.5/5.0
- Livability +2.5/5.0
- Condition / age +2.5/5.0
- Appreciation +0.0/10.0
$134,900
🖨 Deal sheet (PDF) 📄 Offer letter ✓ Due diligence
Listing remarks MLS
SELLER SAYS SELL!! Newer double-wide offers open floor plan, ample square footage- 2FB and 3BRS or 2 BRS and office- CAC, gas heat, vaulted ceiling, utility room and laundry area, spacious kitchen w lots of cabinets! Wow!! Nice porch and 2 car parking pad.
Key facts
- 2 parking spots
- Built 2009
- Listed 23 days
Property features AI
Finance
- HOA & community: Senior community with 55+ age requirement; Ground rent $555 per month
Exterior
- Parking: Off-street parking with 2 spaces (total 2 garage/parking spaces)
- Utilities: Public water; Public sewer; Electric cooling and hot water
- Home design: Manufactured home (double wide); Made by Pine Grove; Ownership: Ground rent (monthly payment)
- Construction: Vinyl siding; Above-grade and below-grade structures
- Exterior features: Porch(es); Not in a federal flood zone; Tidal water: No
Interior
- Bedrooms: Three bedrooms on the main level
- Bathrooms: Two full bathrooms on the main level
- Heating & cooling: Forced air heating; Propane (leased) heating fuel; Central air conditioning; Electric hot water
- Interior features: No basement; Living area reported by assessor
Neighborhood map
What this means for you Summary
Snapshot
- This is a 3-bed/2.0-bath manufactured listed at $135k.
Deal economics
- At list price, monthly cash flow is $560 ($7k/yr) — positive.
- The deal already cash-flows at list — no discount required.
- Meets the 1% rule at list price ($2k rent vs $135k).
- Recommended offer: $133k (1.5% below list) — sets the bar for market timing.
Location & tenants
- Location reads: area grade B — affects rentability + tenant quality, not the cash-flow math above.
- Eastern York SD (rural): math 40% / reading 64% proficiency, ranked #146 of 539 in PA (top 27%) — acceptable for families but not a draw, mixed tenant base, ~2y average lease.
- Zoned schools: Canadochly El Sch (math 37% / reading 57%, grade D-, #737 of 1,518 statewide, top 52%, 381 students, 56% FRL); Eastern York Ms (math 30% / reading 70%, grade C, #129 of 512 statewide, top 26%, 517 students, 48% FRL); Eastern York Hs (math 77% / reading 24%, grade D+, #125 of 437 statewide, top 30%, 632 students, 46% FRL) — zoned schools average 50% FRL vs 32% district-wide (17 pts higher); higher-poverty schools than district average — tighter screening recommended.
- Market conditions: 174 active listings in the ZIP; solid renter incomes; 1,328 units permitted in York County in 2024 (338 in 5+ unit buildings).
Forward outlook
- Local home prices are declining (-3.0%/yr); year-one equity from $933 of loan paydown is wiped out by about $4k of value loss. Plan a longer hold.
- At projected returns (-3.0% appreciation + 3.0% rent growth), your $38k cash investment doubles in ~7 years — after that, you're playing with house money.
Negotiation context
- It's been on market 23 days — a 2% lower offer ($133k) is reasonable based on typical stale-listing flexibility.
- 2 sale attempts since 13y ago; this cycle's ask is 114% above the opening price — seller raised mid-cycle; expect resistance to lowballs.
- Current owner paid $64k; list at $135k implies a 112% gain — meaningful room to come down on a strong offer.
Risks & watch-outs
- Climate carrying-cost: extreme-heat days projected 7→15/yr by 2055 (HVAC capex compounding) — expect insurance premiums to compound above CPI over the hold.
Questions for the listing agent
- Is there a deadline driving the sale (1031 exchange, divorce, estate, relocation)? That informs how much negotiation room exists.
- What's the average days-on-market for RENTAL listings here right now (not sales)? A rising rental-DOM trend means longer vacancies and softer asking-rent achievability than the comps imply.
- What's the recent tenant-quality profile in this submarket — average credit score on applications, eviction rate, late-payment / NSF rate, and stable-employment percentage? A property-management company in the area should have these aggregated.
- How much new for-sale + rental construction is in the pipeline within 1–3 miles? Heavy new supply typically softens prices + rents 12–24 months out; constrained supply supports both.
Investment metrics
- 1% rule
- 1.40% ✓
- Cap rate
- 11.27%
- Cash-on-cash
- 17.78%
- DSCR
- 1.79
- GRM
- 6.0
CMA / ARV
No comps found within radius.
Projected returns pro-forma
-3.0% appreciation · 3.0% rent growth · sell at horizon
- IRR
- 9.3%
- Equity multiple
- 1.37×
- Total profit
- $13,816
- Equity at exit
- $20,114
- IRR
- 18.5%
- Equity multiple
- 2.54×
- Total profit
- $58,038
- Equity at exit
- $11,664
Cash invested: $37,772 (down + closing). Projections, not guarantees.
Landlord ↔ Tenant lean methodology
- Overall (STATE)
- 62 Landlord-Friendly
- State Pennsylvania
- 62 Landlord-Friendly · EVEN
- County
- — inherits STATE
- City
- — inherits STATE
ZIP-level market 17406
- Home prices YoY
- -27.4%
- Active inventory
- 174
- Price-to-rent
- 6.0×
Monthly cashflow live
- Estimated rent
- $1,883 medium interval (Pro) →
- Mortgage (P&I)
- −$707
- Tax from tax record
- −$164 /mo · $1,966/yr
- Insurance
- −$56
- HOA
- −$0
- Vacancy / Maint / Mgmt
- −$395
- Net cashflow
- $560
Break-even live
Sensitivity live
| Price | -10% $636 | -5% $598 | +0% $560 | +5% $522 | +10% $483 |
|---|---|---|---|---|---|
| Rent | -10% $411 | -5% $485 | +0% $560 | +5% $634 | +10% $708 |
| Rate | -1.0pp $628 | -0.5pp $594 | base $560 | +0.5pp $525 | +1.0pp $489 |
UW: 25.0% down · 7.5% · 30yr · 1.5% tax · 5.0% vac · 8.0% maint · 8.0% mgmt
Financing live
Cash to close
- Down payment
- $33,725
- Closing costs
- $4,047
- Reserves months
- —
- Total cash needed
- —
Loan-product check · same deal, 3 products live
Conventional
25% down · 7.5% · 30yr
- Down + closing
- —
- Monthly P&I
- —
- Monthly cashflow
- —
- DSCR
- —
- Eligible?
- —
Personal DTI + credit; lowest rate.
DSCR
20% down · 8.5% · 30yr
- Down + closing
- —
- Monthly P&I
- —
- Monthly cashflow
- —
- DSCR
- —
- Eligible?
- —
No personal income docs; deal must DSCR.
Hard money
10% down · 12.0% · 12mo
- Down + closing
- —
- Monthly P&I
- —
- Monthly cashflow
- —
- DSCR
- —
- Eligible?
- —
Short-term bridge; refi at stabilization.
Listing history 17 events
-
2026-06-21days on market $134,900 Coming Soon 23 DOM
-
2026-06-18days on market $134,900 Coming Soon 20 DOM
-
2026-06-17days on market $134,900 Coming Soon 19 DOM
-
2026-06-16days on market $134,900 Coming Soon 18 DOM
-
2026-06-15days on market $134,900 Coming Soon 17 DOM
-
2026-06-14days on market $134,900 Coming Soon 15 DOM
-
2026-06-13days on market $134,900 Coming Soon 14 DOM
-
2026-06-10days on market $134,900 Coming Soon 12 DOM
-
2026-06-09days on market $134,900 Coming Soon 11 DOM
-
2026-06-08days on market $134,900 Coming Soon 10 DOM
-
2026-06-07days on market $134,900 Coming Soon 9 DOM
-
2026-06-03days on market $134,900 Coming Soon 5 DOM
-
2026-06-02days on market $134,900 Coming Soon 4 DOM
-
2026-06-01days on market $134,900 Coming Soon 3 DOM
-
2026-05-31days on market $134,900 Coming Soon 2 DOM
-
2026-05-30remarks 693-char remark
-
2026-05-30$134,900 Coming Soon 1 DOM
ⓘ Source: listings_history table (triggers on properties + properties_extension) + one-shot
backfill from property_details.listing_events for pre-trigger history.
Tax reassessment forecast PA · Partial reset (capped growth)
- Current annual tax
- $1,966 · $164/mo
- Projected year-2 tax
- $2,049 · $171/mo
- Expected delta
- +$83/yr (+$7/mo · 4.2%)
ⓘ Screening estimate from a state-policy table — verify with the county assessor before closing.
Climate risk First Street
- Flood 1/10 Low FEMA zone X (unshaded) · 0% chance over 30 yrs
- Wildfire 2/10 Low
- Heat 5/10 Major 7 d/yr ≥100°F today · 15 d/yr by 30 yrs out
- Wind 4/10 Moderate 16% chance of damaging wind over 30 yrs
- Air quality 3/10 Moderate 3 unhealthy d/yr today · 4 by 30 yrs out
Nearby sold comps map
Loading sold comps map…
Walkable amenities ~0.75 mi
Loading nearby amenities…
Taxation est. · year 1
- Rental income
- $22,591
- − Mortgage interest
- −$7,556
- − Property taxes
- −$1,966
- − Insurance
- −$674
- − Repairs & maintenance
- −$1,807
- − Management
- −$1,807
- − Depreciation
- −$3,924
- Taxable income
- $4,855
- Est. tax owed @ 24.0%
- −$1,165
- After-tax cash flow
- $5,552/yr
For passive investors: Depreciation is non-cash, so a rental often shows a tax loss while cash-flowing — sheltering income. Rental losses are passive: they offset passive income freely, and up to $25,000/yr can offset ordinary (W-2) income if you actively participate and your MAGI is under $100k (phasing out to $0 by $150k); unused losses carry forward. On sale, claimed depreciation is recaptured at up to 25%, and gains may owe capital-gains tax (a 1031 exchange can defer both). Figures are a year-1 estimate at your 24.0% rate — not tax advice; consult a CPA.
Schools (NCES district)
- District
- Eastern York SD
- NCES district ID
- 4208790
- Math proficiency
- 40% ▼ -18.00%
- Reading proficiency
- 64% ▼ -11.00%
- Median HH income
- $56,178
- Composite
- 44.94/100
- National rank
- #2712
- State rank
- #146 of 539 in PA
Livability — Lower Windsor
No livability data for this city. (Only ~50 U.S. cities are tracked.)
Census & demographics
- County
- York County · 278,806 people
- Metro
- York-Hanover, PA
- Population (ZIP)
- 23,636
- Household income
- $83,521
- Rent vs Own
- Severe rent burden
- 296.0
Population outlook (York County) Hauer SSP2
- Today (2025)
- 454,205 people
- By 2030
- 457,407 · +0.7%
- By 2040
- 457,529 · +0.7%
- By 2050
- 448,261 · -1.3%
- By 2075
- 427,388 · -5.9%
- By 2100
- 384,218 · -15.4%
Race, ethnicity, and origin ACS 2023
- Neighborhood character
- Predominantly White (84%)
- Race & ethnicity
- White 84% Two or more races 6% Black 5% Hispanic / Latino 4%
- Common ancestry
- Romanian 3% Lithuanian 2% Slovak 2%
- Foreign-born
- 3% · Canada
- Languages at home
- 95% English-only · Spanish 2% Russian/Polish/Slavic 1% Arabic 1%
Political lean MEDSL · York
- 2024 margin
- Strong R (+25.3) · D 36.9% · R 62.1%
- 2008→2024 swing
- -11.7pp toward R · 2008: -13.6pp · 2024: -25.3pp
- All cycles
- 2024: R+25.3 2020: R+24.6 2016: R+29.3 2012: R+21.2 2008: R+13.6
Not yet ingested
- Civics
- —
Market trends
- HPI YoY
- ▼ -92.81%
- Current HPI
- 245.4821
- Rent YoY
- —
- Metro
- York-Hanover, PA
- State GDP YoY
- ▲ 1.68%
- F500 in state
- 34
Industry mix (Fortune 500 HQ in PA)
| Industry | F500 HQs | Revenue |
|---|---|---|
| Healthcare | 2 | $309B |
|
||
| Insurance | 2 | $27B |
|
||
| Telecommunications / Media | 1 | $124B |
|
||
| Industrial Distribution | 1 | $22B |
|
||
| Financial Services | 1 | $20B |
|
||
| Chemicals / Materials | 1 | $18B |
|
||
Price history
+86.1% since first listed6 events — show timeline
- 2026-05-29 Coming Soon $134,900 BRIGHT MLS
- 2015-11-20 Sold (MLS) $63,500 BRIGHT MLS
- 2015-10-31 Listing Removed — BRIGHT MLS
- 2015-10-09 Listing Removed — BRIGHT MLS
- 2015-07-30 Listed $63,000 BRIGHT MLS
- 2013-10-08 Listed $72,500 BRIGHT MLS
Property tax history
+3.1%/yrLatest (2025): $1,966 · +5.2% YoY. Source: county tax records.
Cash-flow waterfall
monthlySold comps — $/sqft
last 12 mo · ≤1 miLoading sold comps…