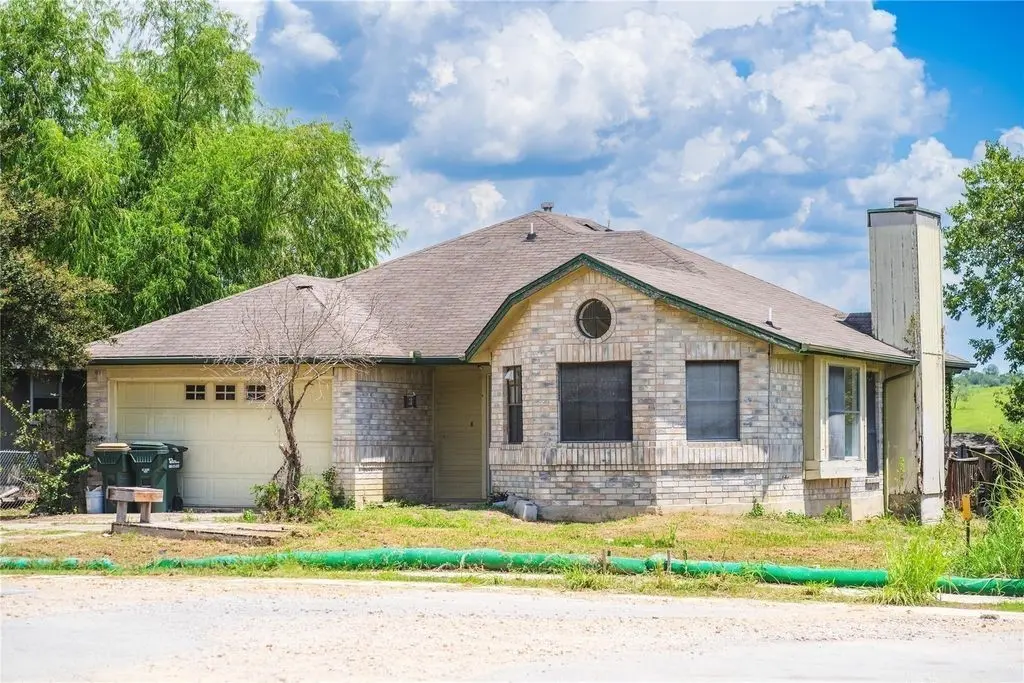
1169 Lago Vista St · San Marcos, TX
Flood risk 3/10 · Minor
- FEMA flood zone
- X (unshaded)
- Chance of flooding over 30 yrs
- 0.2%
- Est. flood insurance / yr
- $507 – $1,088
Fire risk 5/10 · Moderate
- Est. fire insurance / yr
- $1,222 – $2,270
Heat risk 8/10 · Major
- Hot days now (above 108°F)
- 7 days/yr
- Hot days in 30 yrs
- 22 days/yr
Wind risk 8/10 · Major
- Chance of severe wind over 30 yrs
- 80.0%
Air-quality risk 1/10 · Minimal
- Unhealthy air days now
- 0 days/yr
- Unhealthy air days in 30 yrs
- 0 days/yr
Risk factors via First Street. Map © Google.
Why this score? — see what drove the C- grade
The composite is a weighted blend of 9 inputs, each scored 0–100. Each bar is that input's sub-score; the figure is the points it added to the 100-point composite (weight × sub-score).
- Cash flow +16.1/30.0
- ARV discount +15.0/15.0
- 1% rule +5.0/10.0
- DSCR +5.0/10.0
- Livability +4.0/5.0
- Rent growth +3.0/5.0
- Condition / age +2.5/5.0
- Schools +2.0/10.0
- Appreciation +0.0/10.0
$189,000
🖨 Deal sheet 📄 Offer letter ✓ Due diligence
Listing remarks MLS
Discover the perfect blend of comfort and convenience in this home located in the desirable Lago Vista neighborhood. This residence have 4 bedrooms and 2 bathrooms. Enjoy a bright living area with high ceilings and large windows that flood the space with natural light. Experience the best of San Marcos living with easy access to outdoor activities and scenic views. Don’t miss the opportunity to make this wonderful property your new home!
Key facts
- Large windows
- Bright living area
- Natural light
Tags
Neighborhood map
What this means for you Summary
Snapshot
- This is a 4-bed/2.0-bath single-family listed at $189k.
Deal economics
- At list price, monthly cash flow is $96 ($1k/yr) — positive.
- The deal already cash-flows at list — no discount required.
- To meet the 1% rule (rent ≥ 1% of price), the offer needs to be $189k (0.1% below list).
- Recommended offer: $166k (12.0% below list) — sets the bar for market timing.
- Cap rate 6.9% vs local median 3.1% in San Marcos — top-decile yield for the area; either an underpriced asset or a hidden risk that comps aren't pricing in. Stress-test before assuming the spread holds.
Location & tenants
- Location reads 81/100 on livability (#30 in TX, #1,601 nationally) — a professional / high-income tenant draw. Strengths: amenities A+, cost of living A+, health & safety A+; Watch: crime D+, schools F, employment F.
- San Marcos CISD (rural): math 18% / reading 31% proficiency, ranked #731 of 826 in TX (top 88%) — low school quality limits family demand, transient renter base, plan for 1-2y turnover; 63% free/reduced lunch — lower-income household profile, screen leases tightly.
- Market conditions: Rents rising (+2.0%/yr); 1122 active listings in the ZIP; 19 comparable units currently listed for rent nearby; rentals leasing fast (median 13d on market — plan ~1-2 weeks tenant-placement turnaround); 5,270 units permitted in Hays County in 2024 (1,464 in 5+ unit buildings).
- This rent runs 41% of the median local income ($55k/yr) — at the standard rent-burdened threshold; future hikes will face affordability resistance.
Forward outlook
- Local home prices are declining (-3.0%/yr); year-one equity from $1k of loan paydown is wiped out by about $6k of value loss. Plan a longer hold.
- Hays County population projected at +93% by 2050 — long-run rental-demand tailwind backs the buy-and-hold thesis.
Negotiation context
- It's been on market 146 days — a 12% lower offer ($166k) is reasonable based on typical stale-listing flexibility.
- 10 sale attempts since 11y ago with the ask held roughly flat each time — persistent listings suggest the price (not the market) is what's stuck; bring a comps-based counter.
Risks & watch-outs
- Climate carrying-cost: severe wind risk, 80% chance of damaging wind over 30y; moderate wildfire risk; extreme-heat days projected 7→22/yr by 2055 (HVAC capex compounding) — expect insurance premiums to compound above CPI over the hold.
Questions for the listing agent
- It's been on market 146 days. Have you received any prior offers? Is the seller open to a 12% concession, seller financing, or rate buy-down credit?
- Why hasn't it sold? Are there any deal-killer items the seller is aware of (foundation, flood, title, zoning, code violations)?
- Is there a deadline driving the sale (1031 exchange, divorce, estate, relocation)? That informs how much negotiation room exists.
- Schools are F-rated, which usually means shorter tenancies and higher turnover. Who's the typical renter profile here, and what's been the actual vacancy rate?
- Crime grade is D in this area — have there been break-ins, vandalism, or insurance claims at this property in the last 3 years? What carrier currently insures it and at what premium?
- What's the average days-on-market for RENTAL listings here right now (not sales)? A rising rental-DOM trend means longer vacancies and softer asking-rent achievability than the comps imply.
- What's the recent tenant-quality profile in this submarket — average credit score on applications, eviction rate, late-payment / NSF rate, and stable-employment percentage? A property-management company in the area should have these aggregated.
- How much new for-sale + rental construction is in the pipeline within 1–3 miles? Heavy new supply typically softens prices + rents 12–24 months out; constrained supply supports both.
Investment metrics
- 1% rule
- 1.00% ✗
- Cap rate
- 6.90%
- Cash-on-cash
- 2.18%
- DSCR
- 1.10
- GRM
- 8.3
CMA / ARV
- ARV (median comp)
- $266,202
- List price
- $189,000
- Delta
- -29.00%
- Verdict
- UNDERPRICED
- Comps
- 20 within 1.0 mi
Show comp detail 12 sales within ~0.75 mi
| Address | Dist | Beds/Ba | Sqft | Sold | Price | $/sf | Match |
|---|---|---|---|---|---|---|---|
| 1164 Lago Vista St | 0.03mi | 3/2.0 (-1) | 1,438 (+3%) | 6mo | $250,000 | $174 | 84 |
| 1153 Lago Vista St | 0.04mi | 3/2.0 (-1) | 1,401 (0%) | 15mo | $199,900 | $143 | 81 |
| 1112 Overlook Way | 0.17mi | 3/2.0 (-1) | 1,424 (+2%) | 20mo | $249,900 | $175 | 68 |
| 700 Ashley Ct | 0.25mi | 3/2.0 (-1) | 1,381 (-1%) | 18mo | $254,500 | $184 | 66 |
| 812 Lago Vista St | 0.10mi | 3/2.0 (-1) | 1,207 (-14%) | 13mo | $235,000 | $195 | 57 |
| 1509 Parkview Ln | 0.64mi | 3/2.0 (-1) | 1,342 (-4%) | 2mo | $299,000 | $223 | 56 |
| 700 Clearview Cir | 0.24mi | 4/2.0 | 1,595 (+14%) | 13mo | $295,000 | $185 | 55 |
| 700 Lago Vista St | 0.23mi | 3/2.0 (-1) | 1,197 (-15%) | 10mo | $184,999 | $155 | 52 |
| 1602 Parkview Ln | 0.68mi | 3/2.0 (-1) | 1,354 (-3%) | 15mo | $310,000 | $229 | 45 |
| 1505 Mockingbird Dr | 0.59mi | 3/2.0 (-1) | 1,328 (-5%) | 20mo | $259,900 | $196 | 42 |
| 1607 Parkview Ln | 0.67mi | 3/2.0 (-1) | 1,301 (-7%) | 19mo | $249,000 | $191 | 36 |
| 1603 Parkview Ln | 0.66mi | 3/2.0 (-1) | 1,254 (-10%) | 21mo | $289,900 | $231 | 29 |
Match score weights: distance 35% · size 25% · config 20% · recency 20%. Top-matched comps best support the ARV.
Projected returns pro-forma
-3.0% appreciation · 1.98% rent growth · sell at horizon
- IRR
- -14.0%
- Equity multiple
- 0.50×
- Total profit
- $-26,342
- Equity at exit
- $28,181
- IRR
- -7.0%
- Equity multiple
- 0.58×
- Total profit
- $-22,432
- Equity at exit
- $16,341
Cash invested: $52,920 (down + closing). Projections, not guarantees.
Landlord ↔ Tenant lean methodology
- Overall (STATE)
- 87 Strongly Landlord-Friendly
- State Texas
- 87 Strongly Landlord-Friendly · R+5
- County
- — inherits STATE
- City
- — inherits STATE
ZIP-level market 78666
- Rents YoY
- 2.0%
- Active inventory
- 1122
- Price-to-rent
- 8.3×
Monthly cashflow live
- Estimated rent
- $1,888 high interval (Pro) →
- Mortgage (P&I)
- −$991
- Tax from tax record
- −$326 /mo · $3,908/yr
- Insurance
- −$79
- HOA
- −$0
- Vacancy / Maint / Mgmt
- −$397
- Net cashflow
- $96
Break-even live
UW: 25.0% down · 7.5% · 30yr · 1.5% tax · 5.0% vac · 8.0% maint · 8.0% mgmt
Financing live
Cash to close
- Down payment
- $47,250
- Closing costs
- $5,670
- Reserves months
- —
- Total cash needed
- —
Loan-product check · same deal, 3 products live
Conventional
25% down · 7.5% · 30yr
- Down + closing
- —
- Monthly P&I
- —
- Monthly cashflow
- —
- DSCR
- —
- Eligible?
- —
Personal DTI + credit; lowest rate.
DSCR
20% down · 8.5% · 30yr
- Down + closing
- —
- Monthly P&I
- —
- Monthly cashflow
- —
- DSCR
- —
- Eligible?
- —
No personal income docs; deal must DSCR.
Hard money
10% down · 12.0% · 12mo
- Down + closing
- —
- Monthly P&I
- —
- Monthly cashflow
- —
- DSCR
- —
- Eligible?
- —
Short-term bridge; refi at stabilization.
Rent comps 19 comps
| Address | Beds | Baths | Sqft | Rent | $/sqft | DOM | Units | Dist |
|---|---|---|---|---|---|---|---|---|
| 821 Benning San Marcos, TX | 3.0 | 2.5 | 1790 | $1,825 | $1.02 | 18d | 1 | 0.18mi |
| 114 Cloverleaf St San Marcos, TX | 4.0 | 2.0 | 1420 | $1,995 | $1.40 | 44d | 1 | 0.64mi |
| 834 Cottonwood Pkwy San Marcos, TX | 3.0 | 1.0–2.0 | 838 | $1,829 | $2.18 | 2d | 53 | 0.78mi |
| 208 Picasso Dr San Marcos, TX | 3.0 | 2.0 | 1120 | $1,650 | $1.47 | 12d | 1 | 0.99mi |
| 415 Candlelight Ln San Marcos, TX | 5.0 | 2.0 | 1750 | $1,799 | $1.03 | 18d | 1 | 1.01mi |
| 1250 Sadler Dr San Marcos, TX | 4.0 | 1.0–4.0 | 923 | $1,200 | $1.30 | 18d | 1 | 1.07mi |
| 224 Capistrano Dr San Marcos, TX | 4.0 | 2.0 | 1495 | $2,150 | $1.44 | 44d | 1 | 1.10mi |
| 1011 Wonder World Dr San Marcos, TX | 1.0–3.0 | 1.0–2.0 | 1030 | $2,209 | $2.14 | 2d | 34 | 1.12mi |
| 1301 Leah Ave San Marcos, TX | 1.0–3.0 | 1.0–2.0 | 1016 | $2,259 | $2.22 | 4d | 17 | 1.12mi |
| 210 Teron Dr San Marcos, TX | 3.0 | 2.0 | 1490 | $1,709 | $1.15 | 3d | 1 | 1.16mi |
| 101 Salas Dr San Marcos, TX | 3.0 | 2.0 | 1132 | $1,700 | $1.50 | 12d | 1 | 1.19mi |
| 1441 Leah Ave San Marcos, TX | 4.0 | 4.0 | 1500 | $512 | $0.34 | 8d | 4 | 1.21mi |
| 1350 Sadler Dr San Marcos, TX | 1.0–3.0 | 1.0–2.0 | 873 | $1,478 | $1.69 | 3d | 10 | 1.28mi |
| 409 Teron Dr San Marcos, TX | 3.0 | 2.0 | 1373 | $1,775 | $1.29 | 18d | 1 | 1.32mi |
| 417 Capistrano Dr San Marcos, TX | 3.0 | 2.0 | 1354 | $1,850 | $1.37 | 18d | 1 | 1.32mi |
| 3085 N State Highway 123 San Marcos, TX | 1.0–4.0 | 1.0–2.5 | 948 | $1,525 | $1.61 | 2d | 15 | 1.39mi |
| 2380 Staples Rd San Marcos, TX | 1.0–3.0 | 1.0–2.0 | 1053 | $2,279 | $2.16 | 2d | 127 | 1.40mi |
| 617 Conway Dr San Marcos, TX | 3.0 | 2.0 | 1168 | $1,750 | $1.50 | 44d | 1 | 1.43mi |
| 620 Barbara Dr San Marcos, TX | 3.0 | 2.0 | 1728 | $1,700 | $0.98 | 18d | 1 | 1.47mi |
Listing history 40 events
-
2026-06-18days on market $189,000 Active 146 DOM
-
2026-06-17days on market $189,000 Active 145 DOM
-
2026-06-16days on market $189,000 Active 144 DOM
-
2026-06-15days on market $189,000 Active 143 DOM
-
2026-06-13days on market $189,000 Active 141 DOM
-
2026-06-09days on market $189,000 Active 137 DOM
-
2026-06-08days on market $189,000 Active 136 DOM
-
2026-06-07days on market $189,000 Active 135 DOM
-
2026-06-05days on market $189,000 Active 132 DOM
-
2026-06-03days on market $189,000 Active 131 DOM
-
2026-06-02days on market $189,000 Active 130 DOM
-
2026-06-01days on market $189,000 Active 129 DOM
-
2026-05-31days on market $189,000 Active 128 DOM
-
2026-01-23$189,000 Active 447-char remark
Show marketing remark (447 chars)
Discover the perfect blend of comfort and convenience in this home located in the desirable Lago Vista neighborhood. This residence have 4 bedrooms and 2 bathrooms. Enjoy a bright living area with high ceilings and large windows that flood the space with natural light. Experience the best of San Marcos living with easy access to outdoor activities and scenic views. Don’t miss the opportunity to make this wonderful property your new home!
-
2026-01-20status Pending
-
2026-01-14status Pending
-
2026-01-14historical
-
2025-10-30$189,000 Active
-
2025-09-29status Pending
-
2025-09-29historical
-
2025-09-10$278,990 Active
-
2025-08-12status Pending
-
2025-08-12historical
-
2025-07-22$278,990 Active
-
2025-07-22historical
-
2025-04-29$278,990 Active
-
2025-04-29historical
-
2025-04-07status Active
-
2025-01-14status Pending
-
2025-01-10status Option Pending
-
2024-11-19price $245,990
-
2024-11-05$255,990 Active
-
2024-11-04historical
-
2024-10-24$255,990 Active
-
2024-10-24historical
-
2024-08-19$259,990 Active
-
2015-10-07soldstatus
-
2015-09-30$110,000
-
1999-01-22soldstatus
-
1995-03-31soldstatus
ⓘ Source: listings_history table (triggers on properties + properties_extension) + one-shot
backfill from property_details.listing_events for pre-trigger history.
Tax reassessment forecast TX · Resets to sale price
- Current annual tax
- $3,908 · $326/mo
- Projected year-2 tax
- $3,908 · $326/mo
- Expected delta
- $0/yr ($0/mo · 0.0%)
ⓘ Screening estimate from a state-policy table — verify with the county assessor before closing.
Climate risk First Street
- Flood 3/10 Moderate FEMA zone X (unshaded) · 20% chance over 30 yrs
- Wildfire 5/10 Major
- Heat 8/10 Severe 7 d/yr ≥108°F today · 22 d/yr by 30 yrs out
- Wind 8/10 Severe 80% chance of damaging wind over 30 yrs
- Air quality 1/10 Low 0 unhealthy d/yr today · 0 by 30 yrs out
Nearby sold comps map
Loading sold comps map…
Walkable amenities ~0.75 mi
Loading nearby amenities…
Taxation est. · year 1
- Rental income
- $22,658
- − Mortgage interest
- −$10,587
- − Property taxes
- −$3,908
- − Insurance
- −$945
- − Repairs & maintenance
- −$1,813
- − Management
- −$1,813
- − Depreciation
- −$5,498
- Taxable loss
- −$1,906
- Est. tax savings @ 24.0%
- +$457
- After-tax cash flow
- $1,610/yr
For passive investors: Depreciation is non-cash, so a rental often shows a tax loss while cash-flowing — sheltering income. Rental losses are passive: they offset passive income freely, and up to $25,000/yr can offset ordinary (W-2) income if you actively participate and your MAGI is under $100k (phasing out to $0 by $150k); unused losses carry forward. On sale, claimed depreciation is recaptured at up to 25%, and gains may owe capital-gains tax (a 1031 exchange can defer both). Figures are a year-1 estimate at your 24.0% rate — not tax advice; consult a CPA.
Schools (NCES district)
- District
- San Marcos CISD
- NCES district ID
- 4838970
- Math proficiency
- 18% ▼ -16.00%
- Reading proficiency
- 31% ▼ -8.00%
- Median HH income
- $34,538
- Composite
- 20.11/100
- National rank
- #8644
- State rank
- #731 of 826 in TX
Livability — San Marcos
- Score
- 81/100
- State rank
- #30
- US rank
- #1601
Category grades
Schools grade is shown separately in the Schools card above.
Census & demographics
- Census place
- San Marcos, TX
- County
- Hays County · 280,138 people
- City population
- 88,583
- Metro
- Austin-Round Rock-Georgetown, TX
- Population (ZIP)
- 88,583
- Household income
- $54,737
- Rent vs Own
- Severe rent burden
- 6504.0
Population outlook (Hays County) Hauer SSP2
- Today (2025)
- 286,948 people
- By 2030
- 336,923 · +17.4%
- By 2040
- 441,894 · +54.0%
- By 2050
- 553,462 · +92.9%
- By 2075
- 838,261 · +192.1%
- By 2100
- 1,063,658 · +270.7%
Race, ethnicity, and origin ACS 2023
- Neighborhood character
- Diverse neighborhood (Simpson 0.60)
- Race & ethnicity
- White 45% Hispanic / Latino 44% Two or more races 20% Black 5% Asian 2%
- Hispanic origin (detail)
- Mexican 37%
- Common ancestry
- Slovak 2% Lithuanian 2% Italian 1%
- Foreign-born
- 8% · Canada
- Languages at home
- 73% English-only · Spanish 24% Other Indo-European 1%
Political lean MEDSL · Hays
- 2024 margin
- Lean D (+5.7) · D 52.1% · R 46.5% · Other 1.4%
- 2008→2024 swing
- +7.7pp toward D · 2008: -2.0pp · 2024: 5.7pp
- All cycles
- 2024: D+5.7 2020: D+10.8 2016: R+0.9 2012: R+10.4 2008: R+2.0
Not yet ingested
- Civics
- —
Market trends
- HPI YoY
- ▼ -108.27%
- Current HPI
- 187.6679
- Rent YoY
- ▲ 1.98%
- Metro
- Austin-Round Rock-Georgetown, TX
- State GDP YoY
- ▲ 3.95%
- F500 in state
- 110
Industry mix (Fortune 500 HQ in TX)
| Industry | F500 HQs | Revenue |
|---|---|---|
| Energy | 16 | $1,198B |
|
||
| Technology | 5 | $198B |
|
||
| Engineering / Construction | 4 | $72B |
|
||
| Energy Services | 3 | $60B |
|
||
| Utilities | 3 | $41B |
|
||
| Healthcare | 2 | $330B |
|
||
Price history
+71.8% since first listed27 events — show timeline
- 2026-01-23 Listed $189,000 HARMLS
- 2026-01-20 Pending — HARMLS
- 2026-01-14 Pending — HARMLS
- 2026-01-14 Listing Removed — HARMLS
- 2025-10-30 Listed $189,000 HARMLS
- 2025-09-29 Pending — HARMLS
- 2025-09-29 Listing Removed — HARMLS
- 2025-09-10 Listed $278,990 HARMLS
- 2025-08-12 Pending — HARMLS
- 2025-08-12 Listing Removed — HARMLS
- 2025-07-22 Listing Removed — HARMLS
- 2025-07-22 Listed $278,990 HARMLS
- 2025-04-29 Listing Removed — HARMLS
- 2025-04-29 Listed $278,990 HARMLS
- 2025-04-07 Relisted — HARMLS
- 2025-01-14 Pending — HARMLS
- 2025-01-10 Pending — HARMLS
- 2024-11-19 Price Changed $245,990 HARMLS
- 2024-11-05 Listed $255,990 HARMLS
- 2024-11-04 Listing Removed — HARMLS
- 2024-10-24 Listing Removed — HARMLS
- 2024-10-24 Listed $255,990 HARMLS
- 2024-08-19 Listed $259,990 HARMLS
- 2015-10-07 Sold (Public Records) — Public Records
- 2015-09-30 Listed $110,000 CTXMLS
- 1999-01-22 Sold (Public Records) — Public Records
- 1995-03-31 Sold (Public Records) — Public Records
Property tax history
+2.5%/yrLatest (2025): $3,908 · -12.5% YoY. Source: county tax records.
Cash-flow waterfall
monthlySold comps — $/sqft
last 12 mo · ≤1 miLoading sold comps…