7660 Mountain View Rd · Abilene, TX
Flood risk No data
- FEMA flood zone
- —
- Chance of flooding over 30 yrs
- —
- Est. flood insurance / yr
- —
Fire risk No data
- Est. fire insurance / yr
- —
Heat risk No data
- Hot days now (above threshold)
- —
- Hot days in 30 yrs
- —
Wind risk No data
- Chance of severe wind over 30 yrs
- —
Air-quality risk No data
- Unhealthy air days now
- —
- Unhealthy air days in 30 yrs
- —
Risk factors via First Street. Map © Google.
Why this score? — see what drove the D grade
The composite is a weighted blend of 9 inputs, each scored 0–100. Each bar is that input's sub-score; the figure is the points it added to the 100-point composite (weight × sub-score).
- Cash flow +14.3/30.0
- ARV discount +6.8/15.0
- Schools +5.6/10.0
- Rent growth +5.0/5.0
- DSCR +4.4/10.0
- 1% rule +4.1/10.0
- Livability +3.8/5.0
- Condition / age +1.0/5.0
- Appreciation +0.0/10.0
$351,400
🖨 Deal sheet 📄 Offer letter ✓ Due diligence
Listing remarks
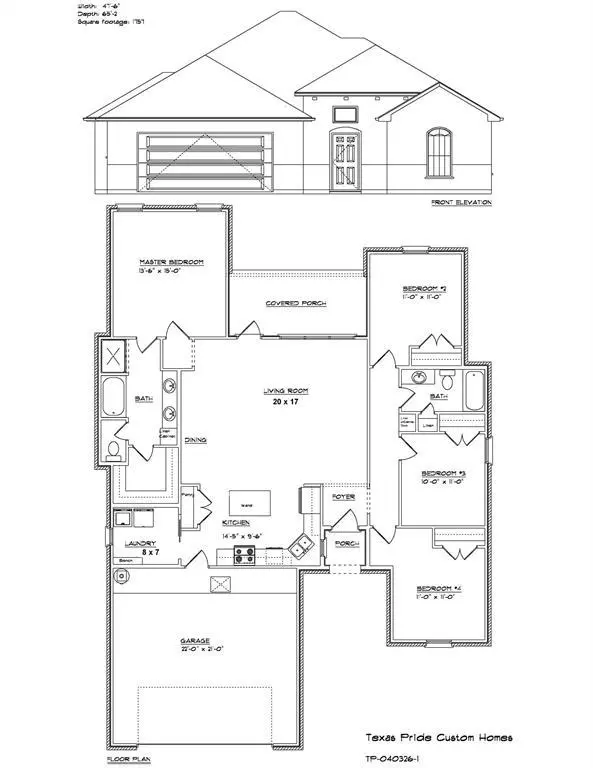
Texas Pride Custom Homes • New floor plan • 4 bed • 2 bath • 1,757 sq ft • Carriage Hills • Wylie ISD East Fresh design and functional space come together in this Texas Pride Custom Homes floor plan in Carriage Hills. With 4 bedrooms, 2 bathrooms, and 1,757 square feet, 7660 Mountain View Rd. offers an open living, dining, and kitchen layout that feels bright, connected, and ready for everyday life. The split-bedroom design gives the primary suite added privacy, while the kitchen island, pantry, and laundry room with bench-drop zone add convenience where it counts. A welcoming front porch, covered back porch, and 2-car garage round out the layout. Located in
Key facts
- Pantry
- Laundry room
- Front porch
Tags
Property features AI
Finance
- Other: Builder special listing condition; Possession at closing/funding or upon completion
- Financial info: Acceptable financing: Cash, Conventional, FHA, VA
- HOA & community: Mandatory association; Annual HOA fee of $250; HOA includes management fees
Exterior
- Parking: 2 covered spaces; 2-car attached garage with garage door opener; garage faces front; Driveway
- Security: Smoke detector(s)
- Utilities: City water; City sewer; Electricity connected; Municipal utility district; Community mailbox; Curbs and sidewalk; Rain/freeze sensors
- Home design: Single-family residence; New construction (incomplete); One story; Not attached to another property; Restrictions: Deed and development
- Construction: Built in 2026 (new construction - incomplete); Brick, rock/stone and siding exterior; Composition roof; Slab foundation
- Exterior features: Covered porch(es); Covered patio/porch; Wood fencing; Landscaped yard; Sprinkler system; Interior lot in a subdivision; Easements for utilities
Interior
- Kitchen: Dishwasher; Disposal; Electric range; Microwave; Kitchen island
- Bedrooms: 4 bedrooms (all on main level); Primary bedroom on main level with dual sinks, ensuite bath, separate shower and walk-in closet
- Flooring: Vinyl flooring
- Bathrooms: 2 full bathrooms
- Heating & cooling: Electric heating; Ceiling fan(s); Electric cooling
- Interior features: High-speed internet available; Kitchen island; Walk-in closet(s); Room count: 7; One living area; One dining area; One-level home
- Laundry & utility: Full-size washer/dryer area; Washer hookup; Electric dryer hookup; Utility room with built-in cabinets and drip/dry area; Separate utility room
Neighborhood map
What this means for you Summary
Snapshot
- This is a 4-bed/2.0-bath single-family listed at $351k. Condition is rated poor.
Deal economics
- At list price, monthly cash flow is $66 ($794/yr) — positive.
- The deal already cash-flows at list — no discount required.
- To meet the 1% rule (rent ≥ 1% of price), the offer needs to be $318k (9.4% below list).
- Recommended offer: $318k (9.4% below list) — sets the bar for 1% rule.
Location & tenants
- Location reads 75/100 on livability (#142 in TX, #4,037 nationally) — a middle-class / working-renter tenant base. Strengths: cost of living A+, housing A+, health & safety A+; Watch: crime D, commute F.
- Wylie ISD (rural): math 63% / reading 62% proficiency, ranked #32 of 826 in TX (top 4%) — acceptable for families but not a draw, mixed tenant base, ~2y average lease; only 17% free/reduced lunch — higher-income household profile.
- Zoned schools: Wylie East El (math 58% / reading 58%, grade C+, #480 of 4,322 statewide, top 11%, 789 students, 30% FRL).
- Market conditions: Rents rising fast (+33.5%/yr); 370 active listings in the ZIP; 24 comparable units currently listed for rent nearby; rentals leasing fast (median 12d on market — plan ~1-2 weeks tenant-placement turnaround); solid renter incomes; 508 units permitted in Taylor County in 2024 (0 in 5+ unit buildings).
- This rent runs 43% of the median local income ($90k/yr) — at the standard rent-burdened threshold; future hikes will face affordability resistance.
Forward outlook
- Local home prices are declining (-3.0%/yr); year-one equity from $2k of loan paydown is wiped out by about $11k of value loss. Plan a longer hold.
- Taylor County population projected at +16% by 2050 — long-run rental-demand tailwind backs the buy-and-hold thesis.
Negotiation context
- It's been on market 17 days — a 2% lower offer ($346k) is reasonable based on typical stale-listing flexibility.
Questions for the listing agent
- Have any recent inspections been done? Can we get a copy of the seller's disclosures and any deferred-maintenance estimates?
- What does the HOA fee cover, when was the last increase, and are there any pending special assessments or reserve-fund shortfalls?
- Is there a deadline driving the sale (1031 exchange, divorce, estate, relocation)? That informs how much negotiation room exists.
- Schools are D-rated, which usually means shorter tenancies and higher turnover. Who's the typical renter profile here, and what's been the actual vacancy rate?
- Crime grade is D in this area — have there been break-ins, vandalism, or insurance claims at this property in the last 3 years? What carrier currently insures it and at what premium?
- The area grade is low — what's the realistic commute time and amenity access for the typical tenant pool here? Any planned neighborhood developments (good or bad) we should know about?
- What's the average days-on-market for RENTAL listings here right now (not sales)? A rising rental-DOM trend means longer vacancies and softer asking-rent achievability than the comps imply.
- What's the recent tenant-quality profile in this submarket — average credit score on applications, eviction rate, late-payment / NSF rate, and stable-employment percentage? A property-management company in the area should have these aggregated.
- How much new for-sale + rental construction is in the pipeline within 1–3 miles? Heavy new supply typically softens prices + rents 12–24 months out; constrained supply supports both.
Investment metrics
- 1% rule
- 0.91% ✗
- Cap rate
- 6.52%
- Cash-on-cash
- 0.81%
- DSCR
- 1.04
- GRM
- 9.2
CMA / ARV
- ARV (on-the-fly)
- $346,129
- Comps found
- 12
Show comp detail 12 sales within ~0.75 mi
| Address | Dist | Beds/Ba | Sqft | Sold | Price | $/sf | Match |
|---|---|---|---|---|---|---|---|
| 7633 Wildflower Way | 0.25mi | 4/2.0 | 1,764 (+0%) | 1mo | $348,000 | $197 | 87 |
| 7654 Hudson Way | 0.05mi | 4/2.0 | 1,577 (-10%) | 1mo | $335,000 | $212 | 80 |
| 7685 Lake Ridge Pkwy | 0.13mi | 3/2.0 (-1) | 1,650 (-6%) | 0mo | $325,000 | $197 | 78 |
| 7689 Lake Ridge Pkwy | 0.14mi | 3/2.0 (-1) | 1,650 (-6%) | 1mo | $325,000 | $197 | 78 |
| 7693 Lake Ridge Pkwy | 0.15mi | 3/2.0 (-1) | 1,650 (-6%) | 0mo | $325,000 | $197 | 78 |
| 149 Spring Park Way | 0.32mi | 3/2.0 (-1) | 1,714 (-2%) | 1mo | $289,000 | $169 | 75 |
| 132 Lake Ridge Ct | 0.25mi | 3/2.0 (-1) | 1,662 (-5%) | 1mo | $350,000 | $211 | 74 |
| 7321 Wildflower Way | 0.65mi | 4/2.0 | 1,737 (-1%) | 1mo | $335,000 | $193 | 67 |
| 7584 Wildflower | 0.21mi | 3/2.0 (-1) | 1,522 (-13%) | 0mo | $304,900 | $200 | 63 |
| 7580 Wildflower | 0.21mi | 3/2.0 (-1) | 1,522 (-13%) | 0mo | $304,900 | $200 | 62 |
| 250 Martis Way | 0.57mi | 4/2.0 | 1,650 (-6%) | 1mo | $325,000 | $197 | 62 |
| 331 Sophia Ln | 0.61mi | 3/2.0 (-1) | 1,632 (-7%) | 0mo | $329,000 | $202 | 54 |
Match score weights: distance 35% · size 25% · config 20% · recency 20%. Top-matched comps best support the ARV.
Projected returns pro-forma
-3.0% appreciation · 8.0% rent growth · sell at horizon
- IRR
- -9.5%
- Equity multiple
- 0.64×
- Total profit
- $-35,839
- Equity at exit
- $52,395
- IRR
- 5.7%
- Equity multiple
- 1.52×
- Total profit
- $51,057
- Equity at exit
- $30,383
Cash invested: $98,392 (down + closing). Projections, not guarantees.
Landlord ↔ Tenant lean methodology
- Overall (STATE)
- 87 Strongly Landlord-Friendly
- State Texas
- 87 Strongly Landlord-Friendly · R+5
- County
- — inherits STATE
- City
- — inherits STATE
ZIP-level market 79602
- Home prices YoY
- -19.6%
- Rents YoY
- 33.5%
- Active inventory
- 370
- Price-to-rent
- 9.2×
Monthly cashflow live
- Estimated rent
- $3,184 high interval (Pro) →
- Mortgage (P&I)
- −$1,843
- Tax est. 1.5%
- −$439 /mo · $5,271/yr
- Insurance
- −$146
- HOA
- −$21
- Vacancy / Maint / Mgmt
- −$669
- Net cashflow
- $66
Break-even live
UW: 25.0% down · 7.5% · 30yr · 1.5% tax · 5.0% vac · 8.0% maint · 8.0% mgmt
Financing live
Cash to close
- Down payment
- $87,850
- Closing costs
- $10,542
- Reserves months
- —
- Total cash needed
- —
Loan-product check · same deal, 3 products live
Conventional
25% down · 7.5% · 30yr
- Down + closing
- —
- Monthly P&I
- —
- Monthly cashflow
- —
- DSCR
- —
- Eligible?
- —
Personal DTI + credit; lowest rate.
DSCR
20% down · 8.5% · 30yr
- Down + closing
- —
- Monthly P&I
- —
- Monthly cashflow
- —
- DSCR
- —
- Eligible?
- —
No personal income docs; deal must DSCR.
Hard money
10% down · 12.0% · 12mo
- Down + closing
- —
- Monthly P&I
- —
- Monthly cashflow
- —
- DSCR
- —
- Eligible?
- —
Short-term bridge; refi at stabilization.
Rent comps 24 comps
| Address | Beds | Baths | Sqft | Rent | $/sqft | DOM | Units | Dist |
|---|---|---|---|---|---|---|---|---|
| 7650 Hudson Way Abilene, TX | 4.0 | 2.0 | 1577 | $3,295 | $2.09 | 13d | 1 | 0.03mi |
| 7646 Hudson Way Abilene, TX | 4.0 | 2.0 | 1577 | $3,295 | $2.09 | 21d | 1 | 0.04mi |
| 7627 Hudson Way Abilene, TX | 4.0 | 2.0 | 1598 | $8,900 | $5.57 | 13d | 1 | 0.08mi |
| 7625 Wildflower Way Abilene, TX | 4.0 | 3.0 | 1800 | $3,300 | $1.83 | 4d | 1 | 0.12mi |
| 7717 Sawdust Trl Abilene, TX | 3.0 | 2.0 | 1502 | $3,375 | $2.25 | 11d | 1 | 0.14mi |
| 7709 Sawdust Trl Abilene, TX | 3.0 | 2.0 | 1502 | $3,200 | $2.13 | 44d | 1 | 0.14mi |
| 385 Kristie Path Abilene, TX | 3.0 | 2.0 | 1449 | $2,700 | $1.86 | 3d | 1 | 0.15mi |
| 7949 Sawdust Trl Abilene, TX | 3.0 | 2.0 | 1508 | $2,995 | $1.99 | 44d | 1 | 0.17mi |
| 405 Kristie Path Abilene, TX | 3.0 | 2.0 | 1439 | $2,895 | $2.01 | 7d | 1 | 0.17mi |
| 409 Kristie Path Abilene, TX | 3.0 | 2.0 | 1409 | $2,895 | $2.05 | 5d | 1 | 0.17mi |
| 8001 Sawdust Trl Abilene, TX | 3.0 | 2.0 | 1508 | $2,995 | $1.99 | 44d | 1 | 0.19mi |
| 8009 Sawdust Trl Abilene, TX | 3.0 | 2.0 | 1508 | $2,995 | $1.99 | 44d | 1 | 0.20mi |
| 385 Kristi Path Abilene, TX | 3.0 | 2.0 | 1449 | $2,700 | $1.86 | 3d | 1 | 0.22mi |
| 342 Pilgrim Rd Abilene, TX | 4.0 | 3.0 | 2613 | $3,500 | $1.34 | 4d | 1 | 0.28mi |
| 273 Martis Way Abilene, TX | 4.0 | 2.0 | 1660 | $3,200 | $1.93 | 13d | 1 | 0.56mi |
| 331 Sophia Ln Abilene, TX | 3.0 | 2.0 | 1632 | $3,195 | $1.96 | 4d | 1 | 0.62mi |
| 7328 Mountain View Rd Abilene, TX | 3.0 | 2.0 | 1481 | $2,995 | $2.02 | 11d | 1 | 0.64mi |
| 7326 Mountain View Rd Unit 7328 Abilene, TX | 3.0 | 2.0 | 1481 | $2,995 | $2.02 | 11d | 1 | 0.65mi |
| 7319 Mountain View Rd Abilene, TX | 3.0 | 2.0 | 1502 | $4,000 | $2.66 | 44d | 1 | 0.67mi |
| 7309 Wildflower Way Abilene, TX | 3.0 | 2.0 | 1578 | $3,195 | $2.02 | 24d | 1 | 0.69mi |
| 250 Southlake Dr Abilene, TX | 4.0 | 2.0 | 2006 | $3,400 | $1.69 | 3d | 1 | 0.91mi |
| 349 Whiterock Dr Abilene, TX | 4.0 | 2.0 | 1809 | $6,000 | $3.32 | 17d | 1 | 0.95mi |
| 350 Miss Ellie Ln Abilene, TX | 3.0 | 2.0 | 1414 | $2,600 | $1.84 | 7d | 1 | 1.25mi |
| 350 Miss Ellie Ln Abilene, TX | 3.0 | 2.0 | 1414 | $2,600 | $1.84 | 3d | 1 | 1.25mi |
HOA detail
- Monthly dues
- $21 · $252/yr
Listing history 13 events
-
2026-06-19days on market $351,400 Active 17 DOM
-
2026-06-18days on market $351,400 Active 16 DOM
-
2026-06-17days on market $351,400 Active 15 DOM
-
2026-06-16days on market $351,400 Active 14 DOM
-
2026-06-15days on market $351,400 Active 13 DOM
-
2026-06-14days on market $351,400 Active 11 DOM
-
2026-06-13days on market $351,400 Active 10 DOM
-
2026-06-10days on market $351,400 Active 8 DOM
-
2026-06-09days on market $351,400 Active 7 DOM
-
2026-06-08days on market $351,400 Active 6 DOM
-
2026-06-07days on market $351,400 Active 5 DOM
-
2026-06-03remarks 669-char remark
-
2026-06-03$351,400 Active 1 DOM
ⓘ Source: listings_history table (triggers on properties + properties_extension) + one-shot
backfill from property_details.listing_events for pre-trigger history.
Nearby sold comps map
Loading sold comps map…
Walkable amenities ~0.75 mi
Loading nearby amenities…
Taxation est. · year 1
- Rental income
- $38,212
- − Mortgage interest
- −$19,684
- − Property taxes
- −$5,271
- − Insurance
- −$1,757
- − Repairs & maintenance
- −$3,057
- − Management
- −$3,057
- − HOA
- −$252
- − Depreciation
- −$10,223
- Taxable loss
- −$5,089
- Est. tax savings @ 24.0%
- +$1,221
- After-tax cash flow
- $2,015/yr
For passive investors: Depreciation is non-cash, so a rental often shows a tax loss while cash-flowing — sheltering income. Rental losses are passive: they offset passive income freely, and up to $25,000/yr can offset ordinary (W-2) income if you actively participate and your MAGI is under $100k (phasing out to $0 by $150k); unused losses carry forward. On sale, claimed depreciation is recaptured at up to 25%, and gains may owe capital-gains tax (a 1031 exchange can defer both). Figures are a year-1 estimate at your 24.0% rate — not tax advice; consult a CPA.
Condition & rehab AI · 2 photos
This home requires extensive repairs and maintenance, including a new roof, exterior painting, and HVAC system replacement. Significant structural and functional issues are evident, making it a high-potential project for an investor looking to improve and resell the property.
Repairs flagged
- Major roof — Significant damage and potential leaks are visible.
- Major siding — Peeling and discoloration are evident.
- Major paint — Significant wear and tear are visible.
- Major flooring — Visible wear and tear and potential damage.
- Major interior walls — Significant wear and tear and potential damage.
- Major windows — Potential damage and potential leaks.
- Major foundation/structure — Potential structural issues.
- Major HVAC/mechanicals — Potential issues.
Value-add opportunities
- Both roof replacement — A new roof will significantly improve the home's appearance and functionality, enhancing both resale and rental value.
- Both exterior painting — Fresh paint will improve the home's curb appeal and overall appearance, enhancing both resale and rental value.
- Both HVAC system replacement — A new HVAC system will improve comfort and energy efficiency, enhancing both resale and rental value.
Renovation cost estimate screening
| Repair item | Severity | Est. cost |
|---|---|---|
| roof · Significant damage and potential leaks are visible. | Major | $15,000–50,000 |
| siding · Peeling and discoloration are evident. | Major | $15,000–50,000 |
| paint · Significant wear and tear are visible. | Major | $15,000–50,000 |
| flooring · Visible wear and tear and potential damage. | Major | $15,000–50,000 |
| interior walls · Significant wear and tear and potential damage. | Major | $15,000–50,000 |
| windows · Potential damage and potential leaks. | Major | $15,000–50,000 |
| foundation/structure · Potential structural issues. | Major | $15,000–50,000 |
| HVAC/mechanicals · Potential issues. | Major | $15,000–50,000 |
| Total estimated repair cost · 8 items | $120,000–400,000 |
Value-add ROI direction
- Both roof replacement — A new roof will significantly improve the home's appearance and functionality, enhancing both resale and rental value. ↑
- Both exterior painting — Fresh paint will improve the home's curb appeal and overall appearance, enhancing both resale and rental value. ↑
- Both HVAC system replacement — A new HVAC system will improve comfort and energy efficiency, enhancing both resale and rental value. ↑
ⓘ Cost ranges are severity-bucket heuristics (US national rule-of-thumb). Get contractor quotes + a written scope before underwriting a rehab budget.
Schools (NCES district)
- District
- Wylie ISD
- NCES district ID
- 4846500
- Math proficiency
- 63% ▼ -12.00%
- Reading proficiency
- 62% ▼ -4.00%
- Median HH income
- $78,248
- Composite
- 55.86/100
- National rank
- #1206
- State rank
- #32 of 826 in TX
Livability — Abilene
- Score
- 75/100
- State rank
- #142
- US rank
- #4037
Category grades
Schools grade is shown separately in the Schools card above.
Census & demographics
- Census place
- Abilene, TX
- County
- Taylor County · 136,672 people
- City population
- 136,672
- Metro
- Abilene, TX
- Population (ZIP)
- 27,425
- Household income
- $89,551
- Rent vs Own
- Severe rent burden
- 338.0
Population outlook (Taylor County) Hauer SSP2
- Today (2025)
- 145,270 people
- By 2030
- 150,050 · +3.3%
- By 2040
- 159,417 · +9.7%
- By 2050
- 168,883 · +16.3%
- By 2075
- 194,436 · +33.8%
- By 2100
- 203,163 · +39.9%
Race, ethnicity, and origin ACS 2023
- Neighborhood character
- Majority White (64%)
- Race & ethnicity
- White 64% Hispanic / Latino 22% Two or more races 12% Black 10% Asian 2%
- Hispanic origin (detail)
- Mexican 19%
- Common ancestry
- Romanian 2% Italian 2% Portuguese 2%
- Foreign-born
- 6% · Canada, Vietnam, Jamaica
- Languages at home
- 87% English-only · Spanish 9% Other Asian/Pacific 1% French/Haitian/Cajun 1%
Political lean MEDSL · Taylor
- 2024 margin
- Solid R (+49.8) · D 24.6% · R 74.4% · Other 1.0%
- 2008→2024 swing
- -4.2pp toward R · 2008: -45.6pp · 2024: -49.8pp
- All cycles
- 2024: R+49.8 2020: R+45.3 2016: R+51.1 2012: R+53.6 2008: R+45.6
Not yet ingested
- Civics
- —
Market trends
- HPI YoY
- ▼ -46.04%
- Current HPI
- 189.3098
- Rent YoY
- ▲ 33.46%
- Metro
- Abilene, TX
- State GDP YoY
- ▲ 3.95%
- F500 in state
- 110
Industry mix (Fortune 500 HQ in TX)
| Industry | F500 HQs | Revenue |
|---|---|---|
| Energy | 16 | $1,198B |
|
||
| Technology | 5 | $198B |
|
||
| Engineering / Construction | 4 | $72B |
|
||
| Energy Services | 3 | $60B |
|
||
| Utilities | 3 | $41B |
|
||
| Healthcare | 2 | $330B |
|
||
Price history
1 event — show timeline
- 2026-06-02 Listed $351,400 NTREIS
Cash-flow waterfall
monthlySold comps — $/sqft
last 12 mo · ≤1 miLoading sold comps…