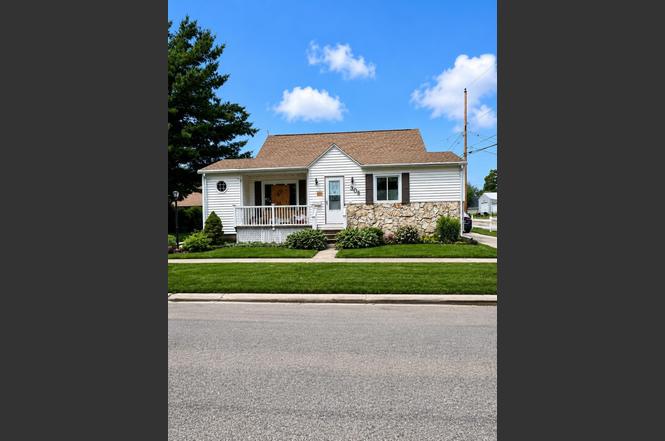
305 Pine St · Reinbeck, IA
Flood risk 1/10 · Minimal
- FEMA flood zone
- X (unshaded)
- Chance of flooding over 30 yrs
- 0.0%
- Est. flood insurance / yr
- $473 – $860
Fire risk 3/10 · Minor
- Est. fire insurance / yr
- $902 – $1,676
Heat risk 3/10 · Minor
- Hot days now (above 102°F)
- 7 days/yr
- Hot days in 30 yrs
- 16 days/yr
Wind risk 2/10 · Minimal
- Chance of severe wind over 30 yrs
- —
Air-quality risk 1/10 · Minimal
- Unhealthy air days now
- 0 days/yr
- Unhealthy air days in 30 yrs
- 0 days/yr
Risk factors via First Street. Map © Google.
Why this score? — see what drove the F grade
The composite is a weighted blend of 9 inputs, each scored 0–100. Each bar is that input's sub-score; the figure is the points it added to the 100-point composite (weight × sub-score).
- Appreciation +10.0/10.0
- Cash flow +6.7/30.0
- Schools +6.4/10.0
- Livability +3.5/5.0
- Rent growth +2.5/5.0
- Condition / age +2.5/5.0
- 1% rule +1.0/10.0
- DSCR +0.9/10.0
- ARV discount +0.0/15.0
$185,000
🖨 Deal sheet (PDF) 📄 Offer letter ✓ Due diligence
Listing remarks
Nice 3 bedroom One Story Home In Reinbeck looking for a new owner!! This home has been owned by the same folks since 1962!! This property has 1084 finished square feet of comfy living space on the main floor. The main floor has two bedrooms, with a spacious full bathroom! Plenty of cabinets and counter space in the eat in kitchen! Upstairs find a gorgeous pine finished additional bedroom! Wait a minute!! What two parcels = 2 garages?? Yes that is correct, there's a detached double stall garage for the home and behind the home and garage, there's another parcel with a huge 36 x 24 shop with an additional garden shed!!! HELLO!!! You won't run out of garage space here folks!! Both
Key facts
- Two parcels
- One story home
- Eat in kitchen
Tags
Property features AI
Exterior
- Parking: Carport with 3 spaces; Detached oversized garage with garage door opener
- Utilities: Public water; Public sewer
- Home design: Single-family residence; Residential property
- Construction: Stone and vinyl siding exterior
- Exterior features: Asphalt roof; Concrete road access; Workshop on property; Additional parcel included; Zoned R-1
Interior
- Bathrooms: 1 full bathroom
- Heating & cooling: Central air conditioning; Forced air heating; Natural gas heating
- Interior features: Eat-in kitchen; Unfinished basement
Neighborhood map
What this means for you Summary
Snapshot
- This is a 3-bed/2.0-bath single-family listed at $185k.
Deal economics
- At list price, monthly cash flow is $-299 ($-4k/yr) — negative.
- To cash-flow at today's rent, offer at most $132k (28.6% below list).
- To meet the 1% rule (rent ≥ 1% of price), the offer needs to be $111k (39.8% below list).
- Recommended offer: $111k (39.8% below list) — sets the bar for 1% rule.
Location & tenants
- Location reads 70/100 on livability (#382 in IA) — a middle-class / working-renter tenant base. Strengths: crime A+, cost of living A+, housing A+; Watch: amenities F, commute F.
- Gladbrook-Reinbeck Community School District (rural): math 76% / reading 74% proficiency, ranked #71 of 289 in IA (top 25%) — strong family-tenant draw, lease renewals of 3-5y typical.
- Zoned schools: Gladbrook-Reinbeck Elementary School (math 77% / reading 67%, grade A-, #181 of 616 statewide, top 34%, 253 students, 33% FRL); Gladbrook-Reinbeck Jr. High & High School (math 77% / reading 77%, grade A-, #60 of 336 statewide, top 21%, 212 students, 35% FRL).
- Market conditions: 14 active listings in the ZIP; 14 units permitted in Grundy County in 2024 (0 in 5+ unit buildings).
Forward outlook
- In year one you build about $20k of equity ($1k loan paydown + $18k appreciation (10.0% local appreciation)).
- By year 2, paydown + projected appreciation supports a ~$32k cash-out refi (75% LTV) — recoverable capital for the next deal without selling this one.
Negotiation context
- Only 4 days on market — expect competitive offers; lowballing is unlikely to land.
Risks & watch-outs
- Watch-outs: built in 1947 — expect roof / HVAC / electrical / plumbing capex.
Questions for the listing agent
- What do current leases actually rent for vs. the listed asking? Can we see a recent rent roll and the last 12 months of T-12 income?
- Built in 1947 — when were the roof, HVAC, electrical panel, plumbing, and water heater last replaced?
- Is there a deadline driving the sale (1031 exchange, divorce, estate, relocation)? That informs how much negotiation room exists.
- Schools are A-rated — typically a magnet for longer-tenancy family renters. What's the average tenant stay here, and is there a school-zone premium baked into asking?
- The area grade is low — what's the realistic commute time and amenity access for the typical tenant pool here? Any planned neighborhood developments (good or bad) we should know about?
- What's the average days-on-market for RENTAL listings here right now (not sales)? A rising rental-DOM trend means longer vacancies and softer asking-rent achievability than the comps imply.
- What's the recent tenant-quality profile in this submarket — average credit score on applications, eviction rate, late-payment / NSF rate, and stable-employment percentage? A property-management company in the area should have these aggregated.
- How much new for-sale + rental construction is in the pipeline within 1–3 miles? Heavy new supply typically softens prices + rents 12–24 months out; constrained supply supports both.
Investment metrics
- 1% rule
- 0.60% ✗
- Cap rate
- 4.35%
- Cash-on-cash
- -6.93%
- DSCR
- 0.69
- GRM
- 13.9
CMA / ARV
- ARV (on-the-fly)
- $128,428
- Comps found
- 8
Show comp detail 8 sales within ~0.75 mi
| Address | Dist | Beds/Ba | Sqft | Sold | Price | $/sf | Match |
|---|---|---|---|---|---|---|---|
| 106 Clark St | 0.11mi | 2/1.5 (-1) | 1,377 (+4%) | 2mo | $127,000 | $92 | 80 |
| 303 West St | 0.29mi | 3/1.0 | 1,232 (-7%) | 1mo | $120,000 | $97 | 70 |
| 301 West St | 0.29mi | 3/1.0 | 1,248 (-6%) | 4mo | $108,000 | $87 | 69 |
| 122 Randall St | 0.07mi | 2/1.5 (-1) | 1,206 (-9%) | 13mo | $189,900 | $157 | 64 |
| 803 Randall St | 0.42mi | 3/1.0 | 1,288 (-3%) | 11mo | $65,500 | $51 | 63 |
| 426 Commercial St | 0.33mi | 3/1.0 | 1,440 (+9%) | 11mo | $190,000 | $132 | 57 |
| 806 3rd St | 0.44mi | 3/1.0 | 1,445 (+9%) | 12mo | $135,000 | $93 | 51 |
| 105 Southridge Dr | 0.59mi | 2/2.0 (-1) | 1,436 (+8%) | 12mo | $265,000 | $185 | 44 |
Match score weights: distance 35% · size 25% · config 20% · recency 20%. Top-matched comps best support the ARV.
Projected returns pro-forma
10.0% appreciation · 3.0% rent growth · sell at horizon
- IRR
- 19.4%
- Equity multiple
- 2.58×
- Total profit
- $81,666
- Equity at exit
- $166,663
- IRR
- 17.8%
- Equity multiple
- 5.93×
- Total profit
- $255,381
- Equity at exit
- $359,414
Cash invested: $51,800 (down + closing). Projections, not guarantees.
Landlord ↔ Tenant lean methodology
- Overall (STATE)
- 83 Strongly Landlord-Friendly
- State Iowa
- 83 Strongly Landlord-Friendly · R+6
- County
- — inherits STATE
- City
- — inherits STATE
ZIP-level market 50669
- Home prices YoY
- 4.9%
- Active inventory
- 14
- Price-to-rent
- 13.9×
Monthly cashflow live
- Estimated rent
- $1,113 medium interval (Pro) →
- Mortgage (P&I)
- −$970
- Tax from tax record
- −$131 /mo · $1,572/yr
- Insurance
- −$77
- HOA
- −$0
- Vacancy / Maint / Mgmt
- −$234
- Net cashflow
- $-299
Break-even live
Sensitivity live
| Price | -10% $-194 | -5% $-247 | +0% $-299 | +5% $-351 | +10% $-404 |
|---|---|---|---|---|---|
| Rent | -10% $-387 | -5% $-343 | +0% $-299 | +5% $-255 | +10% $-211 |
| Rate | -1.0pp $-206 | -0.5pp $-252 | base $-299 | +0.5pp $-347 | +1.0pp $-396 |
UW: 25.0% down · 7.5% · 30yr · 1.5% tax · 5.0% vac · 8.0% maint · 8.0% mgmt
Financing live
Cash to close
- Down payment
- $46,250
- Closing costs
- $5,550
- Reserves months
- —
- Total cash needed
- —
Loan-product check · same deal, 3 products live
Conventional
25% down · 7.5% · 30yr
- Down + closing
- —
- Monthly P&I
- —
- Monthly cashflow
- —
- DSCR
- —
- Eligible?
- —
Personal DTI + credit; lowest rate.
DSCR
20% down · 8.5% · 30yr
- Down + closing
- —
- Monthly P&I
- —
- Monthly cashflow
- —
- DSCR
- —
- Eligible?
- —
No personal income docs; deal must DSCR.
Hard money
10% down · 12.0% · 12mo
- Down + closing
- —
- Monthly P&I
- —
- Monthly cashflow
- —
- DSCR
- —
- Eligible?
- —
Short-term bridge; refi at stabilization.
Listing history 5 events
-
2026-06-19days on market $185,000 Active 4 DOM
-
2026-06-18days on market $185,000 Active 3 DOM
-
2026-06-17days on market $185,000 Active 2 DOM
-
2026-06-16remarks 699-char remark
-
2026-06-16$185,000 Active 1 DOM
ⓘ Source: listings_history table (triggers on properties + properties_extension) + one-shot
backfill from property_details.listing_events for pre-trigger history.
Tax reassessment forecast IA · Partial reset (capped growth)
- Current annual tax
- $1,572 · $131/mo
- Projected year-2 tax
- $2,238 · $187/mo
- Expected delta
- +$666/yr (+$56/mo · 42.4%)
ⓘ Screening estimate from a state-policy table — verify with the county assessor before closing.
Climate risk First Street
- Flood 1/10 Low FEMA zone X (unshaded) · 0% chance over 30 yrs
- Wildfire 3/10 Moderate
- Heat 3/10 Moderate 7 d/yr ≥102°F today · 16 d/yr by 30 yrs out
- Wind 2/10 Low
- Air quality 1/10 Low 0 unhealthy d/yr today · 0 by 30 yrs out
Nearby sold comps map
Loading sold comps map…
Walkable amenities ~0.75 mi
Loading nearby amenities…
Taxation est. · year 1
- Rental income
- $13,355
- − Mortgage interest
- −$10,363
- − Property taxes
- −$1,572
- − Insurance
- −$925
- − Repairs & maintenance
- −$1,068
- − Management
- −$1,068
- − Depreciation
- −$5,382
- Taxable loss
- −$7,023
- Est. tax savings @ 24.0%
- +$1,686
- After-tax cash flow
- $-1,903/yr
For passive investors: Depreciation is non-cash, so a rental often shows a tax loss while cash-flowing — sheltering income. Rental losses are passive: they offset passive income freely, and up to $25,000/yr can offset ordinary (W-2) income if you actively participate and your MAGI is under $100k (phasing out to $0 by $150k); unused losses carry forward. On sale, claimed depreciation is recaptured at up to 25%, and gains may owe capital-gains tax (a 1031 exchange can defer both). Figures are a year-1 estimate at your 24.0% rate — not tax advice; consult a CPA.
Schools (NCES district)
- District
- Gladbrook-Reinbeck Community School District
- NCES district ID
- 1912660
- Math proficiency
- 76% ▼ -3.00%
- Reading proficiency
- 74% ▲ 9.00%
- Median HH income
- $55,866
- Composite
- 64.09/100
- National rank
- #576
- State rank
- #71 of 289 in IA
Livability — Reinbeck
- Score
- 70/100
- State rank
- #382
- US rank
- #8130
Category grades
Schools grade is shown separately in the Schools card above.
Census & demographics
- Census place
- Reinbeck, IA
- Population (ZIP)
- 2,447
Population outlook (Grundy County) Hauer SSP2
- Today (2025)
- 12,452 people
- By 2030
- 12,452 · +0.0%
- By 2040
- 12,437 · -0.1%
- By 2050
- 12,370 · -0.7%
- By 2075
- 12,495 · +0.3%
- By 2100
- 11,823 · -5.1%
Race, ethnicity, and origin ACS 2023
- Neighborhood character
- Predominantly White (95%)
- Race & ethnicity
- White 95% Hispanic / Latino 3% Two or more races 3% Native American 1%
- Common ancestry
- Portuguese 3% Slovak 1% Iranian 1%
- Foreign-born
- 2% · Canada
- Languages at home
- 98% English-only · Spanish 1%
Political lean MEDSL · Grundy
- 2024 margin
- Solid R (+41.8) · D 28.3% · R 70.1% · Other 1.6%
- 2008→2024 swing
- -24.9pp toward R · 2008: -16.9pp · 2024: -41.8pp
- All cycles
- 2024: R+41.8 2020: R+37.4 2016: R+39.5 2012: R+23.1 2008: R+16.9
Not yet ingested
- Civics
- —
Market trends
- HPI YoY
- ▲ 11.93%
- Current HPI
- 257.04
- Rent YoY
- —
- Metro
- —
- State GDP YoY
- ▲ 2.48%
- F500 in state
- 4
Industry mix (Fortune 500 HQ in IA)
| Industry | F500 HQs | Revenue |
|---|---|---|
| Financial Services | 1 | $16B |
|
||
| Retail / Convenience | 1 | $15B |
|
||
Price history
1 event — show timeline
- 2026-06-15 Listed $185,000 NEIRBR as distributed by MLS GRID
Property tax history
+2.3%/yrLatest (2025): $1,572 · +5.6% YoY. Source: county tax records.
Cash-flow waterfall
monthlySold comps — $/sqft
last 12 mo · ≤1 miLoading sold comps…