33422 192nd Ave SE #64 · Lake Holm, WA
Flood risk 1/10 · Minimal
- FEMA flood zone
- X (unshaded)
- Chance of flooding over 30 yrs
- 0.0%
- Est. flood insurance / yr
- $507 – $1,088
Fire risk 2/10 · Minimal
- Est. fire insurance / yr
- $604 – $1,122
Heat risk 2/10 · Minimal
- Hot days now (above 88°F)
- 7 days/yr
- Hot days in 30 yrs
- 15 days/yr
Wind risk 1/10 · Minimal
- Chance of severe wind over 30 yrs
- —
Air-quality risk 7/10 · Major
- Unhealthy air days now
- 11 days/yr
- Unhealthy air days in 30 yrs
- 12 days/yr
Risk factors via First Street. Map © Google.
Why this score? — see what drove the A- grade
The composite is a weighted blend of 9 inputs, each scored 0–100. Each bar is that input's sub-score; the figure is the points it added to the 100-point composite (weight × sub-score).
- Cash flow +30.0/30.0
- 1% rule +10.0/10.0
- DSCR +10.0/10.0
- Appreciation +10.0/10.0
- ARV discount +7.5/15.0
- Schools +4.7/10.0
- Livability +3.0/5.0
- Condition / age +2.5/5.0
- Rent growth +2.4/5.0
$150,000
🖨 Deal sheet (PDF) 📄 Offer letter ✓ Due diligence
Listing remarks
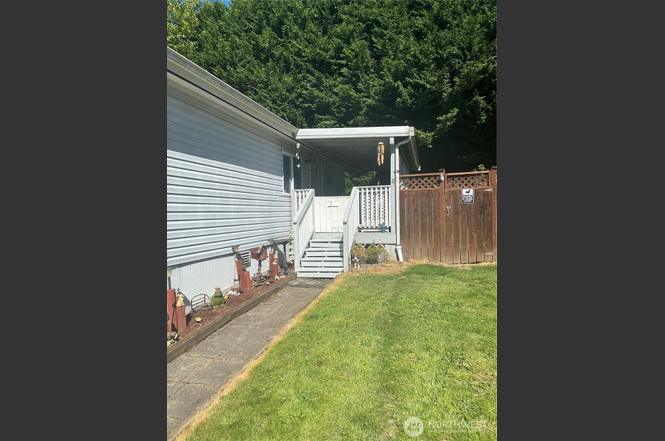
This charming 3-bedroom, 2-bath home offers a spacious yard and numerous upgrades in a nice quiet and rural area off Auburn Black Diamond Road! The home includes energy-efficient vinyl windows throughout. Bright living room and open kitchen W/ an abundance of cabinets and room to entertain. The master bedroom ft. full on-suite bath. ALL NEW water heater, newer roof, fencing, appliances updated pluming (toilets, faucets, W/ D hookup, shower stalls), and new insulation, flooring/subflooring! The exterior features beautiful landscaping with retaining walls, level yard, and garden space. Motion detector floor lights on shed & light sensor for porch. 2nd electrical panel & wired for
Key facts
- Level yard
- Newer roof
- New water heater
Tags
Property features AI
Finance
- Other: Double pane windows (energy efficient feature)
- Financial info: Listing terms: Cash or Conventional; Land lease amount
- HOA & community: Land-lease community (Park Place); Park amenities include playground, recreational area, sidewalks; Manufactured home park approved for sale
Exterior
- Parking: Uncovered parking; 2 open parking spaces
- Utilities: Community/Public water; Electric water heater
- Home design: Manufactured double-wide home; One level; Manufactured after 06/15/1976; Tie-down foundation
- Construction: Metal/vinyl construction materials; Composition roof
- Exterior features: Metal/vinyl exterior; Patio/porch/deck; Landscaped; Walk-in closet (built-in feature listed under home features)
Interior
- Kitchen: Dishwasher; Refrigerator; Stove/Range
- Bedrooms: 3 bedrooms
- Flooring: Laminate flooring
- Bathrooms: 2 full bathrooms; 2 bathtubs; 2 showers; Primary bath with direct access (bath off primary)
- Heating & cooling: Ductless heating; Cooling present (has cooling)
- Interior features: Water heater in closet; Entry, living room, kitchen with eating space, utility room
- Laundry & utility: Utility room
Neighborhood map
What this means for you Summary
Snapshot
- This is a 3-bed/2.0-bath manufactured listed at $150k.
Deal economics
- At list price, monthly cash flow is $952 ($11k/yr) — positive.
- The deal already cash-flows at list — no discount required.
- Meets the 1% rule at list price ($3k rent vs $150k).
- Recommended offer: $136k (9.0% below list) — sets the bar for market timing.
Location & tenants
- Location reads 60/100 on livability (#468 in WA) — a middle-class / working-renter tenant base. Strengths: crime A+, employment A+, housing A+; Watch: amenities F, commute F, cost of living F.
- Auburn School District (urban): math 47% / reading 56% proficiency, ranked #125 of 291 in WA (top 43%) — acceptable for families but not a draw, mixed tenant base, ~2y average lease.
- Market conditions: Rents soft (-0.5%/yr); 291 active listings in the ZIP; high-income renter base; 10,555 units permitted in King County in 2024 (7,119 in 5+ unit buildings).
Forward outlook
- In year one you build about $16k of equity ($1k loan paydown + $15k appreciation (10.0% local appreciation)).
- King County population projected at +44% by 2050 — long-run rental-demand tailwind backs the buy-and-hold thesis.
- At projected returns (10.0% appreciation + 0.0% rent growth), your $42k cash investment doubles in ~2 years — after that, you're playing with house money.
- By year 3, paydown + projected appreciation supports a ~$41k cash-out refi (75% LTV) — recoverable capital for the next deal without selling this one.
Negotiation context
- It's been on market 108 days — a 9% lower offer ($136k) is reasonable based on typical stale-listing flexibility.
- 2 sale attempts since 18y ago; this cycle's ask is 15% above the opening price — seller raised mid-cycle; expect resistance to lowballs.
- Current owner paid $40k; list at $150k implies a 275% gain — meaningful room to come down on a strong offer.
Questions for the listing agent
- It's been on market 108 days. Have you received any prior offers? Is the seller open to a 9% concession, seller financing, or rate buy-down credit?
- Why hasn't it sold? Are there any deal-killer items the seller is aware of (foundation, flood, title, zoning, code violations)?
- Is there a deadline driving the sale (1031 exchange, divorce, estate, relocation)? That informs how much negotiation room exists.
- What's the average days-on-market for RENTAL listings here right now (not sales)? A rising rental-DOM trend means longer vacancies and softer asking-rent achievability than the comps imply.
- What's the recent tenant-quality profile in this submarket — average credit score on applications, eviction rate, late-payment / NSF rate, and stable-employment percentage? A property-management company in the area should have these aggregated.
- How much new for-sale + rental construction is in the pipeline within 1–3 miles? Heavy new supply typically softens prices + rents 12–24 months out; constrained supply supports both.
Investment metrics
- 1% rule
- 1.68% ✓
- Cap rate
- 13.91%
- Cash-on-cash
- 27.19%
- DSCR
- 2.21
- GRM
- 5.0
CMA / ARV
No comps found within radius.
Projected returns pro-forma
10.0% appreciation · 0.0% rent growth · sell at horizon
- IRR
- 43.1%
- Equity multiple
- 4.21×
- Total profit
- $134,964
- Equity at exit
- $135,132
- IRR
- 36.1%
- Equity multiple
- 9.02×
- Total profit
- $336,654
- Equity at exit
- $291,417
Cash invested: $42,000 (down + closing). Projections, not guarantees.
Landlord ↔ Tenant lean methodology
- Overall (STATE)
- 28 Tenant-Leaning
- State Washington
- 28 Tenant-Leaning · D+8
- County
- — inherits STATE
- City
- — inherits STATE
ZIP-level market 98092
- Home prices YoY
- 3.3%
- Rents YoY
- -0.5%
- Active inventory
- 291
- Price-to-rent
- 5.0×
Monthly cashflow live
- Estimated rent
- $2,517 medium interval (Pro) →
- Mortgage (P&I)
- −$787
- Tax est. 1.5%
- −$188 /mo · $2,250/yr
- Insurance
- −$62
- HOA
- −$0
- Vacancy / Maint / Mgmt
- −$529
- Net cashflow
- $952
Break-even live
Sensitivity live
| Price | -10% $1,055 | -5% $1,003 | +0% $952 | +5% $900 | +10% $848 |
|---|---|---|---|---|---|
| Rent | -10% $753 | -5% $852 | +0% $952 | +5% $1,051 | +10% $1,150 |
| Rate | -1.0pp $1,027 | -0.5pp $990 | base $952 | +0.5pp $913 | +1.0pp $873 |
UW: 25.0% down · 7.5% · 30yr · 1.5% tax · 5.0% vac · 8.0% maint · 8.0% mgmt
Financing live
Cash to close
- Down payment
- $37,500
- Closing costs
- $4,500
- Reserves months
- —
- Total cash needed
- —
Loan-product check · same deal, 3 products live
Conventional
25% down · 7.5% · 30yr
- Down + closing
- —
- Monthly P&I
- —
- Monthly cashflow
- —
- DSCR
- —
- Eligible?
- —
Personal DTI + credit; lowest rate.
DSCR
20% down · 8.5% · 30yr
- Down + closing
- —
- Monthly P&I
- —
- Monthly cashflow
- —
- DSCR
- —
- Eligible?
- —
No personal income docs; deal must DSCR.
Hard money
10% down · 12.0% · 12mo
- Down + closing
- —
- Monthly P&I
- —
- Monthly cashflow
- —
- DSCR
- —
- Eligible?
- —
Short-term bridge; refi at stabilization.
Listing history 19 events
-
2026-06-18days on market $150,000 Active 108 DOM
-
2026-06-17days on market $150,000 Active 107 DOM
-
2026-06-16days on market $150,000 Active 106 DOM
-
2026-06-15days on market $150,000 Active 105 DOM
-
2026-06-13days on market $150,000 Active 103 DOM
-
2026-06-13days on market $150,000 Active 102 DOM
-
2026-06-09days on market $150,000 Active 99 DOM
-
2026-06-08days on market $150,000 Active 98 DOM
-
2026-06-07days on market $150,000 Active 97 DOM
-
2026-06-04days on market $150,000 Active 94 DOM
-
2026-06-03days on market $150,000 Active 93 DOM
-
2026-06-02days on market $150,000 Active 92 DOM
-
2026-06-01days on market $150,000 Active 91 DOM
-
2026-05-31days on market $150,000 Active 90 DOM
-
2026-03-02price $150,000
-
2026-03-02$130,000 Active
-
2008-06-23soldstatus $39,950
-
2008-06-06historical
-
2008-03-05$39,950
ⓘ Source: listings_history table (triggers on properties + properties_extension) + one-shot
backfill from property_details.listing_events for pre-trigger history.
Climate risk First Street
- Flood 1/10 Low FEMA zone X (unshaded) · 0% chance over 30 yrs
- Wildfire 2/10 Low
- Heat 2/10 Low 7 d/yr ≥88°F today · 15 d/yr by 30 yrs out
- Wind 1/10 Low
- Air quality 7/10 Severe 11 unhealthy d/yr today · 12 by 30 yrs out
Nearby sold comps map
Loading sold comps map…
Walkable amenities ~0.75 mi
Loading nearby amenities…
Taxation est. · year 1
- Rental income
- $30,201
- − Mortgage interest
- −$8,402
- − Property taxes
- −$2,250
- − Insurance
- −$750
- − Repairs & maintenance
- −$2,416
- − Management
- −$2,416
- − Depreciation
- −$4,364
- Taxable income
- $9,603
- Est. tax owed @ 24.0%
- −$2,305
- After-tax cash flow
- $9,114/yr
For passive investors: Depreciation is non-cash, so a rental often shows a tax loss while cash-flowing — sheltering income. Rental losses are passive: they offset passive income freely, and up to $25,000/yr can offset ordinary (W-2) income if you actively participate and your MAGI is under $100k (phasing out to $0 by $150k); unused losses carry forward. On sale, claimed depreciation is recaptured at up to 25%, and gains may owe capital-gains tax (a 1031 exchange can defer both). Figures are a year-1 estimate at your 24.0% rate — not tax advice; consult a CPA.
Schools (NCES district)
- District
- Auburn School District
- NCES district ID
- 5300300
- Math proficiency
- 47% ▼ -3.00%
- Reading proficiency
- 56% ▼ -1.00%
- Median HH income
- $58,048
- Composite
- 46.73/100
- National rank
- #5240
- State rank
- #125 of 291 in WA
Livability — Lake Holm
- Score
- 60/100
- State rank
- #468
- US rank
- #19289
Category grades
Schools grade is shown separately in the Schools card above.
Census & demographics
- County
- King County · 2,251,916 people
- City population
- 50,510
- Metro
- Seattle-Tacoma-Bellevue, WA
- Population (ZIP)
- 50,224
- Household income
- $122,300
- Rent vs Own
- Severe rent burden
- 1041.0
Population outlook (King County) Hauer SSP2
- Today (2025)
- 2,576,485 people
- By 2030
- 2,803,316 · +8.8%
- By 2040
- 3,255,921 · +26.4%
- By 2050
- 3,706,444 · +43.9%
- By 2075
- 4,746,063 · +84.2%
- By 2100
- 5,407,730 · +109.9%
Race, ethnicity, and origin ACS 2023
- Neighborhood character
- Diverse neighborhood (Simpson 0.66)
- Race & ethnicity
- White 54% Hispanic / Latino 15% Asian 14% Two or more races 13% Native American 4% Black 3% Pacific Islander 2%
- Hispanic origin (detail)
- Mexican 12%
- Common ancestry
- Portuguese 4% Italian 3% Subsaharan African 3%
- Foreign-born
- 20% · Canada, South Korea, Vietnam
- Languages at home
- 73% English-only · Spanish 9% Russian/Polish/Slavic 4% Other Indo-European 3%
Political lean MEDSL · King
- 2024 margin
- Solid D (+51.7) · D 74.2% · R 22.5% · Other 3.4%
- 2008→2024 swing
- +9.6pp toward D · 2008: 42.1pp · 2024: 51.7pp
- All cycles
- 2024: D+51.7 2020: D+52.7 2016: D+50.4 2012: D+39.9 2008: D+42.1
Not yet ingested
- Civics
- —
Market trends
- HPI YoY
- ▲ 49.75%
- Current HPI
- 1554.06
- Rent YoY
- ▼ -0.46%
- Metro
- Seattle-Tacoma-Bellevue, WA
- State GDP YoY
- ▲ 4.65%
- F500 in state
- 22
Industry mix (Fortune 500 HQ in WA)
| Industry | F500 HQs | Revenue |
|---|---|---|
| Retail | 2 | $269B |
|
||
| Technology / Retail | 1 | $638B |
|
||
| Technology | 1 | $245B |
|
||
| Telecommunications | 1 | $38B |
|
||
| Food / Beverage | 1 | $36B |
|
||
| Automotive / Trucks | 1 | $34B |
|
||
Price history
+275.5% since first listed5 events — show timeline
- 2026-03-02 Price Changed $150,000 NWMLS as Distributed by MLS Grid
- 2026-03-02 Listed $130,000 NWMLS as Distributed by MLS Grid
- 2008-06-23 Sold (MLS) $39,950 NWMLS as Distributed by MLS Grid
- 2008-06-06 Delisted — NWMLS as Distributed by MLS Grid
- 2008-03-05 Listed $39,950 NWMLS as Distributed by MLS Grid
Cash-flow waterfall
monthlySold comps — $/sqft
last 12 mo · ≤1 miLoading sold comps…