49 Woodbridge Corner Rd · Sherman, ME
Flood risk No data
- FEMA flood zone
- —
- Chance of flooding over 30 yrs
- —
- Est. flood insurance / yr
- —
Fire risk No data
- Est. fire insurance / yr
- —
Heat risk No data
- Hot days now (above threshold)
- —
- Hot days in 30 yrs
- —
Wind risk No data
- Chance of severe wind over 30 yrs
- —
Air-quality risk No data
- Unhealthy air days now
- —
- Unhealthy air days in 30 yrs
- —
Risk factors via First Street. Map © Google.
Why this score? — see what drove the B+ grade
The composite is a weighted blend of 9 inputs, each scored 0–100. Each bar is that input's sub-score; the figure is the points it added to the 100-point composite (weight × sub-score).
- Cash flow +30.0/30.0
- 1% rule +10.0/10.0
- DSCR +10.0/10.0
- ARV discount +7.5/15.0
- Appreciation +7.4/10.0
- Schools +3.4/10.0
- Rent growth +2.5/5.0
- Livability +2.5/5.0
- Condition / age +2.5/5.0
$34,500
🖨 Deal sheet 📄 Offer letter ✓ Due diligence
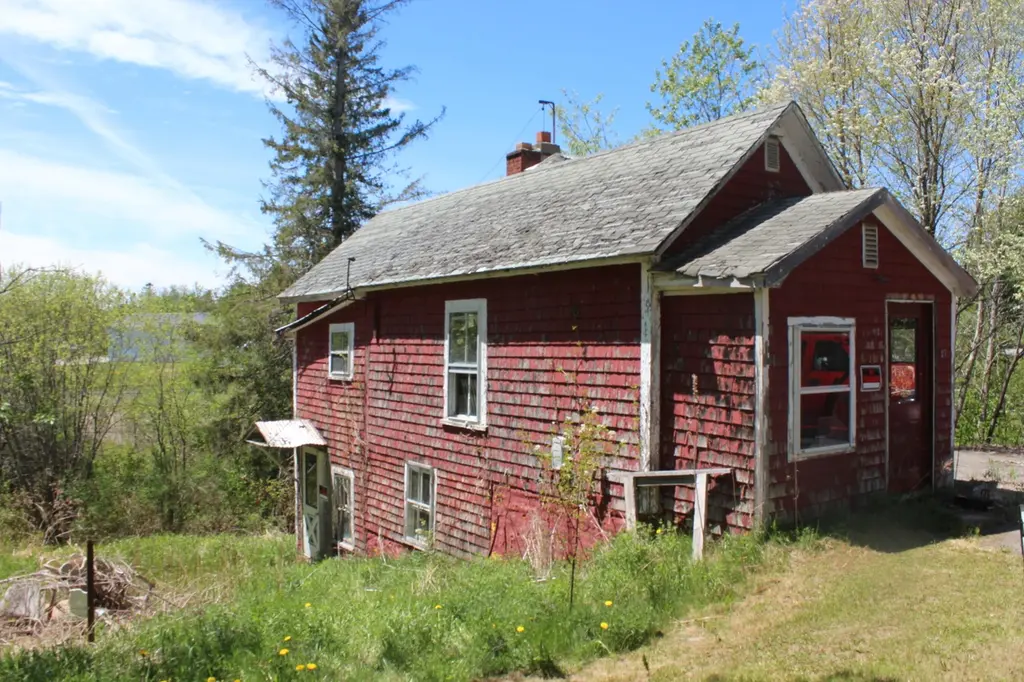
Listing remarks
The house needs some TLC, bathroom and kitchen need work. It is basically gutted !! Plumbing is gone. AS IS . but there is a well and septic and a lot
Key facts
- 0.68 acre lot
- Parking
- Listed 22 days
Property features AI
Exterior
- Parking: Gravel parking with 1–4 spaces
- Utilities: Electric on site; Private water from a well; Private sewer
- Home design: Single family residence; One-story (all main rooms listed on first floor); Property faces per town zoning
- Construction: Wood frame construction with wood siding; Shingle roof; Built in 999
- Exterior features: Near town setting in a neighborhood with a rural feel; Level lot; Paved road access
Interior
- Kitchen: First-floor kitchen
- Bedrooms: One bedroom on the first floor
- Flooring: Wood floors
- Bathrooms: One full bathroom
- Heating & cooling: Has heating
- Interior features: 3 total rooms; Unfinished basement with interior entry; Wood flooring
Neighborhood map
What this means for you Summary
Snapshot
- This is a 1-bed/1.0-bath single-family listed at $34k.
Deal economics
- At list price, monthly cash flow is $422 ($5k/yr) — positive.
- The deal already cash-flows at list — no discount required.
- Meets the 1% rule at list price ($869 rent vs $34k).
- Recommended offer: $34k (1.5% below list) — sets the bar for market timing.
Location & tenants
- Location reads: area grade B — affects rentability + tenant quality, not the cash-flow math above.
- RSU 89 (rural): math 30% / reading 45% proficiency, ranked #136 of 185 in ME (top 74%) — families likely to look elsewhere, expect single-tenant / working-renter base with shorter leases.
- Market conditions: 16 active listings in the ZIP; 112 units permitted in Aroostook County in 2024 (45 in 5+ unit buildings).
Forward outlook
- In year one you build about $2k of equity ($239 loan paydown + $2k appreciation (4.7% local appreciation)).
- Aroostook County population projected at -33% by 2050 — secular population decline; favor cash flow + early exit over multi-decade hold.
- At projected returns (4.7% appreciation + 3.0% rent growth), your $10k cash investment doubles in ~2 years — after that, you're playing with house money.
Negotiation context
- It's been on market 23 days — a 2% lower offer ($34k) is reasonable based on typical stale-listing flexibility.
Questions for the listing agent
- Is there a deadline driving the sale (1031 exchange, divorce, estate, relocation)? That informs how much negotiation room exists.
- What's the average days-on-market for RENTAL listings here right now (not sales)? A rising rental-DOM trend means longer vacancies and softer asking-rent achievability than the comps imply.
- What's the recent tenant-quality profile in this submarket — average credit score on applications, eviction rate, late-payment / NSF rate, and stable-employment percentage? A property-management company in the area should have these aggregated.
- How much new for-sale + rental construction is in the pipeline within 1–3 miles? Heavy new supply typically softens prices + rents 12–24 months out; constrained supply supports both.
Investment metrics
- 1% rule
- 2.52% ✓
- Cap rate
- 20.97%
- Cash-on-cash
- 52.40%
- DSCR
- 3.33
- GRM
- 3.3
CMA / ARV
No comps found within radius.
Projected returns pro-forma
4.72% appreciation · 3.0% rent growth · sell at horizon
- IRR
- 59.5%
- Equity multiple
- 4.55×
- Total profit
- $34,307
- Equity at exit
- $18,975
- IRR
- 57.6%
- Equity multiple
- 9.37×
- Total profit
- $80,807
- Equity at exit
- $32,281
Cash invested: $9,660 (down + closing). Projections, not guarantees.
Landlord ↔ Tenant lean methodology
- Overall (STATE)
- 41 Moderately Tenant-Leaning
- State Maine
- 41 Moderately Tenant-Leaning · D+2
- County
- — inherits STATE
- City
- — inherits STATE
ZIP-level market 04776
- Home prices YoY
- 2.9%
- Active inventory
- 16
- Price-to-rent
- 3.3×
Monthly cashflow live
- Estimated rent
- $869 medium interval (Pro) →
- Mortgage (P&I)
- −$181
- Tax from tax record
- −$69 /mo · $829/yr
- Insurance
- −$14
- HOA
- −$0
- Vacancy / Maint / Mgmt
- −$182
- Net cashflow
- $422
Break-even live
UW: 25.0% down · 7.5% · 30yr · 1.5% tax · 5.0% vac · 8.0% maint · 8.0% mgmt
Financing live
Cash to close
- Down payment
- $8,625
- Closing costs
- $1,035
- Reserves months
- —
- Total cash needed
- —
Loan-product check · same deal, 3 products live
Conventional
25% down · 7.5% · 30yr
- Down + closing
- —
- Monthly P&I
- —
- Monthly cashflow
- —
- DSCR
- —
- Eligible?
- —
Personal DTI + credit; lowest rate.
DSCR
20% down · 8.5% · 30yr
- Down + closing
- —
- Monthly P&I
- —
- Monthly cashflow
- —
- DSCR
- —
- Eligible?
- —
No personal income docs; deal must DSCR.
Hard money
10% down · 12.0% · 12mo
- Down + closing
- —
- Monthly P&I
- —
- Monthly cashflow
- —
- DSCR
- —
- Eligible?
- —
Short-term bridge; refi at stabilization.
Listing history 16 events
-
2026-06-18days on market $34,500 Active 23 DOM
-
2026-06-17days on market $34,500 Active 22 DOM
-
2026-06-16days on market $34,500 Active 21 DOM
-
2026-06-15days on market $34,500 Active 20 DOM
-
2026-06-13days on market $34,500 Active 18 DOM
-
2026-06-12days on market $34,500 Active 17 DOM
-
2026-06-09days on market $34,500 Active 14 DOM
-
2026-06-08days on market $34,500 Active 13 DOM
-
2026-06-07days on market $34,500 Active 12 DOM
-
2026-06-05days on market $34,500 Active 10 DOM
-
2026-06-04days on market $34,500 Active 8 DOM
-
2026-06-02days on market $34,500 Active 7 DOM
-
2026-06-01days on market $34,500 Active 6 DOM
-
2026-05-31days on market $34,500 Active 5 DOM
-
2026-05-31days on market $34,500 Active 4 DOM
-
2026-05-26$34,500 Active
ⓘ Source: listings_history table (triggers on properties + properties_extension) + one-shot
backfill from property_details.listing_events for pre-trigger history.
Tax reassessment forecast ME · Partial reset (capped growth)
- Current annual tax
- $829 · $69/mo
- Projected year-2 tax
- $829 · $69/mo
- Expected delta
- $0/yr ($0/mo · 0.0%)
ⓘ Screening estimate from a state-policy table — verify with the county assessor before closing.
Nearby sold comps map
Loading sold comps map…
Walkable amenities ~0.75 mi
Loading nearby amenities…
Taxation est. · year 1
- Rental income
- $10,424
- − Mortgage interest
- −$1,933
- − Property taxes
- −$829
- − Insurance
- −$172
- − Repairs & maintenance
- −$834
- − Management
- −$834
- − Depreciation
- −$1,004
- Taxable income
- $4,818
- Est. tax owed @ 24.0%
- −$1,156
- After-tax cash flow
- $3,906/yr
For passive investors: Depreciation is non-cash, so a rental often shows a tax loss while cash-flowing — sheltering income. Rental losses are passive: they offset passive income freely, and up to $25,000/yr can offset ordinary (W-2) income if you actively participate and your MAGI is under $100k (phasing out to $0 by $150k); unused losses carry forward. On sale, claimed depreciation is recaptured at up to 25%, and gains may owe capital-gains tax (a 1031 exchange can defer both). Figures are a year-1 estimate at your 24.0% rate — not tax advice; consult a CPA.
Schools (NCES district)
- District
- RSU 89
- NCES district ID
- 2314838
- Math proficiency
- 30% —
- Reading proficiency
- 45% —
- Median HH income
- $36,317
- Composite
- 33.62/100
- National rank
- #10477
- State rank
- #136 of 185 in ME
Livability — Sherman
No livability data for this city. (Only ~50 U.S. cities are tracked.)
Census & demographics
- Population (ZIP)
- 886
Population outlook (Aroostook County) Hauer SSP2
- Today (2025)
- 61,905 people
- By 2030
- 57,815 · -6.6%
- By 2040
- 49,240 · -20.5%
- By 2050
- 41,386 · -33.1%
- By 2075
- 27,664 · -55.3%
- By 2100
- 18,974 · -69.3%
Race, ethnicity, and origin ACS 2023
- Neighborhood character
- Predominantly White (97%)
- Race & ethnicity
- White 97% Two or more races 1%
- Common ancestry
- Polish 11% Lithuanian 10% German 1%
- Foreign-born
- 2% · Canada
- Languages at home
- 76% English-only · German/W. Germanic 22% French/Haitian/Cajun 2% Russian/Polish/Slavic 1%
Political lean MEDSL · Aroostook
- 2024 margin
- Strong R (+26.2) · D 36.2% · R 62.4% · Other 1.4%
- 2008→2024 swing
- -35.8pp toward R · 2008: 9.6pp · 2024: -26.2pp
- All cycles
- 2024: R+26.2 2020: R+19.9 2016: R+17.3 2012: D+7.7 2008: D+9.6
Not yet ingested
- Civics
- —
Market trends
- HPI YoY
- ▲ 4.72%
- Current HPI
- 168.9152
- Rent YoY
- —
- Metro
- —
- State GDP YoY
- —
- F500 in state
- 0
Price history
1 event — show timeline
- 2026-05-26 Listed $34,500 MREIS
Property tax history
+6.8%/yrLatest (2018): $829 · +8.2% YoY. Source: county tax records.
Cash-flow waterfall
monthlySold comps — $/sqft
last 12 mo · ≤1 miLoading sold comps…