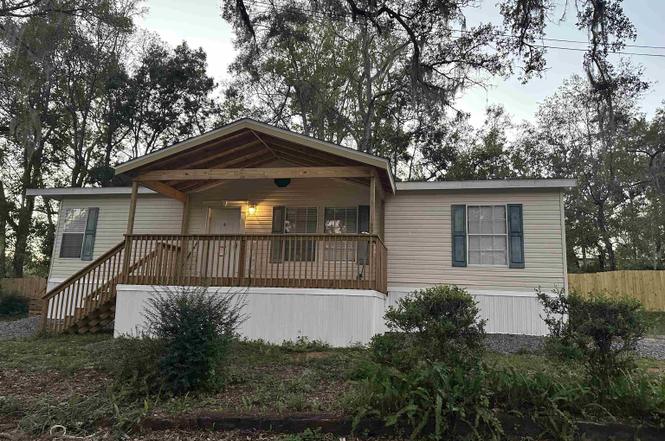
3073 Adkins Forest Ln · Tallahassee, FL
Flood risk 1/10 · Minimal
- FEMA flood zone
- X (unshaded)
- Chance of flooding over 30 yrs
- 0.0%
- Est. flood insurance / yr
- $507 – $1,088
Fire risk 4/10 · Minor
- Est. fire insurance / yr
- $947 – $1,759
Heat risk 8/10 · Major
- Hot days now (above 108°F)
- 7 days/yr
- Hot days in 30 yrs
- 20 days/yr
Wind risk 9/10 · Severe
- Chance of severe wind over 30 yrs
- 99.0%
Air-quality risk 4/10 · Minor
- Unhealthy air days now
- 6 days/yr
- Unhealthy air days in 30 yrs
- 7 days/yr
Risk factors via First Street. Map © Google.
Why this score? — see what drove the B- grade
The composite is a weighted blend of 9 inputs, each scored 0–100. Each bar is that input's sub-score; the figure is the points it added to the 100-point composite (weight × sub-score).
- Cash flow +28.1/30.0
- DSCR +10.0/10.0
- ARV discount +7.5/15.0
- 1% rule +6.4/10.0
- Schools +4.3/10.0
- Livability +4.3/5.0
- Rent growth +3.9/5.0
- Condition / age +2.5/5.0
- Appreciation +0.0/10.0
$158,000
🖨 Deal sheet (PDF) 📄 Offer letter ✓ Due diligence
Listing remarks
Beautiful remodeled mobile home with a large new front porch and side porch, 3BDRM /2bath open kitchen and living room, new appliances and new duct system, new fence on back side of property and new flooring in the kitchen. New roof, all on large high and dry lot. Location less than one mile to Walmart, Sams club, DQ, Dollar Tree, and CVS, just two blocks south of Apalachee Parkway!
Key facts
- New flooring
- New appliances
- New duct system
Tags
Property features AI
Finance
- Financial info: Offered for sale
Exterior
- Parking: Driveway
- Utilities: Septic tank
- Home design: Single-story home; Double wide mobile home
- Construction: Vinyl siding
- Exterior features: Covered porch; Patio/porch; Partial fencing; Lot dimensions 73x115x76x115; Private maintained road (unimproved)
Interior
- Kitchen: Oven; Range; Refrigerator; Icemaker; Dishwasher
- Bedrooms: Bedroom 2 — 11x10; Bedroom 3 — 10x10
- Flooring: Carpet; Engineered hardwood; Vinyl
- Bathrooms: 2 full bathrooms
- Heating & cooling: Central heating; Electric heating; Heat pump; Wood heating; Central air; Ceiling fans
- Interior features: Tray ceilings; Vaulted ceilings; Garden tub / Roman tub; Stall shower; Window treatments; Split bedroom floorplan
- Laundry & utility: Washer; Dryer; Utility room — 12x14
Neighborhood map
What this means for you Summary
Snapshot
- This is a 3-bed/2.0-bath manufactured listed at $158k.
Deal economics
- At list price, monthly cash flow is $498 ($6k/yr) — positive.
- The deal already cash-flows at list — no discount required.
- Meets the 1% rule at list price ($2k rent vs $158k).
- Recommended offer: $139k (12.0% below list) — sets the bar for market timing.
- Cap rate 10.1% vs local median 4.2% in Tallahassee — top-decile yield for the area; either an underpriced asset or a hidden risk that comps aren't pricing in. Stress-test before assuming the spread holds.
Location & tenants
- Location reads 86/100 on livability (#19 in FL, #429 nationally) — a professional / high-income tenant draw. Strengths: amenities A+, commute A+, health & safety A+; Watch: employment D.
- Leon (urban): math 48% / reading 53% proficiency, ranked #33 of 73 in FL (top 45%) — acceptable for families but not a draw, mixed tenant base, ~2y average lease.
- Market conditions: Rents rising fast (+5.5%/yr); 117 active listings in the ZIP; 23 comparable units currently listed for rent nearby; rentals at typical pace (median 22d on market — plan ~3-4 weeks tenant-placement turnaround); solid renter incomes; 1,765 units permitted in Leon County in 2024 (975 in 5+ unit buildings).
Forward outlook
- Local home prices are declining (-3.0%/yr); year-one equity from $1k of loan paydown is wiped out by about $5k of value loss. Plan a longer hold.
- Leon County population projected at +23% by 2050 — long-run rental-demand tailwind backs the buy-and-hold thesis.
- At projected returns (-3.0% appreciation + 5.5% rent growth), your $44k cash investment doubles in ~8 years — after that, you're playing with house money.
Negotiation context
- It's been on market 141 days — a 12% lower offer ($139k) is reasonable based on typical stale-listing flexibility.
- 3 sale attempts since 2y ago with the ask held roughly flat each time — persistent listings suggest the price (not the market) is what's stuck; bring a comps-based counter.
- Current owner paid $16k; list at $158k implies a 858% gain — meaningful room to come down on a strong offer.
Risks & watch-outs
- Climate carrying-cost: severe wind risk, 99% chance of damaging wind over 30y; extreme-heat days projected 7→20/yr by 2055 (HVAC capex compounding) — expect insurance premiums to compound above CPI over the hold.
Questions for the listing agent
- It's been on market 141 days. Have you received any prior offers? Is the seller open to a 12% concession, seller financing, or rate buy-down credit?
- Why hasn't it sold? Are there any deal-killer items the seller is aware of (foundation, flood, title, zoning, code violations)?
- Is there a deadline driving the sale (1031 exchange, divorce, estate, relocation)? That informs how much negotiation room exists.
- Schools are B-rated — typically a magnet for longer-tenancy family renters. What's the average tenant stay here, and is there a school-zone premium baked into asking?
- What's the average days-on-market for RENTAL listings here right now (not sales)? A rising rental-DOM trend means longer vacancies and softer asking-rent achievability than the comps imply.
- What's the recent tenant-quality profile in this submarket — average credit score on applications, eviction rate, late-payment / NSF rate, and stable-employment percentage? A property-management company in the area should have these aggregated.
- How much new for-sale + rental construction is in the pipeline within 1–3 miles? Heavy new supply typically softens prices + rents 12–24 months out; constrained supply supports both.
Investment metrics
- 1% rule
- 1.14% ✓
- Cap rate
- 10.08%
- Cash-on-cash
- 13.52%
- DSCR
- 1.60
- GRM
- 7.3
CMA / ARV
- ARV (on-the-fly)
- $101,080
- Comps found
- 1
Show comp detail 1 sale within ~0.75 mi
| Address | Dist | Beds/Ba | Sqft | Sold | Price | $/sf | Match |
|---|---|---|---|---|---|---|---|
| 3297 Connie Dr | 0.24mi | 3/2.0 | 1,056 (-1%) | 8mo | $100,000 | $95 | 81 |
Match score weights: distance 35% · size 25% · config 20% · recency 20%. Top-matched comps best support the ARV.
Projected returns pro-forma
-3.0% appreciation · 5.55% rent growth · sell at horizon
- IRR
- 6.1%
- Equity multiple
- 1.24×
- Total profit
- $10,797
- Equity at exit
- $23,558
- IRR
- 17.4%
- Equity multiple
- 2.59×
- Total profit
- $70,447
- Equity at exit
- $13,661
Cash invested: $44,240 (down + closing). Projections, not guarantees.
Landlord ↔ Tenant lean methodology
- Overall (STATE)
- 87 Strongly Landlord-Friendly
- State Florida
- 87 Strongly Landlord-Friendly · R+3
- County
- — inherits STATE
- City
- — inherits STATE
ZIP-level market 32311
- Home prices YoY
- -27.5%
- Rents YoY
- 5.5%
- Active inventory
- 117
- Price-to-rent
- 7.3×
Monthly cashflow live
- Estimated rent
- $1,801 high interval (Pro) →
- Mortgage (P&I)
- −$829
- Tax from tax record
- −$30 /mo · $359/yr
- Insurance
- −$66
- HOA
- −$0
- Vacancy / Maint / Mgmt
- −$378
- Net cashflow
- $498
Break-even live
Sensitivity live
| Price | -10% $588 | -5% $543 | +0% $498 | +5% $454 | +10% $409 |
|---|---|---|---|---|---|
| Rent | -10% $356 | -5% $427 | +0% $498 | +5% $569 | +10% $641 |
| Rate | -1.0pp $578 | -0.5pp $539 | base $498 | +0.5pp $457 | +1.0pp $416 |
UW: 25.0% down · 7.5% · 30yr · 1.5% tax · 5.0% vac · 8.0% maint · 8.0% mgmt
Financing live
Cash to close
- Down payment
- $39,500
- Closing costs
- $4,740
- Reserves months
- —
- Total cash needed
- —
Loan-product check · same deal, 3 products live
Conventional
25% down · 7.5% · 30yr
- Down + closing
- —
- Monthly P&I
- —
- Monthly cashflow
- —
- DSCR
- —
- Eligible?
- —
Personal DTI + credit; lowest rate.
DSCR
20% down · 8.5% · 30yr
- Down + closing
- —
- Monthly P&I
- —
- Monthly cashflow
- —
- DSCR
- —
- Eligible?
- —
No personal income docs; deal must DSCR.
Hard money
10% down · 12.0% · 12mo
- Down + closing
- —
- Monthly P&I
- —
- Monthly cashflow
- —
- DSCR
- —
- Eligible?
- —
Short-term bridge; refi at stabilization.
Rent comps 23 comps
| Address | Beds | Baths | Sqft | Rent | $/sqft | DOM | Units | Dist |
|---|---|---|---|---|---|---|---|---|
| 1736 Augustine Pl Tallahassee, FL | 3.0 | 2.0 | 1400 | $2,000 | $1.43 | 21d | 1 | 0.29mi |
| 2750 Old Saint Augustine Rd Tallahassee, FL | 1.0–3.0 | 1.0–2.0 | 1230 | $1,739 | $1.41 | 21d | 2 | 0.38mi |
| 3373 Apalachee Pkwy Tallahassee, FL | 1.0–2.0 | 1.0–2.0 | 779 | $1,258 | $1.61 | 14d | 1 | 0.54mi |
| 2250 Bluff Oak Way Tallahassee, FL | 1.0–3.0 | 1.0–2.0 | 1538 | $1,978 | $1.29 | 14d | 17 | 0.56mi |
| 3148 Dick Wilson Blvd Tallahassee, FL | 1.0–3.0 | 1.0–2.0 | 1536 | $1,940 | $1.26 | 14d | 14 | 0.69mi |
| 2074 Midyette Rd Tallahassee, FL | 2.0–3.0 | 2.0 | 1033 | $1,346 | $1.30 | 14d | 1 | 0.76mi |
| 2902 Battle Mountain Rd Tallahassee, FL | 2.0 | 2.0 | 1160 | $1,324 | $1.14 | 21d | 4 | 0.82mi |
| 1515 Paul Russell Rd #85 Tallahassee, FL | 3.0 | 2.5 | 1482 | $1,400 | $0.94 | 21d | 1 | 1.02mi |
| 430 Grail Ct Tallahassee, FL | 3.0 | 2.0 | 1252 | $2,300 | $1.84 | 21d | 1 | 1.05mi |
| 1572 Keily Run Unit 1572 Tallahassee, FL | 2.0 | 2.0 | 1200 | $1,250 | $1.04 | 21d | 1 | 1.09mi |
| 1942 Darryl Dr Unit 1 Tallahassee, FL | 2.0 | 2.0 | 1200 | $2,300 | $1.92 | 21d | 1 | 1.15mi |
| 2001 Old Saint Augustine Rd Tallahassee, FL | 1.0–2.0 | 1.0–2.0 | 875 | $1,436 | $1.64 | 14d | 11 | 1.18mi |
| 432 Merlin Way Tallahassee, FL | 3.0 | 2.0 | 1453 | $2,150 | $1.48 | 21d | 1 | 1.19mi |
| 1872 Darryl Dr Tallahassee, FL | 2.0 | 2.0 | 1062 | $1,500 | $1.41 | 21d | 1 | 1.20mi |
| 2400 Barcelona Ct Tallahassee, FL | 3.0 | 2.0 | 1080 | $1,600 | $1.48 | 14d | 1 | 1.25mi |
| 3909 Reserve Dr Tallahassee, FL | 1.0–3.0 | 1.0–2.0 | 1220 | $1,825 | $1.50 | 14d | 1 | 1.28mi |
| 3550 Esplanade Way Tallahassee, FL | 1.0–3.0 | 1.0–2.0 | 1031 | $2,028 | $1.97 | 14d | 27 | 1.29mi |
| 2221 Orange Ave E Tallahassee, FL | 1.0–3.0 | 1.0–2.0 | 1007 | $2,234 | $2.22 | 14d | 28 | 1.29mi |
| 2729 Blair stone Ln Unit 1 Tallahassee, FL | 3.0 | 1.5 | 1280 | $1,550 | $1.21 | 21d | 1 | 1.32mi |
| 2912 Capital Park Dr Tallahassee, FL | 3.0 | 2.0 | 1236 | $1,650 | $1.33 | 14d | 1 | 1.39mi |
| 501 S Blair Stone Rd Tallahassee, FL | 1.0–3.0 | 1.0–2.0 | 1080 | $1,605 | $1.49 | 21d | 1 | 1.41mi |
| 599 Chicopee Ct Unit D Tallahassee, FL | 2.0 | 1.0 | 900 | $1,095 | $1.22 | 21d | 1 | 1.43mi |
| 581 Holyoke Ct Apt C Tallahassee, FL | 2.0 | 1.0 | 995 | $1,125 | $1.13 | 21d | 1 | 1.47mi |
Listing history 23 events
-
2026-06-18days on market $158,000 Active 141 DOM
-
2026-06-17days on market $158,000 Active 140 DOM
-
2026-06-16days on market $158,000 Active 139 DOM
-
2026-06-15days on market $158,000 Active 138 DOM
-
2026-06-14days on market $158,000 Active 136 DOM
-
2026-06-10days on market $158,000 Active 133 DOM
-
2026-06-09days on market $158,000 Active 132 DOM
-
2026-06-08days on market $158,000 Active 131 DOM
-
2026-06-07days on market $158,000 Active 130 DOM
-
2026-06-05days on market $158,000 Active 127 DOM
-
2026-06-03days on market $158,000 Active 126 DOM
-
2026-06-02days on market $158,000 Active 125 DOM
-
2026-06-01days on market $158,000 Active 124 DOM
-
2026-05-31days on market $158,000 Active 123 DOM
-
2026-05-30days on market $158,000 Active 122 DOM
-
2026-01-29$158,000 Active
-
2026-01-24historical
-
2025-07-23$163,000 Active
-
2025-07-01historical
-
2024-12-03price $158,000
-
2024-11-22$168,000 Active
-
2007-04-03soldstatus $16,500
-
2007-04-03soldstatus $16,500
ⓘ Source: listings_history table (triggers on properties + properties_extension) + one-shot
backfill from property_details.listing_events for pre-trigger history.
Tax reassessment forecast FL · Resets to sale price
- Current annual tax
- $359 · $30/mo
- Projected year-2 tax
- $1,311 · $109/mo
- Expected delta
- +$953/yr (+$79/mo · 265.7%)
ⓘ Screening estimate from a state-policy table — verify with the county assessor before closing.
Climate risk First Street
- Flood 1/10 Low FEMA zone X (unshaded) · 0% chance over 30 yrs
- Wildfire 4/10 Moderate
- Heat 8/10 Severe 7 d/yr ≥108°F today · 20 d/yr by 30 yrs out
- Wind 9/10 Extreme 99% chance of damaging wind over 30 yrs
- Air quality 4/10 Moderate 6 unhealthy d/yr today · 7 by 30 yrs out
Nearby sold comps map
Loading sold comps map…
Walkable amenities ~0.75 mi
Loading nearby amenities…
Taxation est. · year 1
- Rental income
- $21,609
- − Mortgage interest
- −$8,850
- − Property taxes
- −$359
- − Insurance
- −$790
- − Repairs & maintenance
- −$1,729
- − Management
- −$1,729
- − Depreciation
- −$4,596
- Taxable income
- $3,556
- Est. tax owed @ 24.0%
- −$854
- After-tax cash flow
- $5,126/yr
For passive investors: Depreciation is non-cash, so a rental often shows a tax loss while cash-flowing — sheltering income. Rental losses are passive: they offset passive income freely, and up to $25,000/yr can offset ordinary (W-2) income if you actively participate and your MAGI is under $100k (phasing out to $0 by $150k); unused losses carry forward. On sale, claimed depreciation is recaptured at up to 25%, and gains may owe capital-gains tax (a 1031 exchange can defer both). Figures are a year-1 estimate at your 24.0% rate — not tax advice; consult a CPA.
Schools (NCES district)
- District
- Leon
- NCES district ID
- 1201110
- Math proficiency
- 48% ▼ -13.00%
- Reading proficiency
- 53% ▼ -5.00%
- Median HH income
- $46,339
- Composite
- 42.84/100
- National rank
- #3131
- State rank
- #33 of 73 in FL
Livability — Tallahassee
- Score
- 86/100
- State rank
- #19
- US rank
- #429
Category grades
Schools grade is shown separately in the Schools card above.
Census & demographics
- Census place
- Tallahassee, FL
- County
- Leon County · 294,472 people
- City population
- 294,472
- Metro
- Tallahassee, FL
- Population (ZIP)
- 21,905
- Household income
- $81,243
- Rent vs Own
- Severe rent burden
- 795.0
Population outlook (Leon County) Hauer SSP2
- Today (2025)
- 315,507 people
- By 2030
- 330,677 · +4.8%
- By 2040
- 358,465 · +13.6%
- By 2050
- 386,804 · +22.6%
- By 2075
- 465,480 · +47.5%
- By 2100
- 519,959 · +64.8%
Race, ethnicity, and origin ACS 2023
- Neighborhood character
- Diverse neighborhood (Simpson 0.64)
- Race & ethnicity
- White 52% Black 27% Two or more races 10% Hispanic / Latino 9% Asian 6%
- Hispanic origin (detail)
- Mexican 2% Puerto Rican 1% Cuban 1%
- Common ancestry
- Romanian 2% Serbian 2% Slovak 2%
- Foreign-born
- 11% · Canada, Jamaica
- Languages at home
- 86% English-only · Spanish 6% Other Indo-European 3% Other Asian/Pacific 2%
Political lean MEDSL · Leon
- 2024 margin
- Strong D (+21.8) · D 60.3% · R 38.5% · Other 1.2%
- 2008→2024 swing
- -2.5pp toward R · 2008: 24.3pp · 2024: 21.8pp
- All cycles
- 2024: D+21.8 2020: D+28.3 2016: D+25.1 2012: D+23.6 2008: D+24.3
Not yet ingested
- Civics
- —
Market trends
- HPI YoY
- ▼ -90.68%
- Current HPI
- 238.8804
- Rent YoY
- ▲ 5.55%
- Metro
- Tallahassee, FL
- State GDP YoY
- ▲ 3.28%
- F500 in state
- 36
Industry mix (Fortune 500 HQ in FL)
| Industry | F500 HQs | Revenue |
|---|---|---|
| Industrial Technology | 2 | $29B |
|
||
| Insurance | 2 | $17B |
|
||
| Retail | 1 | $60B |
|
||
| Technology Distribution | 1 | $58B |
|
||
| Homebuilding | 1 | $35B |
|
||
| Technology Manufacturing | 1 | $35B |
|
||
Price history
+857.6% since first listed8 events — show timeline
- 2026-01-29 Listed $158,000 CATRS
- 2026-01-24 Listing Removed — CATRS
- 2025-07-23 Listed $163,000 CATRS
- 2025-07-01 Listing Removed — CATRS
- 2024-12-03 Price Changed $158,000 CATRS
- 2024-11-22 Listed $168,000 CATRS
- 2007-04-03 Sold (Public Records) $16,500 Public Records
- 2007-04-03 Sold (Public Records) $16,500 Public Records
Property tax history
+1.8%/yrLatest (2025): $359 · +15.3% YoY. Source: county tax records.
Cash-flow waterfall
monthlySold comps — $/sqft
last 12 mo · ≤1 miLoading sold comps…