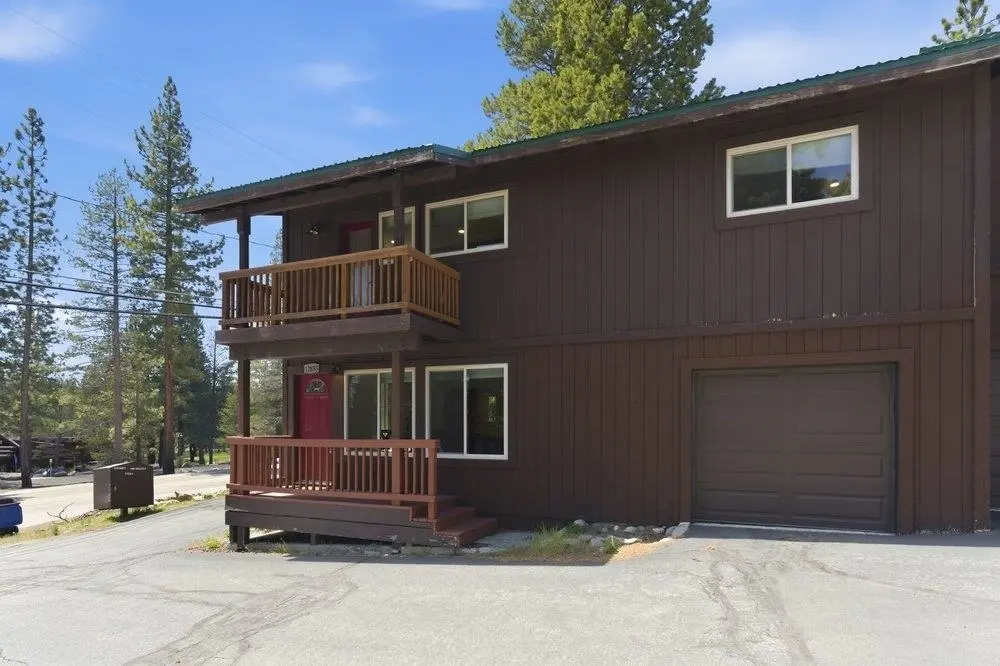
12835 Northwoods Blvd · Truckee, CA
Flood risk 1/10 · Minimal
- FEMA flood zone
- X (unshaded)
- Chance of flooding over 30 yrs
- 0.0%
- Est. flood insurance / yr
- $507 – $1,088
Fire risk 7/10 · Major
- Est. fire insurance / yr
- $659 – $1,223
Heat risk 1/10 · Minimal
- Hot days now (above 85°F)
- 9 days/yr
- Hot days in 30 yrs
- 23 days/yr
Wind risk 1/10 · Minimal
- Chance of severe wind over 30 yrs
- —
Air-quality risk 8/10 · Major
- Unhealthy air days now
- 14 days/yr
- Unhealthy air days in 30 yrs
- 17 days/yr
Risk factors via First Street. Map © Google.
Why this score? — see what drove the D+ grade
The composite is a weighted blend of 9 inputs, each scored 0–100. Each bar is that input's sub-score; the figure is the points it added to the 100-point composite (weight × sub-score).
- ARV discount +15.0/15.0
- Cash flow +10.9/30.0
- Schools +4.4/10.0
- Rent growth +4.1/5.0
- 1% rule +3.6/10.0
- DSCR +3.2/10.0
- Livability +2.9/5.0
- Condition / age +2.5/5.0
- Appreciation +0.0/10.0
$529,000
🖨 Deal sheet (PDF) 📄 Offer letter ✓ Due diligence
Listing remarks
Welcome to your new home! This lovely 4-bedroom, 2-bathroom condo, complete with an attached one-car garage, is situated in the heart of Tahoe Donner. The downstairs area features a kitchen, living room, and dining space, along with a full bathroom and convenient access to the garage. Upstairs, you'll find four generously sized bedrooms and another full bathroom. The bathrooms have both been updated with tile showers and exhaust fans. Newer floors in the living room. One of the bedrooms also includes a private deck. This fantastic condo offers easy access to the golf course, The Lodge restaurant, Z's market, and the recreation pools and fitness center. Best of all, this unit comes fully fur
Key facts
- Private deck
- Recreation pools
- Fitness center
Tags
Property features AI
Finance
- HOA & community: HOA with annual fee; Association amenities include beach access, pool, tennis courts, golf course, equestrian center, cross-country skiing, downhill skiing, exercise equipment, and boat ramp
Exterior
- Parking: Attached garage with 1 covered space
- Utilities: Water from utility district; Sewer to utility district; Natural gas available
- Home design: Condo/Townhome/PUD; Two-story
- Construction: Metal roof
- Exterior features: Two decks; Street access; Level topography
Interior
- Kitchen: Range; Oven; Microwave; Dishwasher; Garbage disposal; Refrigerator
- Flooring: Carpet; Mixed flooring; Tile
- Bathrooms: 2 full bathrooms
- Heating & cooling: Electric heating
- Interior features: Mountain architectural style; Two levels
- Laundry & utility: Washer; Dryer; Laundry located in garage
Neighborhood map
What this means for you Summary
Snapshot
- This is a 3-bed/2.0-bath condo listed at $529k.
Deal economics
- At list price, monthly cash flow is $-232 ($-3k/yr) — negative.
- To cash-flow at today's rent, offer at most $488k (7.7% below list).
- To meet the 1% rule (rent ≥ 1% of price), the offer needs to be $456k (13.8% below list).
- Recommended offer: $456k (13.8% below list) — sets the bar for 1% rule.
- Cap rate 5.8% vs local median 2.0% in Truckee — top-decile yield for the area; either an underpriced asset or a hidden risk that comps aren't pricing in. Stress-test before assuming the spread holds.
Location & tenants
- Location reads 58/100 on livability (#697 in CA) — a working-class tenant base; expect higher turnover. Strengths: employment A+, housing B; Watch: amenities F, commute F, cost of living F.
- Tahoe-Truckee Unified (town): math 44% / reading 56% proficiency, ranked #136 of 517 in CA (top 26%) — acceptable for families but not a draw, mixed tenant base, ~2y average lease.
- Market conditions: Rents rising fast (+6.6%/yr); 381 active listings in the ZIP; 5 comparable units currently listed for rent nearby; rentals at typical pace (median 23d on market — plan ~3-4 weeks tenant-placement turnaround); high-income renter base; 215 units permitted in Nevada County in 2024 (0 in 5+ unit buildings).
- This rent runs 42% of the median local income ($132k/yr) — at the standard rent-burdened threshold; future hikes will face affordability resistance.
Forward outlook
- Local home prices are declining (-3.0%/yr); year-one equity from $4k of loan paydown is wiped out by about $16k of value loss. Plan a longer hold.
- Nevada County population projected at -14% by 2050 — secular population decline; favor cash flow + early exit over multi-decade hold.
Negotiation context
- It's been on market 44 days — a 3% lower offer ($513k) is reasonable based on typical stale-listing flexibility.
- 4 sale attempts since 8y ago; this cycle's ask has dropped $40k (7%) from the opening price — seller is motivated, your offer sets the floor, not the list.
- Current owner paid $393k; 35% above their basis — modest negotiation headroom, anchor on the comps not their cost.
Risks & watch-outs
- Climate carrying-cost: major wildfire risk — expect insurance premiums to compound above CPI over the hold.
Questions for the listing agent
- What do current leases actually rent for vs. the listed asking? Can we see a recent rent roll and the last 12 months of T-12 income?
- It's been on market 44 days. Have you received any prior offers? Is the seller open to a 14% concession, seller financing, or rate buy-down credit?
- Built in 1979 — when were the roof, HVAC, electrical panel, plumbing, and water heater last replaced?
- What does the HOA fee cover, when was the last increase, and are there any pending special assessments or reserve-fund shortfalls?
- Any open or pending special assessments — roof, HVAC, plumbing, elevator, façade? What's the per-unit balance and payoff schedule, and is the seller paying it off at close or rolling it to the buyer?
- Is there a deadline driving the sale (1031 exchange, divorce, estate, relocation)? That informs how much negotiation room exists.
- The area grade is low — what's the realistic commute time and amenity access for the typical tenant pool here? Any planned neighborhood developments (good or bad) we should know about?
- What's the average days-on-market for RENTAL listings here right now (not sales)? A rising rental-DOM trend means longer vacancies and softer asking-rent achievability than the comps imply.
- What's the recent tenant-quality profile in this submarket — average credit score on applications, eviction rate, late-payment / NSF rate, and stable-employment percentage? A property-management company in the area should have these aggregated.
- How much new apartment / multifamily construction is in the pipeline within 1–3 miles? Heavy new supply (>2% of stock underway) typically softens rents 12–24 months out; light construction supports rent growth.
Investment metrics
- 1% rule
- 0.86% ✗
- Cap rate
- 5.77%
- Cash-on-cash
- -1.88%
- DSCR
- 0.92
- GRM
- 9.7
CMA / ARV
- ARV (median comp)
- $666,032
- List price
- $529,000
- Delta
- -20.57%
- Verdict
- UNDERPRICED
- Comps
- 17 within 1.0 mi
Projected returns pro-forma
-3.0% appreciation · 6.59% rent growth · sell at horizon
- IRR
- -15.2%
- Equity multiple
- 0.44×
- Total profit
- $-83,232
- Equity at exit
- $78,876
- IRR
- -1.3%
- Equity multiple
- 0.90×
- Total profit
- $-15,364
- Equity at exit
- $45,738
Cash invested: $148,120 (down + closing). Projections, not guarantees.
Landlord ↔ Tenant lean methodology
- Overall (STATE)
- 18 Strongly Tenant-Friendly
- State California
- 18 Strongly Tenant-Friendly · D+13
- County
- — inherits STATE
- City
- — inherits STATE
ZIP-level market 96161
- Rents YoY
- 6.6%
- Active inventory
- 381
- Price-to-rent
- 9.7×
Monthly cashflow live
- Estimated rent
- $4,559 high interval (Pro) →
- Mortgage (P&I)
- −$2,774
- Tax from tax record
- −$537 /mo · $6,441/yr
- Insurance
- −$220
- HOA
- −$302
- Vacancy / Maint / Mgmt
- −$957
- Net cashflow
- $-232
Break-even live
Sensitivity live
| Price | -10% $68 | -5% $-82 | +0% $-232 | +5% $-381 | +10% $-531 |
|---|---|---|---|---|---|
| Rent | -10% $-592 | -5% $-412 | +0% $-232 | +5% $-51 | +10% $129 |
| Rate | -1.0pp $35 | -0.5pp $-97 | base $-232 | +0.5pp $-369 | +1.0pp $-508 |
UW: 25.0% down · 7.5% · 30yr · 1.5% tax · 5.0% vac · 8.0% maint · 8.0% mgmt
Financing live
Cash to close
- Down payment
- $132,250
- Closing costs
- $15,870
- Reserves months
- —
- Total cash needed
- —
Loan-product check · same deal, 3 products live
Conventional
25% down · 7.5% · 30yr
- Down + closing
- —
- Monthly P&I
- —
- Monthly cashflow
- —
- DSCR
- —
- Eligible?
- —
Personal DTI + credit; lowest rate.
DSCR
20% down · 8.5% · 30yr
- Down + closing
- —
- Monthly P&I
- —
- Monthly cashflow
- —
- DSCR
- —
- Eligible?
- —
No personal income docs; deal must DSCR.
Hard money
10% down · 12.0% · 12mo
- Down + closing
- —
- Monthly P&I
- —
- Monthly cashflow
- —
- DSCR
- —
- Eligible?
- —
Short-term bridge; refi at stabilization.
Rent comps 5 comps
| Address | Beds | Baths | Sqft | Rent | $/sqft | DOM | Units | Dist |
|---|---|---|---|---|---|---|---|---|
| 12803 Northwoods Blvd Truckee, CA | 3.0 | 2.0 | 1649 | $4,100 | $2.49 | 15d | 1 | 0.06mi |
| 11641 Zermatt Dr Truckee, CA | 3.0 | 2.0 | 1865 | $3,999 | $2.14 | 22d | 1 | 0.66mi |
| 11608 Chamonix Rd Truckee, CA | 3.0 | 2.0 | 1321 | $3,300 | $2.50 | 22d | 1 | 0.82mi |
| 14474 Northwoods Blvd Unit 1546202P Truckee, CA | 3.0 | 2.0 | 1646 | $6,451 | $3.92 | 15d | 1 | 1.01mi |
| 12640 Zurich Pl Truckee, CA | 2.0 | 2.0 | 1060 | $2,995 | $2.83 | 45d | 1 | 1.20mi |
HOA detail condo
- Monthly dues
- $302 · $3,624/yr
- Likely covers
- poolgym
- Assessments
- None detected in remarks — confirm with the listing agent.
Listing history 33 events
-
2026-06-21days on market $529,000 Active 44 DOM
-
2026-06-18days on market $529,000 Active 41 DOM
-
2026-06-17days on market $529,000 Active 40 DOM
-
2026-06-16days on market $529,000 Active 39 DOM
-
2026-06-15days on market $529,000 Active 38 DOM
-
2026-06-14days on market $529,000 Active 36 DOM
-
2026-06-10days on market $529,000 Active 33 DOM
-
2026-06-09days on market $529,000 Active 32 DOM
-
2026-06-08days on market $529,000 Active 31 DOM
-
2026-06-07pricedays on market $529,000 Active 30 DOM
-
2026-06-05days on market $569,000 Active 27 DOM
-
2026-06-03days on market $569,000 Active 26 DOM
-
2026-06-02days on market $569,000 Active 25 DOM
-
2026-06-01days on market $569,000 Active 24 DOM
-
2026-05-31days on market $569,000 Active 23 DOM
-
2026-05-30days on market $569,000 Active 22 DOM
-
2026-05-08$569,000 Active 792-char remark
-
2025-10-16historical $2,900
-
2025-09-04$2,900
-
2025-08-24historical $2,900
-
2025-07-15$2,900
-
2024-11-08price $549,000
-
2024-09-21price $589,000
-
2024-08-02price $599,000
-
2023-10-13price $639,900
-
2023-09-03price $648,000
-
2019-02-25soldstatus $393,000 Sold
-
2019-02-21soldstatus $393,000
-
2019-01-24status Pending
-
2019-01-19price $398,000
-
2018-10-17price $388,000
-
2018-09-24$399,000 Active
-
2017-11-07soldstatus $900,000
ⓘ Source: listings_history table (triggers on properties + properties_extension) + one-shot
backfill from property_details.listing_events for pre-trigger history.
Tax reassessment forecast CA · Resets to sale price
- Current annual tax
- $6,441 · $537/mo
- Projected year-2 tax
- $6,441 · $537/mo
- Expected delta
- $0/yr ($0/mo · 0.0%)
ⓘ Screening estimate from a state-policy table — verify with the county assessor before closing.
Climate risk First Street
- Flood 1/10 Low FEMA zone X (unshaded) · 0% chance over 30 yrs
- Wildfire 7/10 Severe
- Heat 1/10 Low 9 d/yr ≥85°F today · 23 d/yr by 30 yrs out
- Wind 1/10 Low
- Air quality 8/10 Severe 14 unhealthy d/yr today · 17 by 30 yrs out
Nearby sold comps map
Loading sold comps map…
Walkable amenities ~0.75 mi
Loading nearby amenities…
Taxation est. · year 1
- Rental income
- $54,709
- − Mortgage interest
- −$29,632
- − Property taxes
- −$6,441
- − Insurance
- −$2,645
- − Repairs & maintenance
- −$4,377
- − Management
- −$4,377
- − HOA
- −$3,624
- − Depreciation
- −$15,389
- Taxable loss
- −$11,775
- Est. tax savings @ 24.0%
- +$2,826
- After-tax cash flow
- $47/yr
For passive investors: Depreciation is non-cash, so a rental often shows a tax loss while cash-flowing — sheltering income. Rental losses are passive: they offset passive income freely, and up to $25,000/yr can offset ordinary (W-2) income if you actively participate and your MAGI is under $100k (phasing out to $0 by $150k); unused losses carry forward. On sale, claimed depreciation is recaptured at up to 25%, and gains may owe capital-gains tax (a 1031 exchange can defer both). Figures are a year-1 estimate at your 24.0% rate — not tax advice; consult a CPA.
Schools (NCES district)
- District
- Tahoe-Truckee Unified
- NCES district ID
- 0638770
- Math proficiency
- 44% ▼ -9.00%
- Reading proficiency
- 56% ▼ -4.00%
- Median HH income
- $67,136
- Composite
- 44.38/100
- National rank
- #2816
- State rank
- #136 of 517 in CA
Livability — Truckee
- Score
- 58/100
- State rank
- #697
- US rank
- #21110
Category grades
Schools grade is shown separately in the Schools card above.
Census & demographics
- Census place
- Truckee, CA
- County
- Nevada County · 85,339 people
- City population
- 19,634
- Metro
- Truckee-Grass Valley, CA
- Population (ZIP)
- 19,634
- Household income
- $131,702
- Rent vs Own
- Severe rent burden
- 559.0
Population outlook (Nevada County) Hauer SSP2
- Today (2025)
- 98,490 people
- By 2030
- 97,295 · -1.2%
- By 2040
- 92,041 · -6.5%
- By 2050
- 85,164 · -13.5%
- By 2075
- 68,436 · -30.5%
- By 2100
- 49,536 · -49.7%
Race, ethnicity, and origin ACS 2023
- Neighborhood character
- Predominantly White (81%)
- Race & ethnicity
- White 81% Hispanic / Latino 12% Two or more races 11% Asian 2%
- Hispanic origin (detail)
- Mexican 7%
- Common ancestry
- Italian 5% Lithuanian 4% Portuguese 3%
- Foreign-born
- 10% · Canada, Jamaica, Dominican Republic
- Languages at home
- 85% English-only · Spanish 10% French/Haitian/Cajun 1% Other Indo-European 1%
Political lean MEDSL · Nevada
- 2024 margin
- D (+12.2) · D 54.4% · R 42.1% · Other 3.5%
- 2008→2024 swing
- +6.9pp toward D · 2008: 5.3pp · 2024: 12.2pp
- All cycles
- 2024: D+12.2 2020: D+14.8 2016: D+4.5 2012: R+4.7 2008: D+5.3
Not yet ingested
- Civics
- —
Market trends
- HPI YoY
- ▼ -307.87%
- Current HPI
- 336.9632
- Rent YoY
- ▲ 6.59%
- Metro
- Truckee-Grass Valley, CA
- State GDP YoY
- ▲ 3.21%
- F500 in state
- 116
Industry mix (Fortune 500 HQ in CA)
| Industry | F500 HQs | Revenue |
|---|---|---|
| Technology | 27 | $1,492B |
|
||
| Financial Services | 3 | $174B |
|
||
| Retail | 3 | $44B |
|
||
| Insurance | 3 | $26B |
|
||
| Media / Entertainment | 2 | $115B |
|
||
| Pharmaceuticals / Biotech | 2 | $62B |
|
||
Price history
-41.2% since first listed18 events — show timeline
- 2026-06-06 Price Changed $529,000 TSMLS
- 2026-05-08 Listed $569,000 TSMLS
- 2025-10-16 Rental Removed $2,900 APPFOLIO
- 2025-09-04 Listed for Rent $2,900 APPFOLIO
- 2025-08-24 Rental Removed $2,900 APPFOLIO
- 2025-07-15 Listed for Rent $2,900 APPFOLIO
- 2024-11-08 Price Changed $549,000 TSMLS
- 2024-09-21 Price Changed $589,000 TSMLS
- 2024-08-02 Price Changed $599,000 TSMLS
- 2023-10-13 Price Changed $639,900 TSMLS
- 2023-09-03 Price Changed $648,000 TSMLS
- 2019-02-25 Sold (MLS) $393,000 TSMLS
- 2019-02-21 Sold (Public Records) $393,000 Public Records
- 2019-01-24 Pending — TSMLS
- 2019-01-19 Price Changed $398,000 TSMLS
- 2018-10-17 Price Changed $388,000 TSMLS
- 2018-09-24 Listed $399,000 TSMLS
- 2017-11-07 Sold (Public Records) $900,000 Public Records
Property tax history
+3.7%/yrLatest (2025): $6,441 · +2.9% YoY. Source: county tax records.
Cash-flow waterfall
monthlySold comps — $/sqft
last 12 mo · ≤1 miLoading sold comps…