 Multi-family
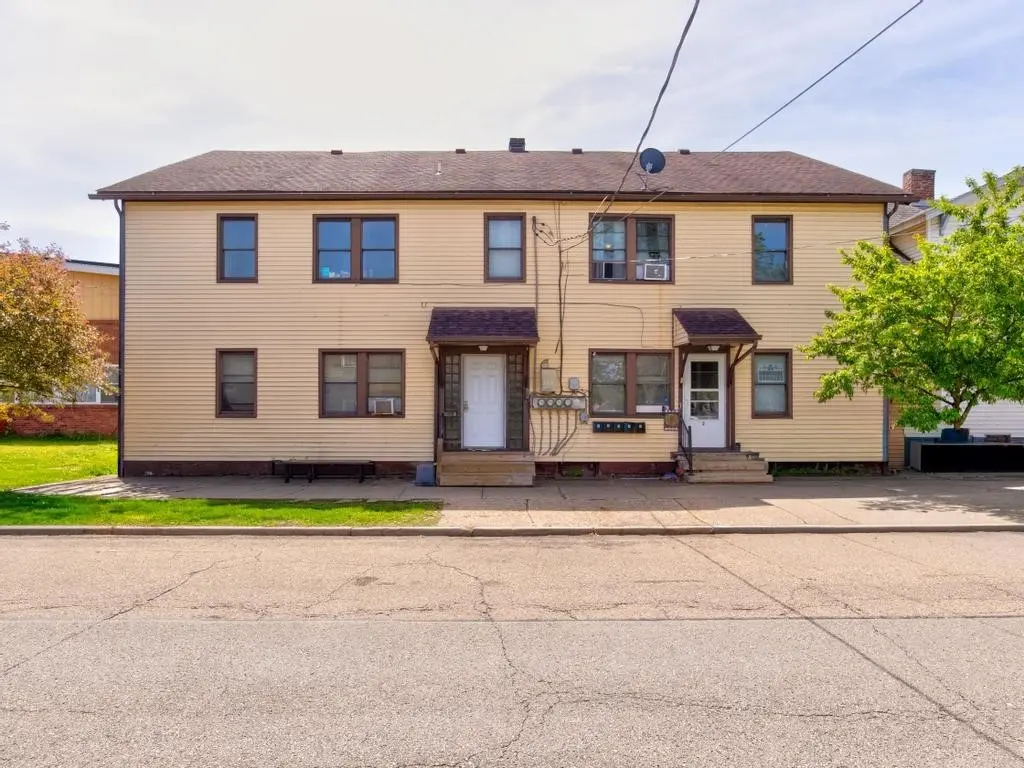
270 15th St · Ambridge, PA
Flood risk 1/10 · Minimal
- FEMA flood zone
- X (unshaded)
- Chance of flooding over 30 yrs
- 0.0%
- Est. flood insurance / yr
- $473 – $860
Fire risk 1/10 · Minimal
- Est. fire insurance / yr
- $511 – $949
Heat risk 4/10 · Minor
- Hot days now (above 97°F)
- 7 days/yr
- Hot days in 30 yrs
- 19 days/yr
Wind risk 2/10 · Minimal
- Chance of severe wind over 30 yrs
- —
Air-quality risk 3/10 · Minor
- Unhealthy air days now
- 2 days/yr
- Unhealthy air days in 30 yrs
- 3 days/yr
Risk factors via First Street. Map © Google.
Why this score? — see what drove the B- grade
The composite is a weighted blend of 9 inputs, each scored 0–100. Each bar is that input's sub-score; the figure is the points it added to the 100-point composite (weight × sub-score).
- Cash flow +30.0/30.0
- 1% rule +10.0/10.0
- DSCR +10.0/10.0
- ARV discount +7.5/15.0
- Livability +3.9/5.0
- Schools +3.1/10.0
- Rent growth +2.5/5.0
- Condition / age +2.5/5.0
- Appreciation +0.0/10.0
$325,000
🖨 Deal sheet 📄 Offer letter ✓ Due diligence
Multi-family units
County records classify this as Multi-Family (5+ Unit). Listing-text estimate: 1 unit. estimate disagrees with records
5+ unit building — per-unit beds/baths from public records are typically unavailable; the breakdown below (if shown) is an estimate from the listing text.
Listing remarks MLS
5 Units totally occupied. 3- 2 Br units currently rented and have separate utilities they pay for. There are 2 -1 BR units are rented and utilities are included. Coin operated washer and dryer in the basement are included as well as most appliances in all the units. The building is located in the desirable Ambridge Historic District.
Key facts
- 4,356 sq ft lot
- Built 1824
- Listed 47 days
Property features AI
Finance
- Financial info: Annual gross income reported: $47,376
Exterior
- Parking: On-street parking
- Utilities: Electricity available; Natural gas available; Public sewer available; Public water available
- Home design: Multi-family property
- Construction: Aluminum siding; Composition roof
- Exterior features: Lot dimensions approximately 62 x 70; Lot area about 0.1 acres; Zoned for multi-family use
Interior
- Interior features: Basement present; Gross annual income reported for the multi-unit: $47,376; Property is part of a 5-unit community
Neighborhood map
What this means for you Summary
Snapshot
- This is a 10-bed/5.0-bath multifamily listed at $325k.
Deal economics
- At list price, monthly cash flow is $2k ($22k/yr) — positive.
- The deal already cash-flows at list — no discount required.
- Meets the 1% rule at list price ($5k rent vs $325k).
- Recommended offer: $315k (3.0% below list) — sets the bar for market timing.
- Cap rate 13.1% vs local median 6.6% in Ambridge — top-decile yield for the area; either an underpriced asset or a hidden risk that comps aren't pricing in. Stress-test before assuming the spread holds.
Location & tenants
- Location reads 78/100 on livability (#293 in PA, #2,594 nationally) — a middle-class / working-renter tenant base. Strengths: commute A+, cost of living A+, housing A+; Watch: schools D+, employment D+, crime F.
- Ambridge Area SD (suburban): math 23% / reading 48% proficiency, ranked #408 of 539 in PA (top 76%) — families likely to look elsewhere, expect single-tenant / working-renter base with shorter leases.
- Market conditions: 58 active listings in the ZIP; 272 units permitted in Beaver County in 2024 (80 in 5+ unit buildings).
- At $4,999/mo this rent would consume 101% of the median local household income ($60k/yr) (locally 397% of renters already pay >50% of income on rent) — very limited rent-growth headroom before tenants either downsize or default.
Forward outlook
- Local home prices are declining (-3.0%/yr); year-one equity from $2k of loan paydown is wiped out by about $10k of value loss. Plan a longer hold.
- Beaver County population projected at -14% by 2050 — secular population decline; favor cash flow + early exit over multi-decade hold.
- At projected returns (-3.0% appreciation + 3.0% rent growth), your $91k cash investment doubles in ~6 years — after that, you're playing with house money.
Negotiation context
- It's been on market 47 days — a 3% lower offer ($315k) is reasonable based on typical stale-listing flexibility.
- 2 sale attempts since 7y ago; this cycle's ask has dropped $20k (6%) from the opening price — seller is motivated, your offer sets the floor, not the list.
- Current owner paid $210k; list at $325k implies a 55% gain — meaningful room to come down on a strong offer.
Risks & watch-outs
- Watch-outs: built in 1824 — expect roof / HVAC / electrical / plumbing capex.
Questions for the listing agent
- It's been on market 47 days. Have you received any prior offers? Is the seller open to a 3% concession, seller financing, or rate buy-down credit?
- Built in 1824 — when were the roof, HVAC, electrical panel, plumbing, and water heater last replaced?
- Is there a deadline driving the sale (1031 exchange, divorce, estate, relocation)? That informs how much negotiation room exists.
- Schools are D-rated, which usually means shorter tenancies and higher turnover. Who's the typical renter profile here, and what's been the actual vacancy rate?
- Crime grade is F in this area — have there been break-ins, vandalism, or insurance claims at this property in the last 3 years? What carrier currently insures it and at what premium?
- What's the average days-on-market for RENTAL listings here right now (not sales)? A rising rental-DOM trend means longer vacancies and softer asking-rent achievability than the comps imply.
- What's the recent tenant-quality profile in this submarket — average credit score on applications, eviction rate, late-payment / NSF rate, and stable-employment percentage? A property-management company in the area should have these aggregated.
- How much new apartment / multifamily construction is in the pipeline within 1–3 miles? Heavy new supply (>2% of stock underway) typically softens rents 12–24 months out; light construction supports rent growth.
Investment metrics
- 1% rule
- 1.54% ✓
- Cap rate
- 13.07%
- Cash-on-cash
- 24.22%
- DSCR
- 2.08
- GRM
- 5.4
CMA / ARV
- ARV (median comp)
- $103,176
- List price
- $325,000
- Delta
- 215.00%
- Verdict
- OVERPRICED
- Comps
- 1 within 2.0 mi
Projected returns pro-forma
-3.0% appreciation · 3.0% rent growth · sell at horizon
- IRR
- 17.5%
- Equity multiple
- 1.71×
- Total profit
- $64,295
- Equity at exit
- $48,459
- IRR
- 26.0%
- Equity multiple
- 3.27×
- Total profit
- $206,573
- Equity at exit
- $28,100
Cash invested: $91,000 (down + closing). Projections, not guarantees.
Landlord ↔ Tenant lean methodology
- Overall (STATE)
- 62 Landlord-Friendly
- State Pennsylvania
- 62 Landlord-Friendly · EVEN
- County
- — inherits STATE
- City
- — inherits STATE
ZIP-level market 15003
- Home prices YoY
- -15.7%
- Active inventory
- 58
- Price-to-rent
- 27.1×
Monthly cashflow live
- Estimated rent
- $4,999 high interval (Pro) →
- Mortgage (P&I)
- −$1,704
- Tax from tax record
- −$273 /mo · $3,276/yr
- Insurance
- −$135
- HOA
- −$0
- Vacancy / Maint / Mgmt
- −$1,050
- Net cashflow
- $1,836
Break-even live
5-unit breakdown (identical units grouped — click to expand)
| Units | Beds | Baths | Est. rent |
|---|---|---|---|
| 5× units | 2 | 1 | $5,000 |
| #1 | 2 | 1 | $1,000 |
| #2 | 2 | 1 | $1,000 |
| #3 | 2 | 1 | $1,000 |
| #4 | 2 | 1 | $1,000 |
| #5 | 2 | 1 | $1,000 |
| Total (5 units) | $4,999 | ||
UW: 25.0% down · 7.5% · 30yr · 1.5% tax · 5.0% vac · 8.0% maint · 8.0% mgmt
Financing live
Cash to close
- Down payment
- $81,250
- Closing costs
- $9,750
- Reserves months
- —
- Total cash needed
- —
Loan-product check · same deal, 3 products live
Conventional
25% down · 7.5% · 30yr
- Down + closing
- —
- Monthly P&I
- —
- Monthly cashflow
- —
- DSCR
- —
- Eligible?
- —
Personal DTI + credit; lowest rate.
DSCR
20% down · 8.5% · 30yr
- Down + closing
- —
- Monthly P&I
- —
- Monthly cashflow
- —
- DSCR
- —
- Eligible?
- —
No personal income docs; deal must DSCR.
Hard money
10% down · 12.0% · 12mo
- Down + closing
- —
- Monthly P&I
- —
- Monthly cashflow
- —
- DSCR
- —
- Eligible?
- —
Short-term bridge; refi at stabilization.
Listing history 15 events
-
2026-06-15statusdays on market $325,000 Pending 47 DOM
-
2026-06-13days on market $325,000 Active 46 DOM
-
2026-06-13days on market $325,000 Active 45 DOM
-
2026-06-09days on market $325,000 Active 42 DOM
-
2026-06-08days on market $325,000 Active 41 DOM
-
2026-06-07days on market $325,000 Active 40 DOM
-
2026-06-03days on market $325,000 Active 36 DOM
-
2026-06-02days on market $325,000 Active 35 DOM
-
2026-06-01days on market $325,000 Active 34 DOM
-
2026-05-31days on market $325,000 Active 33 DOM
-
2026-04-28$345,000 Active 428-char remark
-
2023-12-05soldstatus $210,000
-
2019-11-21soldstatus $123,000 Sold 337-char remark
Show marketing remark (337 chars)
5 Units totally occupied. 3- 2 Br units currently rented and have separate utilities they pay for. There are 2 -1 BR units are rented and utilities are included. Coin operated washer and dryer in the basement are included as well as most appliances in all the units. The building is located in the desirable Ambridge Historic District.
-
2019-07-20historical Contingent 337-char remark
Show marketing remark (337 chars)
5 Units totally occupied. 3- 2 Br units currently rented and have separate utilities they pay for. There are 2 -1 BR units are rented and utilities are included. Coin operated washer and dryer in the basement are included as well as most appliances in all the units. The building is located in the desirable Ambridge Historic District.
-
2019-07-15$129,900 Active 337-char remark
Show marketing remark (337 chars)
5 Units totally occupied. 3- 2 Br units currently rented and have separate utilities they pay for. There are 2 -1 BR units are rented and utilities are included. Coin operated washer and dryer in the basement are included as well as most appliances in all the units. The building is located in the desirable Ambridge Historic District.
ⓘ Source: listings_history table (triggers on properties + properties_extension) + one-shot
backfill from property_details.listing_events for pre-trigger history.
Tax reassessment forecast PA · Partial reset (capped growth)
- Current annual tax
- $3,276 · $273/mo
- Projected year-2 tax
- $4,205 · $350/mo
- Expected delta
- +$930/yr (+$77/mo · 28.4%)
ⓘ Screening estimate from a state-policy table — verify with the county assessor before closing.
Climate risk First Street
- Flood 1/10 Low FEMA zone X (unshaded) · 0% chance over 30 yrs
- Wildfire 1/10 Low
- Heat 4/10 Moderate 7 d/yr ≥97°F today · 19 d/yr by 30 yrs out
- Wind 2/10 Low
- Air quality 3/10 Moderate 2 unhealthy d/yr today · 3 by 30 yrs out
Nearby sold comps map
Loading sold comps map…
Walkable amenities ~0.75 mi
Loading nearby amenities…
Taxation est. · year 1
- Rental income
- $59,988
- − Mortgage interest
- −$18,205
- − Property taxes
- −$3,276
- − Insurance
- −$1,625
- − Repairs & maintenance
- −$4,799
- − Management
- −$4,799
- − Depreciation
- −$9,455
- Taxable income
- $17,829
- Est. tax owed @ 24.0%
- −$4,279
- After-tax cash flow
- $17,759/yr
For passive investors: Depreciation is non-cash, so a rental often shows a tax loss while cash-flowing — sheltering income. Rental losses are passive: they offset passive income freely, and up to $25,000/yr can offset ordinary (W-2) income if you actively participate and your MAGI is under $100k (phasing out to $0 by $150k); unused losses carry forward. On sale, claimed depreciation is recaptured at up to 25%, and gains may owe capital-gains tax (a 1031 exchange can defer both). Figures are a year-1 estimate at your 24.0% rate — not tax advice; consult a CPA.
Schools (NCES district)
- District
- Ambridge Area SD
- NCES district ID
- 4202440
- Math proficiency
- 23% ▼ -12.00%
- Reading proficiency
- 48% ▼ -10.00%
- Median HH income
- $49,514
- Composite
- 30.62/100
- National rank
- #6190
- State rank
- #408 of 539 in PA
Livability — Ambridge
- Score
- 78/100
- State rank
- #293
- US rank
- #2594
Category grades
Schools grade is shown separately in the Schools card above.
Census & demographics
- Census place
- Ambridge, PA
- County
- Beaver County · 116,001 people
- City population
- 11,387
- Metro
- Pittsburgh, PA
- Population (ZIP)
- 11,387
- Household income
- $59,550
- Rent vs Own
- Severe rent burden
- 397.0
Population outlook (Beaver County) Hauer SSP2
- Today (2025)
- 164,976 people
- By 2030
- 161,449 · -2.1%
- By 2040
- 151,752 · -8.0%
- By 2050
- 141,155 · -14.4%
- By 2075
- 118,142 · -28.4%
- By 2100
- 91,740 · -44.4%
Race, ethnicity, and origin ACS 2023
- Neighborhood character
- Predominantly White (77%)
- Race & ethnicity
- White 77% Two or more races 10% Black 9% Hispanic / Latino 7%
- Hispanic origin (detail)
- Mexican 2% Puerto Rican 3%
- Common ancestry
- Romanian 7% Scotch-Irish 3% Subsaharan African 3%
- Foreign-born
- 3% · Canada
- Languages at home
- 95% English-only · Other Indo-European 2% Spanish 2% Russian/Polish/Slavic 1%
Political lean MEDSL · Beaver
- 2024 margin
- Strong R (+20.7) · D 39.2% · R 59.9%
- 2008→2024 swing
- -17.9pp toward R · 2008: -2.8pp · 2024: -20.7pp
- All cycles
- 2024: R+20.7 2020: R+17.7 2016: R+20.1 2012: R+6.6 2008: R+2.8
Not yet ingested
- Civics
- —
Market trends
- HPI YoY
- ▼ -46.42%
- Current HPI
- 249.8525
- Rent YoY
- —
- Metro
- Pittsburgh, PA
- State GDP YoY
- ▲ 1.68%
- F500 in state
- 34
Industry mix (Fortune 500 HQ in PA)
| Industry | F500 HQs | Revenue |
|---|---|---|
| Healthcare | 2 | $309B |
|
||
| Insurance | 2 | $27B |
|
||
| Telecommunications / Media | 1 | $124B |
|
||
| Industrial Distribution | 1 | $22B |
|
||
| Financial Services | 1 | $20B |
|
||
| Chemicals / Materials | 1 | $18B |
|
||
Price history
+150.2% since first listed7 events — show timeline
- 2026-06-14 Pending — West Penn MLS
- 2026-05-27 Price Changed $325,000 West Penn MLS
- 2026-04-28 Listed $345,000 West Penn MLS
- 2023-12-05 Sold (Public Records) $210,000 Public Records
- 2019-11-21 Sold (MLS) $123,000 West Penn MLS
- 2019-07-20 Contingent — West Penn MLS
- 2019-07-15 Listed $129,900 West Penn MLS
Property tax history
+3.0%/yrLatest (2026): $3,276 · +2.2% YoY. Source: county tax records.
Cash-flow waterfall
monthlySold comps — $/sqft
last 12 mo · ≤1 miLoading sold comps…