 Triplex
49 51 Wealth Ave · Providence, RI
Flood risk 1/10 · Minimal
- FEMA flood zone
- X (unshaded)
- Chance of flooding over 30 yrs
- 0.0%
- Est. flood insurance / yr
- $473 – $860
Fire risk 1/10 · Minimal
- Est. fire insurance / yr
- $835 – $1,551
Heat risk 6/10 · Moderate
- Hot days now (above 96°F)
- 7 days/yr
- Hot days in 30 yrs
- 15 days/yr
Wind risk 6/10 · Moderate
- Chance of severe wind over 30 yrs
- 70.0%
Air-quality risk 2/10 · Minimal
- Unhealthy air days now
- 1 days/yr
- Unhealthy air days in 30 yrs
- 2 days/yr
Risk factors via First Street. Map © Google.
Why this score? — see what drove the B- grade
The composite is a weighted blend of 9 inputs, each scored 0–100. Each bar is that input's sub-score; the figure is the points it added to the 100-point composite (weight × sub-score).
- Cash flow +30.0/30.0
- DSCR +10.0/10.0
- 1% rule +8.2/10.0
- ARV discount +7.5/15.0
- Livability +4.2/5.0
- Rent growth +3.9/5.0
- Condition / age +2.5/5.0
- Schools +1.0/10.0
- Appreciation +0.0/10.0
$689,900
🖨 Deal sheet 📄 Offer letter ✓ Due diligence
Multi-family units
County records classify this as Multi-Family (2-4 Unit). Listing-text estimate: 3 units. confirmed
Listing remarks
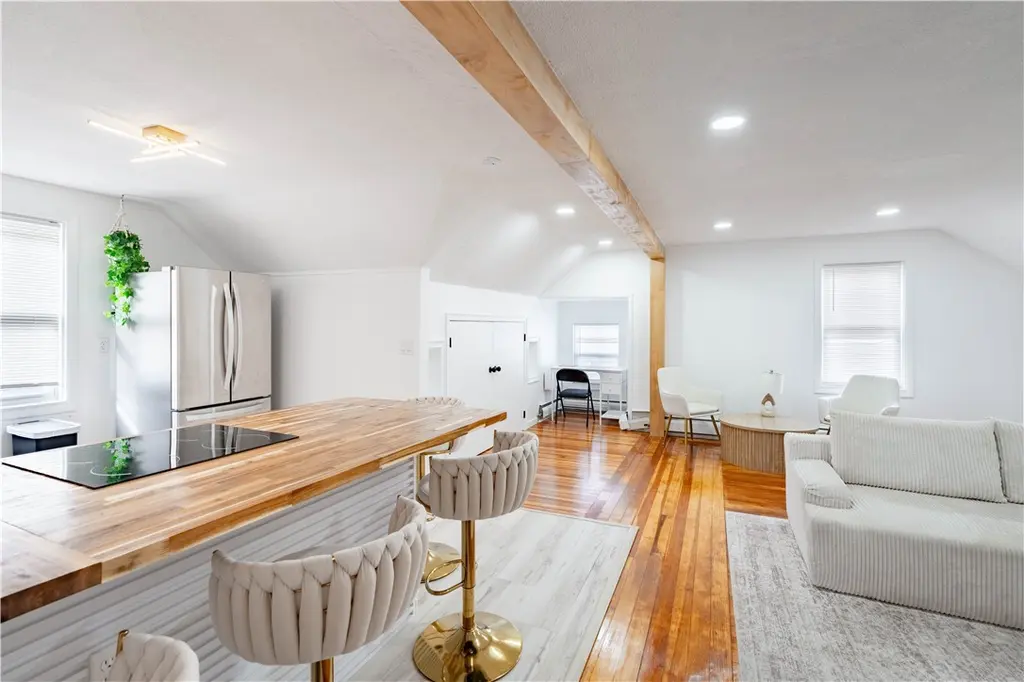
Renovated 3-family property near Federal Hill, the WaterFire Arts Center, and minutes from major highways, offering 5 total bedrooms across three spacious units. The first and second floors feature double parlors, well-appointed kitchens with scullery space, and abundant natural light. The third-floor 1-bedroom unit provides a tranquil oasis with a Japanese soaking tub and 12-inch walk-in rain shower. New Navien heating system on first floor unit. Lead certificates valid for all 3 units.
Key facts
- Japanese soaking tub
- Renovated property
- Double parlors
Tags
Property features AI
Finance
- Financial info: Three-unit multifamily property (investor interest)
- HOA & community: Community amenities nearby: golf, highway access, near hospital, public transportation, shopping, sidewalks
Exterior
- Parking: No garage; Eight total off-street parking spaces
- Utilities: Sewer connected; Public water connected; Circuit breaker electric
- Home design: Three-story building; Single building containing three units; Above-grade finished area approximately 4,088
- Construction: Combination foundation
- Exterior features: Porch; Paved driveway; Fenced yard
Interior
- Kitchen: Dishwasher; Oven; Range; Microwave; Refrigerator; Electric and gas water heaters
- Bedrooms: Three rental units: one 1-bedroom unit and two 2-bedroom units
- Flooring: Ceramic tile; Hardwood; Laminate
- Bathrooms: Three full bathrooms (one per unit)
- Heating & cooling: Heating present: baseboard, gas, and steam
- Interior features: Bathtub; Stall shower; Tub/shower combination; Full unfinished basement with interior entry
- Laundry & utility: Common area laundry; Washer; Dryer; Water heater(s) included
Neighborhood map
What this means for you Summary
Snapshot
- This is a 3 × 5-bed/3.0-bath units multifamily listed at $690k.
Deal economics
- At list price, monthly cash flow is $3k ($36k/yr) — positive. Per door: $993/mo.
- The deal already cash-flows at list — no discount required.
- Meets the 1% rule at list price ($9k rent vs $690k).
- Recommended offer: $669k (3.0% below list) — sets the bar for market timing.
- Cap rate 11.5% vs local median 4.2% in Providence — top-decile yield for the area; either an underpriced asset or a hidden risk that comps aren't pricing in. Stress-test before assuming the spread holds.
Location & tenants
- Location reads 84/100 on livability (#2 in RI, #794 nationally) — a professional / high-income tenant draw. Strengths: amenities A+, commute A+, housing A+; Watch: employment C-, schools F.
- Providence (urban): math 8% / reading 16% proficiency, ranked #34 of 39 in RI (top 87%) — low school quality limits family demand, transient renter base, plan for 1-2y turnover; 79% free/reduced lunch — lower-income household profile, screen leases tightly.
- Market conditions: Rents rising fast (+5.5%/yr); 161 active listings in the ZIP; 776 units permitted in Providence County in 2024 (229 in 5+ unit buildings).
- At $9,118/mo this rent would consume 150% of the median local household income ($73k/yr) (locally 1561% of renters already pay >50% of income on rent) — very limited rent-growth headroom before tenants either downsize or default.
Forward outlook
- Local home prices are declining (-3.0%/yr); year-one equity from $5k of loan paydown is wiped out by about $21k of value loss. Plan a longer hold.
- Providence County population projected at +5% by 2050 — modest demand growth; plan on rents tracking national, not racing it.
- At projected returns (-3.0% appreciation + 5.5% rent growth), your $193k cash investment doubles in ~6 years — after that, you're playing with house money.
Negotiation context
- It's been on market 47 days — a 3% lower offer ($669k) is reasonable based on typical stale-listing flexibility.
- 8 sale attempts since 30y ago with the ask held roughly flat each time — persistent listings suggest the price (not the market) is what's stuck; bring a comps-based counter.
- Current owner paid $240k; list at $690k implies a 187% gain — meaningful room to come down on a strong offer.
Risks & watch-outs
- Watch-outs: built in 1910 — expect roof / HVAC / electrical / plumbing capex.
- Climate carrying-cost: major wind risk, 70% chance of damaging wind over 30y; extreme-heat days projected 7→15/yr by 2055 (HVAC capex compounding) — expect insurance premiums to compound above CPI over the hold.
Questions for the listing agent
- It's been on market 47 days. Have you received any prior offers? Is the seller open to a 3% concession, seller financing, or rate buy-down credit?
- Can we see the unit-by-unit rent roll, current vacancy, and any below-market leases? What's the average tenancy length?
- What capital expenditures (roof, boiler, parking lot, exteriors) have been made in the last 5 years, and what's planned in the next 2?
- Built in 1910 — when were the roof, HVAC, electrical panel, plumbing, and water heater last replaced?
- Is there a deadline driving the sale (1031 exchange, divorce, estate, relocation)? That informs how much negotiation room exists.
- Schools are F-rated, which usually means shorter tenancies and higher turnover. Who's the typical renter profile here, and what's been the actual vacancy rate?
- What's the average days-on-market for RENTAL listings here right now (not sales)? A rising rental-DOM trend means longer vacancies and softer asking-rent achievability than the comps imply.
- What's the recent tenant-quality profile in this submarket — average credit score on applications, eviction rate, late-payment / NSF rate, and stable-employment percentage? A property-management company in the area should have these aggregated.
- How much new apartment / multifamily construction is in the pipeline within 1–3 miles? Heavy new supply (>2% of stock underway) typically softens rents 12–24 months out; light construction supports rent growth.
Investment metrics
- 1% rule
- 1.32% ✓
- Cap rate
- 11.48%
- Cash-on-cash
- 18.51%
- DSCR
- 1.82
- GRM
- 6.3
CMA / ARV
No comps found within radius.
Projected returns pro-forma
-3.0% appreciation · 5.46% rent growth · sell at horizon
- IRR
- 12.8%
- Equity multiple
- 1.52×
- Total profit
- $100,899
- Equity at exit
- $102,866
- IRR
- 23.4%
- Equity multiple
- 3.23×
- Total profit
- $431,207
- Equity at exit
- $59,650
Cash invested: $193,172 (down + closing). Projections, not guarantees.
Landlord ↔ Tenant lean methodology
- Overall (STATE)
- 31 Tenant-Leaning
- State Rhode Island
- 31 Tenant-Leaning · D+8
- County
- — inherits STATE
- City
- — inherits STATE
ZIP-level market 02908
- Home prices YoY
- -27.1%
- Rents YoY
- 5.5%
- Active inventory
- 161
- Price-to-rent
- 18.9×
Monthly cashflow live
- Estimated rent
- $9,118 medium interval (Pro) →
- Mortgage (P&I)
- −$3,618
- Tax from tax record
- −$318 /mo · $3,820/yr
- Insurance
- −$287
- HOA
- −$0
- Vacancy / Maint / Mgmt
- −$1,915
- Net cashflow
- $2,980
Break-even live
3-unit breakdown (identical units grouped — click to expand)
| Units | Beds | Baths | Est. rent |
|---|---|---|---|
| 3× units | 5 | 3 | $9,117 |
| #1 | 5 | 3 | $3,039 |
| #2 | 5 | 3 | $3,039 |
| #3 | 5 | 3 | $3,039 |
| Total (3 units) | $9,118 | ||
UW: 25.0% down · 7.5% · 30yr · 1.5% tax · 5.0% vac · 8.0% maint · 8.0% mgmt
Financing live
Cash to close
- Down payment
- $172,475
- Closing costs
- $20,697
- Reserves months
- —
- Total cash needed
- —
Loan-product check · same deal, 3 products live
Conventional
25% down · 7.5% · 30yr
- Down + closing
- —
- Monthly P&I
- —
- Monthly cashflow
- —
- DSCR
- —
- Eligible?
- —
Personal DTI + credit; lowest rate.
DSCR
20% down · 8.5% · 30yr
- Down + closing
- —
- Monthly P&I
- —
- Monthly cashflow
- —
- DSCR
- —
- Eligible?
- —
No personal income docs; deal must DSCR.
Hard money
10% down · 12.0% · 12mo
- Down + closing
- —
- Monthly P&I
- —
- Monthly cashflow
- —
- DSCR
- —
- Eligible?
- —
Short-term bridge; refi at stabilization.
Listing history 24 events
-
2026-04-23historical Active Under Contract
-
2026-04-10$689,900 Active
-
2026-01-14historical
-
2025-12-23historical Active Under Contract
-
2025-12-12$699,999 Active
-
2023-04-24soldstatus $240,000
-
2016-11-08price $144,900
-
2016-11-08price $169,900
-
2008-08-21soldstatus $105,000
-
2008-05-02historical
-
2008-03-24$134,900
-
2008-03-20historical
-
2007-11-13$154,900
-
2007-10-10historical
-
2007-06-25$179,900
-
2005-12-30historical
-
2005-07-01$332,900
-
2003-12-30soldstatus $190,000
-
2001-07-23soldstatus $96,000
-
2001-02-28soldstatus $74,000
-
2001-01-26historical
-
2001-01-24$79,900
-
1996-10-15soldstatus $73,000
-
1996-04-12$78,850
ⓘ Source: listings_history table (triggers on properties + properties_extension) + one-shot
backfill from property_details.listing_events for pre-trigger history.
Tax reassessment forecast RI · Partial reset (capped growth)
- Current annual tax
- $3,820 · $318/mo
- Projected year-2 tax
- $7,533 · $628/mo
- Expected delta
- +$3,713/yr (+$309/mo · 97.2%)
ⓘ Screening estimate from a state-policy table — verify with the county assessor before closing.
Climate risk First Street
- Flood 1/10 Low FEMA zone X (unshaded) · 0% chance over 30 yrs
- Wildfire 1/10 Low
- Heat 6/10 Major 7 d/yr ≥96°F today · 15 d/yr by 30 yrs out
- Wind 6/10 Major 70% chance of damaging wind over 30 yrs
- Air quality 2/10 Low 1 unhealthy d/yr today · 2 by 30 yrs out
Nearby sold comps map
Loading sold comps map…
Walkable amenities ~0.75 mi
Loading nearby amenities…
Taxation est. · year 1
- Rental income
- $109,416
- − Mortgage interest
- −$38,645
- − Property taxes
- −$3,820
- − Insurance
- −$3,450
- − Repairs & maintenance
- −$8,753
- − Management
- −$8,753
- − Depreciation
- −$20,070
- Taxable income
- $25,925
- Est. tax owed @ 24.0%
- −$6,222
- After-tax cash flow
- $29,532/yr
For passive investors: Depreciation is non-cash, so a rental often shows a tax loss while cash-flowing — sheltering income. Rental losses are passive: they offset passive income freely, and up to $25,000/yr can offset ordinary (W-2) income if you actively participate and your MAGI is under $100k (phasing out to $0 by $150k); unused losses carry forward. On sale, claimed depreciation is recaptured at up to 25%, and gains may owe capital-gains tax (a 1031 exchange can defer both). Figures are a year-1 estimate at your 24.0% rate — not tax advice; consult a CPA.
Schools (NCES district)
- District
- Providence
- NCES district ID
- 4400900
- Math proficiency
- 8% ▼ -4.00%
- Reading proficiency
- 16% ▼ -2.00%
- Median HH income
- $38,197
- Composite
- 10.12/100
- National rank
- #9803
- State rank
- #34 of 39 in RI
Livability — Providence
- Score
- 84/100
- State rank
- #2
- US rank
- #794
Category grades
Schools grade is shown separately in the Schools card above.
Census & demographics
- Census place
- Providence, RI
- County
- Providence County · 548,917 people
- City population
- 212,734
- Metro
- Providence-Warwick, RI-MA
- Population (ZIP)
- 39,500
- Household income
- $73,081
- Rent vs Own
- Severe rent burden
- 1561.0
Population outlook (Providence County) Hauer SSP2
- Today (2025)
- 653,469 people
- By 2030
- 660,819 · +1.1%
- By 2040
- 672,747 · +3.0%
- By 2050
- 683,741 · +4.6%
- By 2075
- 720,435 · +10.2%
- By 2100
- 741,582 · +13.5%
Race, ethnicity, and origin ACS 2023
- Neighborhood character
- Diverse neighborhood (Simpson 0.68)
- Race & ethnicity
- Hispanic / Latino 43% White 33% Two or more races 22% Black 15% Asian 4%
- Hispanic origin (detail)
- Mexican 4% Puerto Rican 5% Dominican 16%
- Common ancestry
- Swiss 4% Hispanic 3% Russian 3%
- Foreign-born
- 33% · Canada, China, South Korea
- Languages at home
- 53% English-only · Spanish 36% French/Haitian/Cajun 4% Other Indo-European 2%
Political lean MEDSL · Providence
- 2024 margin
- D (+14.4) · D 56.1% · R 41.7% · Other 2.2%
- 2008→2024 swing
- -20.0pp toward R · 2008: 34.4pp · 2024: 14.4pp
- All cycles
- 2024: D+14.4 2020: D+22.9 2016: D+21.2 2012: D+34.9 2008: D+34.4
Not yet ingested
- Civics
- —
Market trends
- HPI YoY
- ▼ -151.12%
- Current HPI
- 407.0502
- Rent YoY
- ▲ 5.46%
- Metro
- Providence-Warwick, RI-MA
- State GDP YoY
- ▲ 2.25%
- F500 in state
- 10
Industry mix (Fortune 500 HQ in RI)
| Industry | F500 HQs | Revenue |
|---|---|---|
| Healthcare | 1 | $373B |
|
||
| Food Distribution | 1 | $31B |
|
||
| Aerospace / Defense | 1 | $14B |
|
||
| Financial Services | 1 | $8B |
|
||
| Consumer Goods | 1 | $4B |
|
||
Price history
+775.0% since first listed24 events — show timeline
- 2026-04-23 Contingent — RIS
- 2026-04-10 Listed $689,900 RIS
- 2026-01-14 Listing Removed — RIS
- 2025-12-23 Contingent — RIS
- 2025-12-12 Listed $699,999 RIS
- 2023-04-24 Sold (Public Records) $240,000 Public Records
- 2016-11-08 Price Changed $169,900 RIS
- 2016-11-08 Price Changed $144,900 RIS
- 2008-08-21 Sold (MLS) $105,000 RIS
- 2008-05-02 Listing Removed — RIS
- 2008-03-24 Listed $134,900 RIS
- 2008-03-20 Listing Removed — RIS
- 2007-11-13 Listed $154,900 RIS
- 2007-10-10 Listing Removed — RIS
- 2007-06-25 Listed $179,900 RIS
- 2005-12-30 Listing Removed — RIS
- 2005-07-01 Listed $332,900 RIS
- 2003-12-30 Sold (Public Records) $190,000 Public Records
- 2001-07-23 Sold (Public Records) $96,000 Public Records
- 2001-02-28 Sold (MLS) $74,000 RIS
- 2001-01-26 Listing Removed — RIS
- 2001-01-24 Listed $79,900 RIS
- 1996-10-15 Sold (MLS) $73,000 RIS
- 1996-04-12 Listed $78,850 RIS
Property tax history
-0.8%/yrLatest (2025): $3,820 · -36.0% YoY. Source: county tax records.
Cash-flow waterfall
monthlySold comps — $/sqft
last 12 mo · ≤1 miLoading sold comps…