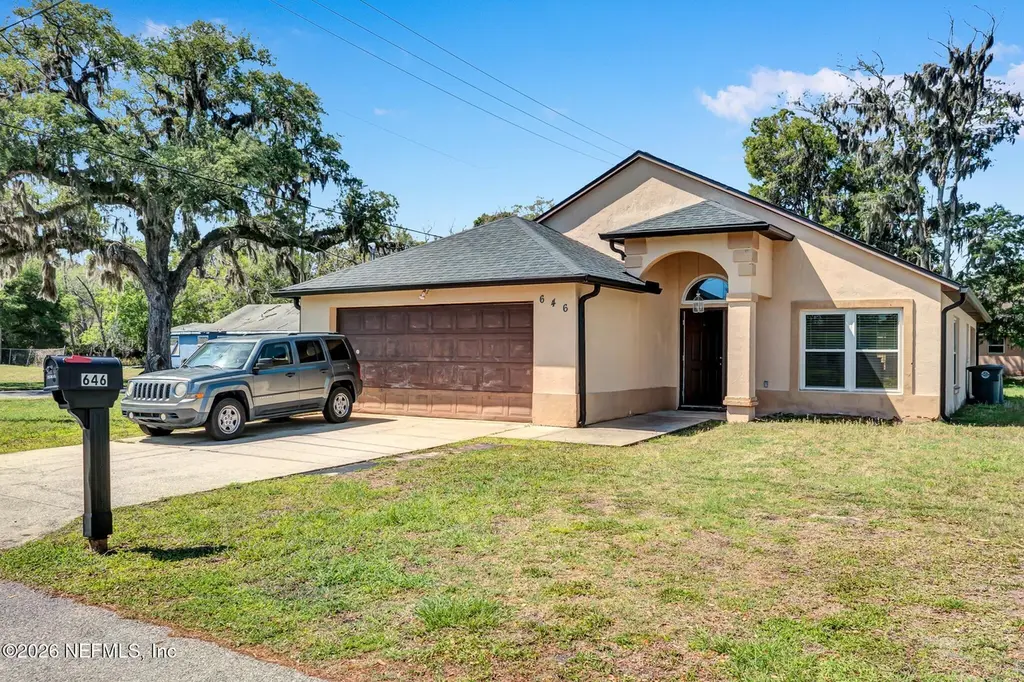
646 Whitehall St · Daytona Beach, FL
Flood risk 7/10 · Major
- FEMA flood zone
- A
- Chance of flooding over 30 yrs
- 0.68%
- Est. flood insurance / yr
- $1,009 – $1,996
Fire risk 1/10 · Minimal
- Est. fire insurance / yr
- $947 – $1,759
Heat risk 10/10 · Severe
- Hot days now (above 104°F)
- 7 days/yr
- Hot days in 30 yrs
- 20 days/yr
Wind risk 10/10 · Severe
- Chance of severe wind over 30 yrs
- 99.0%
Air-quality risk 2/10 · Minimal
- Unhealthy air days now
- 2 days/yr
- Unhealthy air days in 30 yrs
- 2 days/yr
Risk factors via First Street. Map © Google.
Why this score? — see what drove the C grade
The composite is a weighted blend of 9 inputs, each scored 0–100. Each bar is that input's sub-score; the figure is the points it added to the 100-point composite (weight × sub-score).
- Cash flow +24.7/30.0
- DSCR +8.0/10.0
- ARV discount +7.5/15.0
- 1% rule +5.1/10.0
- Livability +4.2/5.0
- Schools +3.9/10.0
- Rent growth +3.4/5.0
- Condition / age +2.5/5.0
- Appreciation +0.0/10.0
$225,000
🖨 Deal sheet 📄 Offer letter ✓ Due diligence
Listing remarks
Looking for a spacious home in a quiet neighborhood? Are you ready for a change but want to avoid overpriced properties? This 4 bed, 2 bath, 2 car garage home on a large lot in Daytona Beach can be your safe haven! It has plenty of room for a full family (pup children included). Master Bedroom offers a luxurious primary suite with a walk-in closet, en-suite bath with large step in shower! Motivated Seller, submit your best offer while it lasts!
Key facts
- 2 garage spots
- Built 1999
- Listed 12 days
Neighborhood map
What this means for you Summary
Snapshot
- This is a 4-bed/2.0-bath single-family listed at $225k.
Deal economics
- At list price, monthly cash flow is $345 ($4k/yr) — positive.
- The deal already cash-flows at list — no discount required.
- Meets the 1% rule at list price ($2k rent vs $225k).
Location & tenants
- Location reads 83/100 on livability (#46 in FL, #867 nationally) — a professional / high-income tenant draw. Strengths: amenities A+, commute A+, cost of living A+; Watch: schools D+, employment D-.
- Volusia (suburban): math 44% / reading 49% proficiency, ranked #47 of 73 in FL (top 64%) — families likely to look elsewhere, expect single-tenant / working-renter base with shorter leases.
- Market conditions: Rents rising (+3.6%/yr); 310 active listings in the ZIP; 11 comparable units currently listed for rent nearby; rentals at typical pace (median 24d on market — plan ~3-4 weeks tenant-placement turnaround); lower-income renter base — watch delinquency; 3,402 units permitted in Volusia County in 2024 (681 in 5+ unit buildings).
- At $2,272/mo this rent would consume 65% of the median local household income ($42k/yr) (locally 2772% of renters already pay >50% of income on rent) — very limited rent-growth headroom before tenants either downsize or default.
Forward outlook
- Local home prices are declining (-3.0%/yr); year-one equity from $2k of loan paydown is wiped out by about $7k of value loss. Plan a longer hold.
- Volusia County population projected at +19% by 2050 — long-run rental-demand tailwind backs the buy-and-hold thesis.
Negotiation context
- Only 12 days on market — expect competitive offers; lowballing is unlikely to land.
- 3 sale attempts since 6y ago; this cycle's ask has dropped $15k (6%) from the opening price — seller is motivated, your offer sets the floor, not the list.
Risks & watch-outs
- Watch-outs: flood insurance adds $125/mo.
- Climate carrying-cost: in FEMA flood zone A (mandatory federal flood insurance); severe wind risk, 99% chance of damaging wind over 30y; extreme-heat days projected 7→20/yr by 2055 (HVAC capex compounding) — expect insurance premiums to compound above CPI over the hold.
Questions for the listing agent
- What's the actual annual flood-insurance premium (NFIP or private), and is the property in a SFHA with mandatory coverage?
- Is there a deadline driving the sale (1031 exchange, divorce, estate, relocation)? That informs how much negotiation room exists.
- Schools are D-rated, which usually means shorter tenancies and higher turnover. Who's the typical renter profile here, and what's been the actual vacancy rate?
- What's the average days-on-market for RENTAL listings here right now (not sales)? A rising rental-DOM trend means longer vacancies and softer asking-rent achievability than the comps imply.
- What's the recent tenant-quality profile in this submarket — average credit score on applications, eviction rate, late-payment / NSF rate, and stable-employment percentage? A property-management company in the area should have these aggregated.
- How much new for-sale + rental construction is in the pipeline within 1–3 miles? Heavy new supply typically softens prices + rents 12–24 months out; constrained supply supports both.
Investment metrics
- 1% rule
- 1.01% ✓
- Cap rate
- 8.80%
- Cash-on-cash
- 8.96%
- DSCR
- 1.40
- GRM
- 8.3
CMA / ARV
No comps found within radius.
Projected returns pro-forma
-3.0% appreciation · 3.57% rent growth · sell at horizon
- IRR
- -5.6%
- Equity multiple
- 0.79×
- Total profit
- $-13,198
- Equity at exit
- $33,548
- IRR
- 4.7%
- Equity multiple
- 1.35×
- Total profit
- $22,130
- Equity at exit
- $19,454
Cash invested: $63,000 (down + closing). Projections, not guarantees.
Landlord ↔ Tenant lean methodology
- Overall (STATE)
- 87 Strongly Landlord-Friendly
- State Florida
- 87 Strongly Landlord-Friendly · R+3
- County
- — inherits STATE
- City
- — inherits STATE
ZIP-level market 32114
- Home prices YoY
- -21.8%
- Rents YoY
- 3.6%
- Active inventory
- 310
- Price-to-rent
- 8.3×
Monthly cashflow live
- Estimated rent
- $2,272 high interval (Pro) →
- Mortgage (P&I)
- −$1,180
- Tax from tax record
- −$51 /mo · $610/yr
- Insurance
- −$94
- Flood insurance flood zone
- −$125 /mo · $1,502/yr
- HOA
- −$0
- Vacancy / Maint / Mgmt
- −$477
- Net cashflow
- $345
Break-even live
UW: 25.0% down · 7.5% · 30yr · 1.5% tax · 5.0% vac · 8.0% maint · 8.0% mgmt
Financing live
Cash to close
- Down payment
- $56,250
- Closing costs
- $6,750
- Reserves months
- —
- Total cash needed
- —
Loan-product check · same deal, 3 products live
Conventional
25% down · 7.5% · 30yr
- Down + closing
- —
- Monthly P&I
- —
- Monthly cashflow
- —
- DSCR
- —
- Eligible?
- —
Personal DTI + credit; lowest rate.
DSCR
20% down · 8.5% · 30yr
- Down + closing
- —
- Monthly P&I
- —
- Monthly cashflow
- —
- DSCR
- —
- Eligible?
- —
No personal income docs; deal must DSCR.
Hard money
10% down · 12.0% · 12mo
- Down + closing
- —
- Monthly P&I
- —
- Monthly cashflow
- —
- DSCR
- —
- Eligible?
- —
Short-term bridge; refi at stabilization.
Rent comps 11 comps
| Address | Beds | Baths | Sqft | Rent | $/sqft | DOM | Units | Dist |
|---|---|---|---|---|---|---|---|---|
| 920 Lockhart St Daytona Beach, FL | 4.0 | 2.0 | 1248 | $2,250 | $1.80 | 14d | 1 | 0.52mi |
| 940 Lockhart St Daytona Beach, FL | 3.0 | 2.0 | 1071 | $1,850 | $1.73 | 19d | 1 | 0.58mi |
| 808 Valencia Ave Daytona Beach, FL | 3.0 | 2.0 | 1222 | $2,200 | $1.80 | 23d | 1 | 0.59mi |
| 1174 Margina Ave Daytona Beach, FL | 3.0 | 2.0 | 1190 | $2,340 | $1.97 | 23d | 1 | 0.86mi |
| 1229 S Beach St Daytona Beach, FL | 1.0–3.0 | 1.0–2.0 | 906 | $2,125 | $2.34 | 19d | 1 | 0.93mi |
| 204 S Keech St Daytona Beach, FL | 3.0 | 2.0 | 1641 | $2,250 | $1.37 | 23d | 1 | 0.97mi |
| 1436 Suwanee Rd Daytona Beach, FL | 4.0 | 2.0 | 1823 | $2,500 | $1.37 | 23d | 1 | 1.24mi |
| 1505 Edgewater Rd Daytona Beach, FL | 3.0 | 2.0 | 1209 | $1,800 | $1.49 | 23d | 1 | 1.39mi |
| 602 Temko Ter Daytona Beach, FL | 3.0 | 2.0 | 1642 | $3,500 | $2.13 | 23d | 1 | 1.46mi |
| 422 N Lincoln St Daytona Beach, FL | 3.0 | 2.0 | 1354 | $2,150 | $1.59 | 23d | 1 | 1.49mi |
| 2037 Schulte Ave Daytona Beach, FL | 3.0 | 1.5 | 1170 | $2,600 | $2.22 | 23d | 1 | 1.50mi |
Listing history 9 events
-
2026-04-27status Pending
-
2026-04-27price $225,000
-
2026-04-14$240,000 Active
-
2021-07-30soldstatus $203,000
-
2020-08-10historical
-
2020-06-12status Active
-
2020-05-29historical Active Contingent
-
2020-03-12price $179,000
-
2020-01-09$185,000 Active
ⓘ Source: listings_history table (triggers on properties + properties_extension) + one-shot
backfill from property_details.listing_events for pre-trigger history.
Tax reassessment forecast FL · Resets to sale price
- Current annual tax
- $610 · $51/mo
- Projected year-2 tax
- $1,868 · $156/mo
- Expected delta
- +$1,258/yr (+$105/mo · 206.3%)
ⓘ Screening estimate from a state-policy table — verify with the county assessor before closing.
Climate risk First Street
- Flood 7/10 Severe FEMA zone A · 68% chance over 30 yrs
- Wildfire 1/10 Low
- Heat 10/10 Extreme 7 d/yr ≥104°F today · 20 d/yr by 30 yrs out
- Wind 10/10 Extreme 99% chance of damaging wind over 30 yrs
- Air quality 2/10 Low 2 unhealthy d/yr today · 2 by 30 yrs out
Nearby sold comps map
Loading sold comps map…
Walkable amenities ~0.75 mi
Loading nearby amenities…
Taxation est. · year 1
- Rental income
- $27,263
- − Mortgage interest
- −$12,603
- − Property taxes
- −$610
- − Insurance
- −$2,628
- − Repairs & maintenance
- −$2,181
- − Management
- −$2,181
- − Depreciation
- −$6,545
- Taxable income
- $515
- Est. tax owed @ 24.0%
- −$124
- After-tax cash flow
- $4,018/yr
For passive investors: Depreciation is non-cash, so a rental often shows a tax loss while cash-flowing — sheltering income. Rental losses are passive: they offset passive income freely, and up to $25,000/yr can offset ordinary (W-2) income if you actively participate and your MAGI is under $100k (phasing out to $0 by $150k); unused losses carry forward. On sale, claimed depreciation is recaptured at up to 25%, and gains may owe capital-gains tax (a 1031 exchange can defer both). Figures are a year-1 estimate at your 24.0% rate — not tax advice; consult a CPA.
Schools (NCES district)
- District
- Volusia
- NCES district ID
- 1201920
- Math proficiency
- 44% ▼ -9.00%
- Reading proficiency
- 49% ▼ -3.00%
- Median HH income
- $42,946
- Composite
- 39.2/100
- National rank
- #4019
- State rank
- #47 of 73 in FL
Livability — Daytona Beach
- Score
- 83/100
- State rank
- #46
- US rank
- #867
Category grades
Schools grade is shown separately in the Schools card above.
Census & demographics
- Census place
- Daytona Beach, FL
- County
- Volusia County · 556,871 people
- City population
- 67,539
- Metro
- Deltona-Daytona Beach-Ormond Beach, FL
- Population (ZIP)
- 37,747
- Household income
- $41,736
- Rent vs Own
- Severe rent burden
- 2772.0
Population outlook (Volusia County) Hauer SSP2
- Today (2025)
- 572,749 people
- By 2030
- 598,695 · +4.5%
- By 2040
- 644,880 · +12.6%
- By 2050
- 681,451 · +19.0%
- By 2075
- 759,957 · +32.7%
- By 2100
- 778,902 · +36.0%
Race, ethnicity, and origin ACS 2023
- Neighborhood character
- Diverse neighborhood (Simpson 0.65)
- Race & ethnicity
- Black 45% White 36% Hispanic / Latino 11% Two or more races 7% Asian 2%
- Hispanic origin (detail)
- Mexican 2% Puerto Rican 4%
- Common ancestry
- Romanian 1% Slovak 1% Lithuanian 1%
- Foreign-born
- 7% · Canada, South Korea
- Languages at home
- 90% English-only · Spanish 7% Arabic 1%
Political lean MEDSL · Volusia
- 2024 margin
- Strong R (+21.8) · D 38.7% · R 60.5%
- 2008→2024 swing
- -27.4pp toward R · 2008: 5.7pp · 2024: -21.8pp
- All cycles
- 2024: R+21.8 2020: R+14.1 2016: R+13.1 2012: R+1.2 2008: D+5.7
Not yet ingested
- Civics
- —
Market trends
- HPI YoY
- ▼ -75.93%
- Current HPI
- 272.5149
- Rent YoY
- ▲ 3.57%
- Metro
- Deltona-Daytona Beach-Ormond Beach, FL
- State GDP YoY
- ▲ 3.28%
- F500 in state
- 36
Industry mix (Fortune 500 HQ in FL)
| Industry | F500 HQs | Revenue |
|---|---|---|
| Industrial Technology | 2 | $29B |
|
||
| Insurance | 2 | $17B |
|
||
| Retail | 1 | $60B |
|
||
| Technology Distribution | 1 | $58B |
|
||
| Homebuilding | 1 | $35B |
|
||
| Technology Manufacturing | 1 | $35B |
|
||
Price history
+21.6% since first listed9 events — show timeline
- 2026-04-27 Pending — realMLS
- 2026-04-27 Price Changed $225,000 realMLS
- 2026-04-14 Listed $240,000 realMLS
- 2021-07-30 Sold (Public Records) $203,000 Public Records
- 2020-08-10 Listing Removed — Daytona MLS
- 2020-06-12 Relisted — Daytona MLS
- 2020-05-29 Contingent — Daytona MLS
- 2020-03-12 Price Changed $179,000 Daytona MLS
- 2020-01-09 Listed $185,000 Daytona MLS
Property tax history
-1.8%/yrLatest (2021): $610 · +0.5% YoY. Source: county tax records.
Cash-flow waterfall
monthlySold comps — $/sqft
last 12 mo · ≤1 miLoading sold comps…