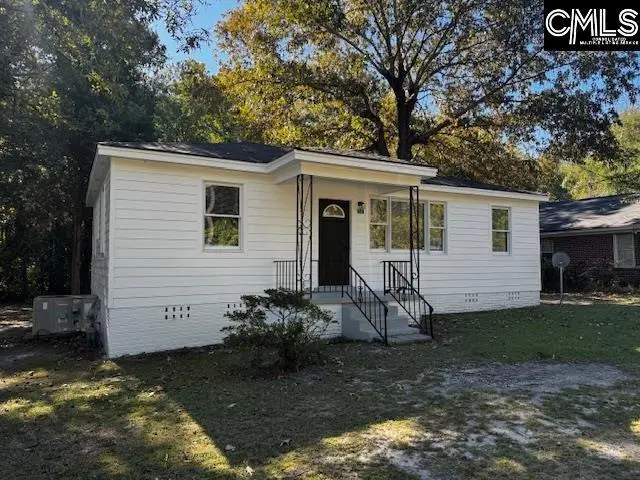
338 Bowling Ave · Columbia, SC
Flood risk 1/10 · Minimal
- FEMA flood zone
- X (unshaded)
- Chance of flooding over 30 yrs
- 0.0%
- Est. flood insurance / yr
- $507 – $1,088
Fire risk 2/10 · Minimal
- Est. fire insurance / yr
- $783 – $1,453
Heat risk 6/10 · Moderate
- Hot days now (above 108°F)
- 7 days/yr
- Hot days in 30 yrs
- 16 days/yr
Wind risk 6/10 · Moderate
- Chance of severe wind over 30 yrs
- 66.0%
Air-quality risk 3/10 · Minor
- Unhealthy air days now
- 2 days/yr
- Unhealthy air days in 30 yrs
- 2 days/yr
Risk factors via First Street. Map © Google.
Why this score? — see what drove the D- grade
The composite is a weighted blend of 9 inputs, each scored 0–100. Each bar is that input's sub-score; the figure is the points it added to the 100-point composite (weight × sub-score).
- Cash flow +12.2/30.0
- ARV discount +7.5/15.0
- Livability +3.9/5.0
- DSCR +3.6/10.0
- Rent growth +3.1/5.0
- 1% rule +2.7/10.0
- Schools +2.6/10.0
- Condition / age +2.5/5.0
- Appreciation +0.0/10.0
$149,900
🖨 Deal sheet (PDF) 📄 Offer letter ✓ Due diligence
Listing remarks
Welcome to 338 Bowling Ave. This cute home has been renovated from head to to with gleaming hardwood floors, updated kitchen with new appliances, ceiling fans in all rooms, and a large yard with no HOA. This great value of a home will not last long so call today to schedule your private showing. Disclaimer: CMLS has not reviewed and, therefore, does not endorse vendors who may appear in listings.
Key facts
- Renovated
- Ceiling fans
- Large yard
Tags
Property features AI
Exterior
- Utilities: Public water; Public sewer
- Home design: Single-story/main-level living; Other exterior finish
- Construction: Crawlspace foundation
- Exterior features: Covered front porch; Paved road access
Interior
- Kitchen: Formica countertops; Painted cabinets; Luxury vinyl plank flooring; Freestanding range; Dishwasher
- Bedrooms: Master bedroom on main level with hardwood floors and ceiling fan; Bedroom 2 on main level with hardwood floors and ceiling fan; Bedroom 3 on main level with hardwood floors and ceiling fan
- Flooring: Hardwood floors; Luxury vinyl plank in kitchen
- Bathrooms: One full bathroom
- Heating & cooling: Central heating; Central cooling
- Interior features: Hardwood floors in living areas; Ceiling fans in living room and bedrooms; Formal living room
- Laundry & utility: Mud room laundry on main level
Neighborhood map
What this means for you Summary
Snapshot
- This is a 2-bed/1.0-bath single-family listed at $150k.
Deal economics
- At list price, monthly cash flow is $-29 ($-350/yr) — negative.
- To cash-flow at today's rent, offer at most $145k (3.4% below list).
- To meet the 1% rule (rent ≥ 1% of price), the offer needs to be $116k (22.6% below list).
- Recommended offer: $116k (22.6% below list) — sets the bar for 1% rule.
Location & tenants
- Location reads 78/100 on livability (#18 in SC, #2,436 nationally) — a middle-class / working-renter tenant base. Strengths: amenities A+, commute A+, cost of living A+; Watch: employment D, crime F.
- Richland 01 (urban): math 26% / reading 36% proficiency, ranked #54 of 80 in SC (top 68%) — families likely to look elsewhere, expect single-tenant / working-renter base with shorter leases; 64% free/reduced lunch — lower-income household profile, screen leases tightly.
- Zoned schools: J. P. Thomas Elementary (math 12% / reading 12%, grade F, #572 of 597 statewide, top 97%, 323 students, 100% FRL); Alcorn Middle (math 2% / reading 12%, grade F, #228 of 229 statewide, top 100%, 370 students, 100% FRL); W.J. Keenan High (math 54% / reading 77%, grade B, #83 of 196 statewide, top 43%, 725 students, 100% FRL) — zoned schools average 100% FRL vs 64% district-wide (36 pts higher); higher-poverty schools than district average — tighter screening recommended.
- Market conditions: Rents rising (+2.5%/yr); 241 active listings in the ZIP; 4 comparable units currently listed for rent nearby; rentals at typical pace (median 16d on market — plan ~3-4 weeks tenant-placement turnaround); 3,472 units permitted in Richland County in 2024 (1,096 in 5+ unit buildings).
- This rent runs 30% of the median local income ($46k/yr) — at the standard rent-burdened threshold; future hikes will face affordability resistance.
Forward outlook
- Local home prices are declining (-3.0%/yr); year-one equity from $1k of loan paydown is wiped out by about $4k of value loss. Plan a longer hold.
- Richland County population projected at +30% by 2050 — long-run rental-demand tailwind backs the buy-and-hold thesis.
Negotiation context
- It's been on market 20 days — a 2% lower offer ($148k) is reasonable based on typical stale-listing flexibility.
- 2 sale attempts; this cycle's ask has dropped $15k (9%) from the opening price — seller is motivated, your offer sets the floor, not the list.
- Current owner paid $40k; list at $150k implies a 275% gain — meaningful room to come down on a strong offer.
Risks & watch-outs
- Climate carrying-cost: major wind risk, 66% chance of damaging wind over 30y; extreme-heat days projected 7→16/yr by 2055 (HVAC capex compounding) — expect insurance premiums to compound above CPI over the hold.
Questions for the listing agent
- What do current leases actually rent for vs. the listed asking? Can we see a recent rent roll and the last 12 months of T-12 income?
- Built in 1970 — when were the roof, HVAC, electrical panel, plumbing, and water heater last replaced?
- Is there a deadline driving the sale (1031 exchange, divorce, estate, relocation)? That informs how much negotiation room exists.
- Schools are D-rated, which usually means shorter tenancies and higher turnover. Who's the typical renter profile here, and what's been the actual vacancy rate?
- Crime grade is F in this area — have there been break-ins, vandalism, or insurance claims at this property in the last 3 years? What carrier currently insures it and at what premium?
- The area grade is low — what's the realistic commute time and amenity access for the typical tenant pool here? Any planned neighborhood developments (good or bad) we should know about?
- What's the average days-on-market for RENTAL listings here right now (not sales)? A rising rental-DOM trend means longer vacancies and softer asking-rent achievability than the comps imply.
- What's the recent tenant-quality profile in this submarket — average credit score on applications, eviction rate, late-payment / NSF rate, and stable-employment percentage? A property-management company in the area should have these aggregated.
- How much new for-sale + rental construction is in the pipeline within 1–3 miles? Heavy new supply typically softens prices + rents 12–24 months out; constrained supply supports both.
Investment metrics
- 1% rule
- 0.77% ✗
- Cap rate
- 6.06%
- Cash-on-cash
- -0.83%
- DSCR
- 0.96
- GRM
- 10.8
CMA / ARV
No comps found within radius.
Projected returns pro-forma
-3.0% appreciation · 2.5% rent growth · sell at horizon
- IRR
- -18.2%
- Equity multiple
- 0.36×
- Total profit
- $-26,769
- Equity at exit
- $22,351
- IRR
- -11.5%
- Equity multiple
- 0.33×
- Total profit
- $-28,218
- Equity at exit
- $12,961
Cash invested: $41,972 (down + closing). Projections, not guarantees.
Landlord ↔ Tenant lean methodology
- Overall (STATE)
- 90 Strongly Landlord-Friendly
- State South Carolina
- 90 Strongly Landlord-Friendly · R+6
- County
- — inherits STATE
- City
- — inherits STATE
ZIP-level market 29203
- Home prices YoY
- -31.6%
- Rents YoY
- 2.5%
- Active inventory
- 241
- Price-to-rent
- 10.8×
Monthly cashflow live
- Estimated rent
- $1,161 medium interval (Pro) →
- Mortgage (P&I)
- −$786
- Tax from tax record
- −$98 /mo · $1,173/yr
- Insurance
- −$62
- HOA
- −$0
- Vacancy / Maint / Mgmt
- −$244
- Net cashflow
- $-29
Break-even live
Sensitivity live
| Price | -10% $56 | -5% $13 | +0% $-29 | +5% $-72 | +10% $-114 |
|---|---|---|---|---|---|
| Rent | -10% $-121 | -5% $-75 | +0% $-29 | +5% $17 | +10% $63 |
| Rate | -1.0pp $46 | -0.5pp $9 | base $-29 | +0.5pp $-68 | +1.0pp $-108 |
UW: 25.0% down · 7.5% · 30yr · 1.5% tax · 5.0% vac · 8.0% maint · 8.0% mgmt
Financing live
Cash to close
- Down payment
- $37,475
- Closing costs
- $4,497
- Reserves months
- —
- Total cash needed
- —
Loan-product check · same deal, 3 products live
Conventional
25% down · 7.5% · 30yr
- Down + closing
- —
- Monthly P&I
- —
- Monthly cashflow
- —
- DSCR
- —
- Eligible?
- —
Personal DTI + credit; lowest rate.
DSCR
20% down · 8.5% · 30yr
- Down + closing
- —
- Monthly P&I
- —
- Monthly cashflow
- —
- DSCR
- —
- Eligible?
- —
No personal income docs; deal must DSCR.
Hard money
10% down · 12.0% · 12mo
- Down + closing
- —
- Monthly P&I
- —
- Monthly cashflow
- —
- DSCR
- —
- Eligible?
- —
Short-term bridge; refi at stabilization.
Rent comps 4 comps
| Address | Beds | Baths | Sqft | Rent | $/sqft | DOM | Units | Dist |
|---|---|---|---|---|---|---|---|---|
| 1407 Jerome Dr Columbia, SC | 2.0 | 1.0 | 700 | $1,125 | $1.61 | 25d | 1 | 0.74mi |
| 5867 Ames Rd Columbia, SC | 3.0 | 1.0 | 802 | $1,200 | $1.50 | 16d | 1 | 1.24mi |
| 5779 Ames Rd Columbia, SC | 2.0 | 1.0 | 895 | $1,000 | $1.12 | 16d | 1 | 1.25mi |
| 5779 Ames Rd Unit 13B Columbia, SC | 2.0 | 1.0 | 895 | $1,000 | $1.12 | 13d | 1 | 1.25mi |
Listing history 21 events
-
2026-06-21days on market $149,900 Active 20 DOM
-
2026-06-18days on market $149,900 Active 17 DOM
-
2026-06-17days on market $149,900 Active 16 DOM
-
2026-06-16days on market $149,900 Active 15 DOM
-
2026-06-15days on market $149,900 Active 14 DOM
-
2026-06-14days on market $149,900 Active 12 DOM
-
2026-06-10days on market $149,900 Active 9 DOM
-
2026-06-09days on market $149,900 Active 8 DOM
-
2026-06-08days on market $149,900 Active 7 DOM
-
2026-06-07days on market $149,900 Active 6 DOM
-
2026-06-03days on market $149,900 Active 2 DOM
-
2026-06-02pricedays on market $149,900 Active 1 DOM
-
2026-05-31days on market $154,900 Active 129 DOM
-
2026-05-07price $154,900
-
2026-04-14price $159,900
-
2026-01-21$165,000 Active
-
2025-10-20$165,000 Active
-
2003-09-09soldstatus $40,000
-
2000-04-14soldstatus $23,900
-
1998-02-14soldstatus $34,600
-
1998-02-13soldstatus $14,500
ⓘ Source: listings_history table (triggers on properties + properties_extension) + one-shot
backfill from property_details.listing_events for pre-trigger history.
Tax reassessment forecast SC · Resets to sale price
- Current annual tax
- $1,173 · $98/mo
- Projected year-2 tax
- $1,173 · $98/mo
- Expected delta
- $0/yr ($0/mo · 0.0%)
ⓘ Screening estimate from a state-policy table — verify with the county assessor before closing.
Climate risk First Street
- Flood 1/10 Low FEMA zone X (unshaded) · 0% chance over 30 yrs
- Wildfire 2/10 Low
- Heat 6/10 Major 7 d/yr ≥108°F today · 16 d/yr by 30 yrs out
- Wind 6/10 Major 66% chance of damaging wind over 30 yrs
- Air quality 3/10 Moderate 2 unhealthy d/yr today · 2 by 30 yrs out
Nearby sold comps map
Loading sold comps map…
Walkable amenities ~0.75 mi
Loading nearby amenities…
Taxation est. · year 1
- Rental income
- $13,931
- − Mortgage interest
- −$8,397
- − Property taxes
- −$1,173
- − Insurance
- −$750
- − Repairs & maintenance
- −$1,114
- − Management
- −$1,114
- − Depreciation
- −$4,361
- Taxable loss
- −$2,978
- Est. tax savings @ 24.0%
- +$715
- After-tax cash flow
- $364/yr
For passive investors: Depreciation is non-cash, so a rental often shows a tax loss while cash-flowing — sheltering income. Rental losses are passive: they offset passive income freely, and up to $25,000/yr can offset ordinary (W-2) income if you actively participate and your MAGI is under $100k (phasing out to $0 by $150k); unused losses carry forward. On sale, claimed depreciation is recaptured at up to 25%, and gains may owe capital-gains tax (a 1031 exchange can defer both). Figures are a year-1 estimate at your 24.0% rate — not tax advice; consult a CPA.
Schools (NCES district)
- District
- Richland 01
- NCES district ID
- 4503360
- Math proficiency
- 26% ▼ -7.00%
- Reading proficiency
- 36% ▼ -5.00%
- Median HH income
- $38,931
- Composite
- 25.94/100
- National rank
- #7335
- State rank
- #54 of 80 in SC
Livability — Columbia
- Score
- 78/100
- State rank
- #18
- US rank
- #2436
Category grades
Schools grade is shown separately in the Schools card above.
Census & demographics
- County
- Richland County · 389,530 people
- City population
- 335,994
- Metro
- Columbia, SC
- Population (ZIP)
- 40,653
- Household income
- $46,054
- Rent vs Own
- Severe rent burden
- 1980.0
Population outlook (Richland County) Hauer SSP2
- Today (2025)
- 459,667 people
- By 2030
- 487,524 · +6.1%
- By 2040
- 542,035 · +17.9%
- By 2050
- 595,371 · +29.5%
- By 2075
- 732,998 · +59.5%
- By 2100
- 820,415 · +78.5%
Race, ethnicity, and origin ACS 2023
- Neighborhood character
- Predominantly Black (80%)
- Race & ethnicity
- Black 80% White 13% Hispanic / Latino 5% Two or more races 2%
- Common ancestry
- Serbian 1%
- Foreign-born
- 3% · Canada
- Languages at home
- 93% English-only · Spanish 5%
Political lean MEDSL · Richland
- 2024 margin
- Solid D (+34.6) · D 66.4% · R 31.8% · Other 1.8%
- 2008→2024 swing
- +5.7pp toward D · 2008: 28.9pp · 2024: 34.6pp
- All cycles
- 2024: D+34.6 2020: D+38.3 2016: D+32.9 2012: D+33.3 2008: D+28.9
Not yet ingested
- Civics
- —
Market trends
- HPI YoY
- ▼ -77.52%
- Current HPI
- 168.2114
- Rent YoY
- ▲ 2.50%
- Metro
- Columbia, SC
- State GDP YoY
- ▲ 4.51%
- F500 in state
- 2
Industry mix (Fortune 500 HQ in SC)
| Industry | F500 HQs | Revenue |
|---|---|---|
| Packaging | 1 | $7B |
|
||
Price history
+968.3% since first listed8 events — show timeline
- 2026-05-07 Price Changed $154,900 Consolidated MLS
- 2026-04-14 Price Changed $159,900 Consolidated MLS
- 2026-01-21 Listed $165,000 Consolidated MLS
- 2025-10-20 Listed $165,000 Consolidated MLS
- 2003-09-09 Sold (Public Records) $40,000 Public Records
- 2000-04-14 Sold (Public Records) $23,900 Public Records
- 1998-02-14 Sold (Public Records) $34,600 Public Records
- 1998-02-13 Sold (Public Records) $14,500 Public Records
Property tax history
+0.5%/yrLatest (2025): $1,173 · +2.8% YoY. Source: county tax records.
Cash-flow waterfall
monthlySold comps — $/sqft
last 12 mo · ≤1 miLoading sold comps…