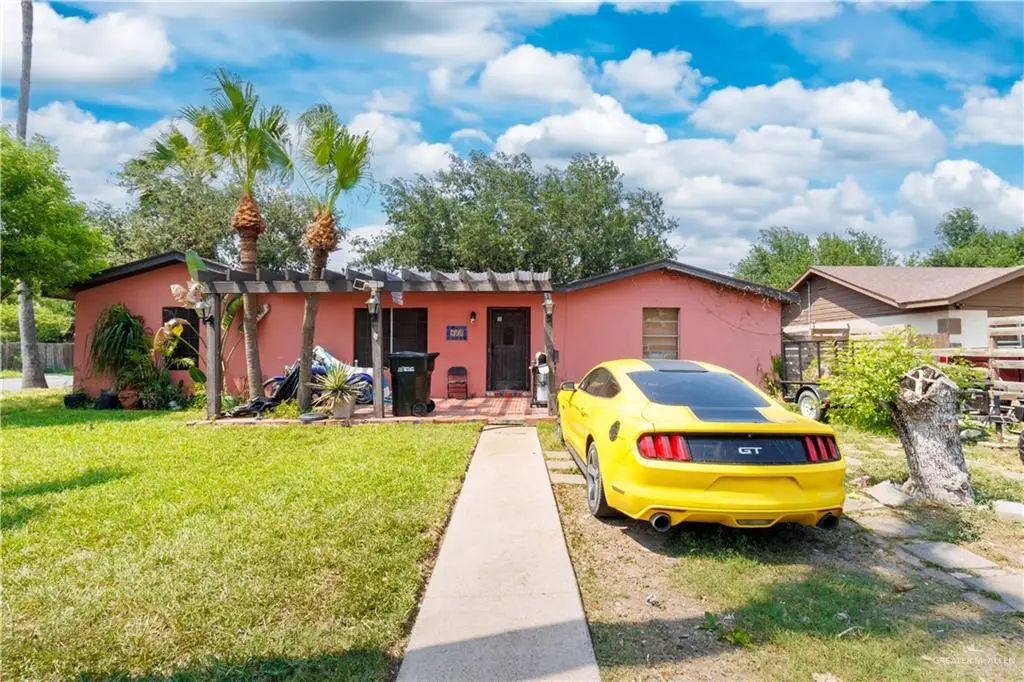
520 W Upas Ave · McAllen, TX
Flood risk 1/10 · Minimal
- FEMA flood zone
- X (shaded)
- Chance of flooding over 30 yrs
- 0.0%
- Est. flood insurance / yr
- $507 – $1,088
Fire risk 1/10 · Minimal
- Est. fire insurance / yr
- $1,222 – $2,270
Heat risk 9/10 · Severe
- Hot days now (above 111°F)
- 7 days/yr
- Hot days in 30 yrs
- 22 days/yr
Wind risk 8/10 · Major
- Chance of severe wind over 30 yrs
- 99.0%
Air-quality risk 3/10 · Minor
- Unhealthy air days now
- 1 days/yr
- Unhealthy air days in 30 yrs
- 4 days/yr
Risk factors via First Street. Map © Google.
Why this score? — see what drove the C- grade
The composite is a weighted blend of 9 inputs, each scored 0–100. Each bar is that input's sub-score; the figure is the points it added to the 100-point composite (weight × sub-score).
- Cash flow +16.2/30.0
- ARV discount +12.0/15.0
- DSCR +5.0/10.0
- 1% rule +4.7/10.0
- Livability +3.8/5.0
- Schools +3.3/10.0
- Rent growth +2.9/5.0
- Condition / age +2.5/5.0
- Appreciation +0.0/10.0
$195,000
🖨 Deal sheet (PDF) 📄 Offer letter ✓ Due diligence
Listing remarks MLS
This corner lot home offers two primary bedrooms for a total of four spacious bedrooms and 3 bathrooms. Two bathrooms have just been remodeled! All tile throughout, bonus room added, McAllen dog park in walking distance, located near schools and shopping centers. Motivated Seller!
Key facts
- Tile throughout
- Close to schools
- Close to restaurants
Tags
Neighborhood map
What this means for you Summary
Snapshot
- This is a 4-bed/2.0-bath single-family listed at $195k.
Deal economics
- At list price, monthly cash flow is $105 ($1k/yr) — positive.
- The deal already cash-flows at list — no discount required.
- To meet the 1% rule (rent ≥ 1% of price), the offer needs to be $189k (3.1% below list).
- Recommended offer: $172k (12.0% below list) — sets the bar for market timing.
- Cap rate 6.9% vs local median 3.7% in McAllen — top-decile yield for the area; either an underpriced asset or a hidden risk that comps aren't pricing in. Stress-test before assuming the spread holds.
Location & tenants
- Location reads 76/100 on livability (#119 in TX, #3,771 nationally) — a middle-class / working-renter tenant base. Strengths: cost of living A+, housing A+, health & safety A+; Watch: employment D, amenities F, commute F.
- Mcallen ISD (urban): math 34% / reading 45% proficiency, ranked #440 of 826 in TX (top 53%) — families likely to look elsewhere, expect single-tenant / working-renter base with shorter leases.
- Zoned schools: Jackson El (math 22% / reading 27%, grade F, #3,052 of 4,322 statewide, top 74%, 535 students, 86% FRL); Cathey Middle (math 46% / reading 47%, grade D+, #443 of 1,662 statewide, top 28%, 821 students, 69% FRL); Memorial H S (math 34% / reading 54%, grade F, #697 of 1,632 statewide, top 43%, 2,080 students, 67% FRL) — zoned schools average 74% FRL vs 50% district-wide (24 pts higher); higher-poverty schools than district average — tighter screening recommended.
- Market conditions: Rents rising (+1.8%/yr); 390 active listings in the ZIP; 26 comparable units currently listed for rent nearby; rentals lingering (median 46d on market — plan ~5-8 weeks vacancy on turnover, expect pricing pressure); 58% of comp listings sitting > 30 days — soft ceiling on asking rent; 7,378 units permitted in Hidalgo County in 2024 (641 in 5+ unit buildings).
- At $1,890/mo this rent would consume 47% of the median local household income ($48k/yr) (locally 3043% of renters already pay >50% of income on rent) — very limited rent-growth headroom before tenants either downsize or default.
Forward outlook
- Local home prices are declining (-3.0%/yr); year-one equity from $1k of loan paydown is wiped out by about $6k of value loss. Plan a longer hold.
- Hidalgo County population projected at +28% by 2050 — long-run rental-demand tailwind backs the buy-and-hold thesis.
Negotiation context
- It's been on market 396 days — a 12% lower offer ($172k) is reasonable based on typical stale-listing flexibility.
- 3 sale attempts since 2y ago; this cycle's ask has dropped $40k (17%) from the opening price — seller is motivated, your offer sets the floor, not the list.
Risks & watch-outs
- Climate carrying-cost: severe wind risk, 99% chance of damaging wind over 30y; extreme-heat days projected 7→22/yr by 2055 (HVAC capex compounding) — expect insurance premiums to compound above CPI over the hold.
Questions for the listing agent
- It's been on market 396 days. Have you received any prior offers? Is the seller open to a 12% concession, seller financing, or rate buy-down credit?
- Built in 1978 — when were the roof, HVAC, electrical panel, plumbing, and water heater last replaced?
- Why hasn't it sold? Are there any deal-killer items the seller is aware of (foundation, flood, title, zoning, code violations)?
- Is there a deadline driving the sale (1031 exchange, divorce, estate, relocation)? That informs how much negotiation room exists.
- Schools are B-rated — typically a magnet for longer-tenancy family renters. What's the average tenant stay here, and is there a school-zone premium baked into asking?
- What's the average days-on-market for RENTAL listings here right now (not sales)? A rising rental-DOM trend means longer vacancies and softer asking-rent achievability than the comps imply.
- What's the recent tenant-quality profile in this submarket — average credit score on applications, eviction rate, late-payment / NSF rate, and stable-employment percentage? A property-management company in the area should have these aggregated.
- How much new for-sale + rental construction is in the pipeline within 1–3 miles? Heavy new supply typically softens prices + rents 12–24 months out; constrained supply supports both.
Investment metrics
- 1% rule
- 0.97% ✗
- Cap rate
- 6.94%
- Cash-on-cash
- 2.31%
- DSCR
- 1.10
- GRM
- 8.6
CMA / ARV
- ARV (median comp)
- $216,437
- List price
- $195,000
- Delta
- -9.90%
- Verdict
- FAIR
- Comps
- 20 within 1.0 mi
Show comp detail 12 sales within ~0.75 mi
| Address | Dist | Beds/Ba | Sqft | Sold | Price | $/sf | Match |
|---|---|---|---|---|---|---|---|
| 608 Upas Ave | 0.06mi | 4/2.5 | 1,880 (-6%) | 1mo | $255,000 | $136 | 85 |
| 609 Upas Ave | 0.06mi | 3/2.0 (-1) | 1,946 (-3%) | 4mo | $299,000 | $154 | 84 |
| 417 W Westway Ave | 0.24mi | 3/3.5 (-1) | 1,960 (-2%) | 5mo | $235,000 | $120 | 70 |
| 701 W Daffodil St | 0.55mi | 4/3.0 | 1,977 (-1%) | 8mo | $319,000 | $161 | 62 |
| 313 W Highland Ave W | 0.34mi | 3/2.0 (-1) | 1,797 (-10%) | 3mo | $249,000 | $139 | 60 |
| 720 Westway Ave | 0.29mi | 4/2.5 | 1,784 (-11%) | 8mo | $235,000 | $132 | 60 |
| 107 E Camellia Ave | 0.66mi | 4/2.0 | 2,036 (+2%) | 8mo | $307,000 | $151 | 59 |
| 1105 W Maple Ave | 0.65mi | 3/2.0 (-1) | 1,942 (-3%) | 3mo | $200,000 | $103 | 58 |
| 305 W Maple Ave | 0.55mi | 4/2.0 | 1,844 (-8%) | 5mo | $183,000 | $99 | 57 |
| 2336 N Peking St | 0.51mi | 3/2.5 (-1) | 2,100 (+5%) | 7mo | $336,000 | $160 | 55 |
| 1601 Walnut Ave | 0.74mi | 3/2.5 (-1) | 1,962 (-2%) | 5mo | $379,500 | $193 | 52 |
| 2325 N Peking St | 0.46mi | 3/2.5 (-1) | 1,774 (-11%) | 5mo | $289,000 | $163 | 48 |
Match score weights: distance 35% · size 25% · config 20% · recency 20%. Top-matched comps best support the ARV.
Projected returns pro-forma
-3.0% appreciation · 1.78% rent growth · sell at horizon
- IRR
- -14.0%
- Equity multiple
- 0.50×
- Total profit
- $-27,140
- Equity at exit
- $29,075
- IRR
- -7.3%
- Equity multiple
- 0.56×
- Total profit
- $-23,972
- Equity at exit
- $16,860
Cash invested: $54,600 (down + closing). Projections, not guarantees.
Landlord ↔ Tenant lean methodology
- Overall (STATE)
- 87 Strongly Landlord-Friendly
- State Texas
- 87 Strongly Landlord-Friendly · R+5
- County
- — inherits STATE
- City
- — inherits STATE
ZIP-level market 78501
- Home prices YoY
- -23.3%
- Rents YoY
- 1.8%
- Active inventory
- 390
- Price-to-rent
- 8.6×
Monthly cashflow live
- Estimated rent
- $1,890 high interval (Pro) →
- Mortgage (P&I)
- −$1,023
- Tax from tax record
- −$284 /mo · $3,413/yr
- Insurance
- −$81
- HOA
- −$0
- Vacancy / Maint / Mgmt
- −$397
- Net cashflow
- $105
Break-even live
Sensitivity live
| Price | -10% $216 | -5% $160 | +0% $105 | +5% $50 | +10% $-5 |
|---|---|---|---|---|---|
| Rent | -10% $-44 | -5% $30 | +0% $105 | +5% $180 | +10% $255 |
| Rate | -1.0pp $203 | -0.5pp $155 | base $105 | +0.5pp $55 | +1.0pp $3 |
UW: 25.0% down · 7.5% · 30yr · 1.5% tax · 5.0% vac · 8.0% maint · 8.0% mgmt
Financing live
Cash to close
- Down payment
- $48,750
- Closing costs
- $5,850
- Reserves months
- —
- Total cash needed
- —
Loan-product check · same deal, 3 products live
Conventional
25% down · 7.5% · 30yr
- Down + closing
- —
- Monthly P&I
- —
- Monthly cashflow
- —
- DSCR
- —
- Eligible?
- —
Personal DTI + credit; lowest rate.
DSCR
20% down · 8.5% · 30yr
- Down + closing
- —
- Monthly P&I
- —
- Monthly cashflow
- —
- DSCR
- —
- Eligible?
- —
No personal income docs; deal must DSCR.
Hard money
10% down · 12.0% · 12mo
- Down + closing
- —
- Monthly P&I
- —
- Monthly cashflow
- —
- DSCR
- —
- Eligible?
- —
Short-term bridge; refi at stabilization.
Rent comps 26 comps
| Address | Beds | Baths | Sqft | Rent | $/sqft | DOM | Units | Dist |
|---|---|---|---|---|---|---|---|---|
| 619 Highland Ave McAllen, TX | 3.0 | 2.0 | 1511 | $1,500 | $0.99 | 23d | 1 | 0.28mi |
| 2325 N Peking St McAllen, TX | 3.0 | 2.5 | 1774 | $2,100 | $1.18 | 45d | 1 | 0.44mi |
| 1808 N Broadway St McAllen, TX | 4.0 | 3.0 | 1800 | $2,400 | $1.33 | 45d | 1 | 0.52mi |
| 505 W Esperanza Ave McAllen, TX | 3.0 | 3.0 | 2660 | $4,250 | $1.60 | 25d | 1 | 0.58mi |
| 301 E La Vista Ave Unit 49 McAllen, TX | 3.0 | 3.0 | 1716 | $1,450 | $0.84 | 23d | 1 | 0.65mi |
| 1024 Laurel Ave McAllen, TX | 3.0 | 2.0 | 1466 | $1,600 | $1.09 | 45d | 1 | 0.68mi |
| 1516 Walnut Ave McAllen, TX | 4.0 | 2.0 | 2188 | $1,495 | $0.68 | 45d | 1 | 0.73mi |
| 701 Hibiscus Ave #12 McAllen, TX | 3.0 | 2.0 | 1685 | $1,800 | $1.07 | 46d | 1 | 0.76mi |
| 1203 Jasmine Ave McAllen, TX | 3.0 | 2.0 | 1588 | $1,500 | $0.94 | 45d | 1 | 0.83mi |
| 1900 La Vista Ave McAllen, TX | 4.0 | 2.0 | 1410 | $2,400 | $1.70 | 45d | 1 | 0.94mi |
| 914 N 15th St McAllen, TX | 3.0 | 2.0 | 2422 | $1,900 | $0.78 | 45d | 1 | 0.97mi |
| 914 N 15th St McAllen, TX | 3.0 | 2.0 | 2422 | $1,900 | $0.78 | 16d | 1 | 0.97mi |
| 118 E Iris Ave McAllen, TX | 4.0 | 2.5 | 2070 | $1,800 | $0.87 | 25d | 1 | 0.97mi |
| 512 E Gardenia Ave McAllen, TX | 3.0 | 2.0 | 1717 | $1,900 | $1.11 | 45d | 1 | 0.99mi |
| 3400 N Cynthia St McAllen, TX | 3.0 | 2.0 | 1708 | $1,600 | $0.94 | 25d | 1 | 1.01mi |
| 705 Kerry Ln McAllen, TX | 3.0 | 2.0 | 2326 | $1,650 | $0.71 | 25d | 1 | 1.01mi |
| 1101 Kerria Ave McAllen, TX | 3.0 | 2.0 | 1920 | $2,350 | $1.22 | 23d | 1 | 1.03mi |
| 1021 E La Vista Ave Unit 4 McAllen, TX | 3.0 | 2.5 | 1500 | $1,800 | $1.20 | 45d | 1 | 1.04mi |
| 1210 W Jonquil Ave McAllen, TX | 4.0 | 3.0 | 1628 | $1,525 | $0.94 | 45d | 1 | 1.05mi |
| 121 E Jonquil Ave McAllen, TX | 4.0 | 3.5 | 2792 | $1,985 | $0.71 | 25d | 1 | 1.07mi |
| 405 Cedar Ave McAllen, TX | 3.0 | 3.0 | 1935 | $2,000 | $1.03 | 45d | 1 | 1.20mi |
| 3207 N 20th St McAllen, TX | 3.0 | 2.0 | 1627 | $2,200 | $1.35 | 45d | 1 | 1.20mi |
| 419 N 17th St Unit 2 McAllen, TX | 3.0 | 2.5 | 1600 | $1,500 | $0.94 | 23d | 1 | 1.33mi |
| 1920 N 25th St Unit C McAllen, TX | 3.0 | 1.0 | 2707 | $850 | $0.31 | 45d | 1 | 1.41mi |
| 2900 N 24th St McAllen, TX | 4.0 | 2.0 | 2009 | $1,900 | $0.95 | 45d | 1 | 1.44mi |
| 1524 Primrose Ave McAllen, TX | 3.0 | 2.0 | 2002 | $1,750 | $0.87 | 25d | 1 | 1.48mi |
Listing history 29 events
-
2026-06-21days on market $195,000 Active 396 DOM
-
2026-06-18days on market $195,000 Active 393 DOM
-
2026-06-17days on market $195,000 Active 392 DOM
-
2026-06-16days on market $195,000 Active 391 DOM
-
2026-06-15days on market $195,000 Active 390 DOM
-
2026-06-14days on market $195,000 Active 388 DOM
-
2026-06-10days on market $195,000 Active 385 DOM
-
2026-06-09days on market $195,000 Active 384 DOM
-
2026-06-08days on market $195,000 Active 383 DOM
-
2026-06-07days on market $195,000 Active 382 DOM
-
2026-06-05days on market $195,000 Active 379 DOM
-
2026-06-03days on market $195,000 Active 378 DOM
-
2026-06-02days on market $195,000 Active 377 DOM
-
2026-06-01days on market $195,000 Active 376 DOM
-
2026-05-31days on market $195,000 Active 375 DOM
-
2026-05-31days on market $195,000 Active 374 DOM
-
2025-11-18price $205,000 281-char remark
Show marketing remark (281 chars)
This corner lot home offers two primary bedrooms for a total of four spacious bedrooms and 3 bathrooms. Two bathrooms have just been remodeled! All tile throughout, bonus room added, McAllen dog park in walking distance, located near schools and shopping centers. Motivated Seller!
-
2025-11-11price $210,000 281-char remark
Show marketing remark (281 chars)
This corner lot home offers two primary bedrooms for a total of four spacious bedrooms and 3 bathrooms. Two bathrooms have just been remodeled! All tile throughout, bonus room added, McAllen dog park in walking distance, located near schools and shopping centers. Motivated Seller!
-
2025-10-18price $215,000 281-char remark
Show marketing remark (281 chars)
This corner lot home offers two primary bedrooms for a total of four spacious bedrooms and 3 bathrooms. Two bathrooms have just been remodeled! All tile throughout, bonus room added, McAllen dog park in walking distance, located near schools and shopping centers. Motivated Seller!
-
2025-08-16price $225,000 281-char remark
Show marketing remark (281 chars)
This corner lot home offers two primary bedrooms for a total of four spacious bedrooms and 3 bathrooms. Two bathrooms have just been remodeled! All tile throughout, bonus room added, McAllen dog park in walking distance, located near schools and shopping centers. Motivated Seller!
-
2025-05-21$235,000 Active 281-char remark
Show marketing remark (281 chars)
This corner lot home offers two primary bedrooms for a total of four spacious bedrooms and 3 bathrooms. Two bathrooms have just been remodeled! All tile throughout, bonus room added, McAllen dog park in walking distance, located near schools and shopping centers. Motivated Seller!
-
2024-11-10price $240,000
-
2024-10-28price $245,000
-
2024-09-17price $250,000
-
2024-08-29price $254,000
-
2024-06-30$255,000 Active
-
2024-01-09$259,000 Active
-
2010-12-30soldstatus
-
2005-04-18soldstatus
ⓘ Source: listings_history table (triggers on properties + properties_extension) + one-shot
backfill from property_details.listing_events for pre-trigger history.
Tax reassessment forecast TX · Resets to sale price
- Current annual tax
- $3,413 · $284/mo
- Projected year-2 tax
- $3,568 · $297/mo
- Expected delta
- +$155/yr (+$13/mo · 4.5%)
ⓘ Screening estimate from a state-policy table — verify with the county assessor before closing.
Climate risk First Street
- Flood 1/10 Low FEMA zone X (shaded) · 0% chance over 30 yrs
- Wildfire 1/10 Low
- Heat 9/10 Extreme 7 d/yr ≥111°F today · 22 d/yr by 30 yrs out
- Wind 8/10 Severe 99% chance of damaging wind over 30 yrs
- Air quality 3/10 Moderate 1 unhealthy d/yr today · 4 by 30 yrs out
Nearby sold comps map
Loading sold comps map…
Walkable amenities ~0.75 mi
Loading nearby amenities…
Taxation est. · year 1
- Rental income
- $22,685
- − Mortgage interest
- −$10,923
- − Property taxes
- −$3,413
- − Insurance
- −$975
- − Repairs & maintenance
- −$1,815
- − Management
- −$1,815
- − Depreciation
- −$5,673
- Taxable loss
- −$1,928
- Est. tax savings @ 24.0%
- +$463
- After-tax cash flow
- $1,725/yr
For passive investors: Depreciation is non-cash, so a rental often shows a tax loss while cash-flowing — sheltering income. Rental losses are passive: they offset passive income freely, and up to $25,000/yr can offset ordinary (W-2) income if you actively participate and your MAGI is under $100k (phasing out to $0 by $150k); unused losses carry forward. On sale, claimed depreciation is recaptured at up to 25%, and gains may owe capital-gains tax (a 1031 exchange can defer both). Figures are a year-1 estimate at your 24.0% rate — not tax advice; consult a CPA.
Schools (NCES district)
- District
- Mcallen ISD
- NCES district ID
- 4829670
- Math proficiency
- 34% ▼ -22.00%
- Reading proficiency
- 45% ▼ -5.00%
- Median HH income
- $40,805
- Composite
- 33.16/100
- National rank
- #5551
- State rank
- #440 of 826 in TX
Livability — McAllen
- Score
- 76/100
- State rank
- #119
- US rank
- #3771
Category grades
Schools grade is shown separately in the Schools card above.
Census & demographics
- Census place
- McAllen, TX
- County
- Hidalgo County · 623,128 people
- City population
- 144,650
- Metro
- McAllen-Edinburg-Mission, TX
- Population (ZIP)
- 58,935
- Household income
- $48,071
- Rent vs Own
- Severe rent burden
- 3043.0
Population outlook (Hidalgo County) Hauer SSP2
- Today (2025)
- 955,232 people
- By 2030
- 1,009,774 · +5.7%
- By 2040
- 1,120,332 · +17.3%
- By 2050
- 1,225,036 · +28.2%
- By 2075
- 1,439,189 · +50.7%
- By 2100
- 1,533,429 · +60.5%
Race, ethnicity, and origin ACS 2023
- Neighborhood character
- Predominantly Hispanic (89%)
- Race & ethnicity
- Hispanic / Latino 89% Two or more races 32% White 8% Asian 2%
- Hispanic origin (detail)
- Mexican 85%
- Foreign-born
- 28% · Canada, Vietnam
- Languages at home
- 22% English-only · Spanish 76%
Political lean MEDSL · Hidalgo
- 2024 margin
- Toss-up / Even · D 48.1% · R 51.0%
- 2008→2024 swing
- -41.6pp toward R · 2008: 38.7pp · 2024: -2.9pp
- All cycles
- 2024: R+2.9 2020: D+17.1 2016: D+40.5 2012: D+41.8 2008: D+38.7
Not yet ingested
- Civics
- —
Market trends
- HPI YoY
- ▼ -69.99%
- Current HPI
- 230.0213
- Rent YoY
- ▲ 1.78%
- Metro
- McAllen-Edinburg-Mission, TX
- State GDP YoY
- ▲ 3.95%
- F500 in state
- 110
Industry mix (Fortune 500 HQ in TX)
| Industry | F500 HQs | Revenue |
|---|---|---|
| Energy | 16 | $1,198B |
|
||
| Technology | 5 | $198B |
|
||
| Engineering / Construction | 4 | $72B |
|
||
| Energy Services | 3 | $60B |
|
||
| Utilities | 3 | $41B |
|
||
| Healthcare | 2 | $330B |
|
||
Price history
-20.8% since first listed13 events — show timeline
- 2025-11-18 Price Changed $205,000 MCALLENMLS
- 2025-11-11 Price Changed $210,000 MCALLENMLS
- 2025-10-18 Price Changed $215,000 MCALLENMLS
- 2025-08-16 Price Changed $225,000 MCALLENMLS
- 2025-05-21 Listed $235,000 MCALLENMLS
- 2024-11-10 Price Changed $240,000 MCALLENMLS
- 2024-10-28 Price Changed $245,000 MCALLENMLS
- 2024-09-17 Price Changed $250,000 MCALLENMLS
- 2024-08-29 Price Changed $254,000 MCALLENMLS
- 2024-06-30 Listed $255,000 MCALLENMLS
- 2024-01-09 Listed $259,000 MCALLENMLS
- 2010-12-30 Sold (Public Records) — Public Records
- 2005-04-18 Sold (Public Records) — Public Records
Property tax history
+8.5%/yrLatest (2025): $3,413 · -7.0% YoY. Source: county tax records.
Cash-flow waterfall
monthlySold comps — $/sqft
last 12 mo · ≤1 miLoading sold comps…