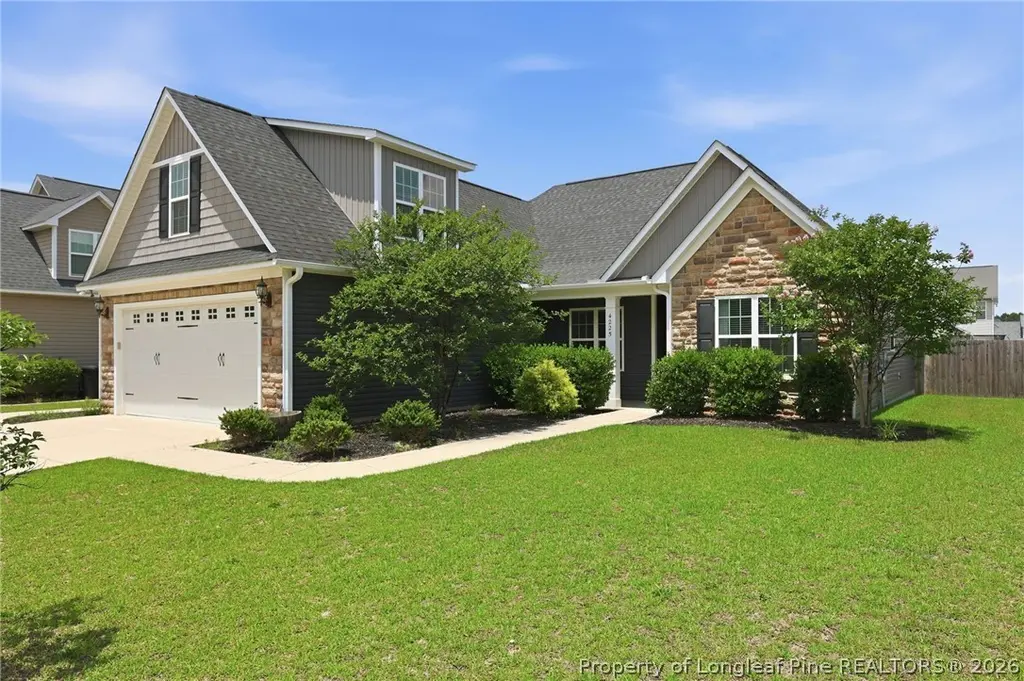
4225 Pleasantburg Dr · Vander, NC
Flood risk 1/10 · Minimal
- FEMA flood zone
- X (unshaded)
- Chance of flooding over 30 yrs
- 0.0%
- Est. flood insurance / yr
- $507 – $1,088
Fire risk 4/10 · Minor
- Est. fire insurance / yr
- $906 – $1,684
Heat risk 8/10 · Major
- Hot days now (above 106°F)
- 7 days/yr
- Hot days in 30 yrs
- 17 days/yr
Wind risk 8/10 · Major
- Chance of severe wind over 30 yrs
- 80.0%
Air-quality risk 1/10 · Minimal
- Unhealthy air days now
- 0 days/yr
- Unhealthy air days in 30 yrs
- 0 days/yr
Risk factors via First Street. Map © Google.
Why this score? — see what drove the D grade
The composite is a weighted blend of 9 inputs, each scored 0–100. Each bar is that input's sub-score; the figure is the points it added to the 100-point composite (weight × sub-score).
- Appreciation +10.0/10.0
- ARV discount +9.6/15.0
- Cash flow +7.6/30.0
- Schools +3.1/10.0
- Livability +2.8/5.0
- Rent growth +2.5/5.0
- Condition / age +2.5/5.0
- DSCR +1.8/10.0
- 1% rule +1.5/10.0
$335,000
🖨 Deal sheet 📄 Offer letter ✓ Due diligence
Listing remarks MLS
-Welcome home to this beauty! Over 2,100 sq ft, 3 beds/2.5 bath and a separate bonus room. This beautiful floor plan features an open concept, kitchen island with eating area, breakfast nook and formal dining area. Large family room with fireplace and vaulted ceiling. Split bedroom design, the owner's suite connects to a generous bathroom that includes a double vanity and a walk-in closet. Granite countertops and many high-end finishes throughout the home. Enjoy your fenced in backyard as you relax on your covered patio!
Key facts
- Eat-in dining area
- Formal dining room
- Primary suite
Tags
Property features AI
Finance
- Other: Directions: Clinton Road toward Cape Fear High, right onto Old Vander Road, left into Blakefield, right onto Pleasantburg Dr — home is on the left
- HOA & community: Homeowners association with an annual fee of $100 (about $8.33/month)
Exterior
- Parking: Attached garage with 2 covered spaces
- Security: Security system; Smoke detectors
- Utilities: Public water; Public sewer
- Home design: Single-family residence; Residential property; Zoned RR (Rural Residential); Subdivision: BLAKEFIELD
- Construction: Stone veneer and vinyl siding exterior
- Exterior features: Front porch; Rear covered porch/patio; Covered porch; Patio; Privacy fencing in backyard
Interior
- Kitchen: Dishwasher; Range; Microwave; Refrigerator; Granite counters; Kitchen island; Pantry; Eat-in kitchen
- Bedrooms: Total of 8 rooms (includes bedrooms and living spaces)
- Flooring: Carpet; Vinyl
- Bathrooms: 2 full bathrooms; 1 half bathroom
- Heating & cooling: Central air (electric); Ceiling fans
- Interior features: Ceiling fans; Double vanity; Entrance foyer; Eat-in kitchen; Granite countertops; Kitchen island; Pantry; Walk-in closets; Window coverings and blinds; Gas fireplace
- Laundry & utility: Washer hookup; Dryer included; Laundry on main level; In-unit laundry
Neighborhood map
What this means for you Summary
Snapshot
- This is a 3-bed/4.0-bath single-family listed at $335k.
Deal economics
- At list price, monthly cash flow is $-395 ($-5k/yr) — negative.
- To cash-flow at today's rent, offer at most $265k (20.8% below list).
- To meet the 1% rule (rent ≥ 1% of price), the offer needs to be $218k (35.0% below list).
- Recommended offer: $218k (35.0% below list) — sets the bar for 1% rule.
- Cap rate 4.9% vs local median 3.9% in Vander — meaningfully above typical; check what's discounted (condition, days-on-market, listing class) to confirm the premium yield is real.
Location & tenants
- Location reads 55/100 on livability (#645 in NC) — a working-class tenant base; expect higher turnover. Strengths: cost of living A+, crime A, employment B+; Watch: amenities F, commute F, housing F.
- Cumberland County Schools (urban): math 32% / reading 41% proficiency, ranked #126 of 178 in NC (top 71%) — families likely to look elsewhere, expect single-tenant / working-renter base with shorter leases.
- Zoned schools: Mac Williams Middle (math 40% / reading 50%, grade D, #160 of 475 statewide, top 35%, 1,151 students, 58% FRL); Cape Fear High (math 75% / reading 47%, grade C+, #202 of 535 statewide, top 39%, 1,529 students, 50% FRL) — zoned schools at 54% FRL track the district average.
- Zoned-school proficiency averages 53% at this address vs 36% district-wide (+16 pts) — the actual schools serving this property are materially stronger than the Cumberland County Schools average implies; a family-tenant draw the district grade alone would hide.
- Market conditions: 222 active listings in the ZIP; 3 comparable units currently listed for rent nearby; rentals leasing fast (median 14d on market — plan ~1-2 weeks tenant-placement turnaround); 1,125 units permitted in Cumberland County in 2024 (104 in 5+ unit buildings).
Forward outlook
- In year one you build about $36k of equity ($2k loan paydown + $34k appreciation (10.0% local appreciation)).
- By year 2, paydown + projected appreciation supports a ~$58k cash-out refi (75% LTV) — recoverable capital for the next deal without selling this one.
Negotiation context
- Only 14 days on market — expect competitive offers; lowballing is unlikely to land.
- 4 sale attempts since 8y ago with the ask held roughly flat each time — persistent listings suggest the price (not the market) is what's stuck; bring a comps-based counter.
Risks & watch-outs
- Climate carrying-cost: severe wind risk, 80% chance of damaging wind over 30y; extreme-heat days projected 7→17/yr by 2055 (HVAC capex compounding) — expect insurance premiums to compound above CPI over the hold.
Questions for the listing agent
- What do current leases actually rent for vs. the listed asking? Can we see a recent rent roll and the last 12 months of T-12 income?
- What does the HOA fee cover, when was the last increase, and are there any pending special assessments or reserve-fund shortfalls?
- Is there a deadline driving the sale (1031 exchange, divorce, estate, relocation)? That informs how much negotiation room exists.
- Schools are F-rated, which usually means shorter tenancies and higher turnover. Who's the typical renter profile here, and what's been the actual vacancy rate?
- The area grade is low — what's the realistic commute time and amenity access for the typical tenant pool here? Any planned neighborhood developments (good or bad) we should know about?
- What's the average days-on-market for RENTAL listings here right now (not sales)? A rising rental-DOM trend means longer vacancies and softer asking-rent achievability than the comps imply.
- What's the recent tenant-quality profile in this submarket — average credit score on applications, eviction rate, late-payment / NSF rate, and stable-employment percentage? A property-management company in the area should have these aggregated.
- How much new for-sale + rental construction is in the pipeline within 1–3 miles? Heavy new supply typically softens prices + rents 12–24 months out; constrained supply supports both.
Investment metrics
- 1% rule
- 0.65% ✗
- Cap rate
- 4.88%
- Cash-on-cash
- -5.05%
- DSCR
- 0.78
- GRM
- 12.8
CMA / ARV
- ARV (on-the-fly)
- $351,616
- Comps found
- 12
Show comp detail 12 sales within ~0.75 mi
| Address | Dist | Beds/Ba | Sqft | Sold | Price | $/sf | Match |
|---|---|---|---|---|---|---|---|
| 368 Whitestone Dr | 0.20mi | 3/2.5 | 1,997 (-7%) | 9mo | $339,700 | $170 | 66 |
| 364 Whitestone (lot 290) Dr | 0.19mi | 4/2.5 (+1) | 2,009 (-6%) | 7mo | $339,500 | $169 | 64 |
| 408 Whitestone (lot 285) Dr | 0.23mi | 4/3.0 (+1) | 2,344 (+9%) | 1mo | $368,900 | $157 | 64 |
| 402 Lyman (lot 271) Dr | 0.27mi | 4/2.5 (+1) | 2,360 (+10%) | 1mo | $367,900 | $156 | 59 |
| 404 Whitestone Dr | 0.23mi | 3/2.5 | 1,885 (-12%) | 7mo | $319,800 | $170 | 57 |
| 4252 Pleasantburg Dr | 0.09mi | 4/2.5 (+1) | 2,438 (+14%) | 6mo | $347,500 | $143 | 57 |
| 409 Whitestone Dr | 0.26mi | 4/2.5 (+1) | 2,336 (+9%) | 8mo | $384,000 | $164 | 55 |
| 415 Lyman Dr | 0.33mi | 4/2.5 (+1) | 2,325 (+8%) | 11mo | $344,800 | $148 | 51 |
| 413 Whitestone Dr | 0.27mi | 4/2.0 (+1) | 1,854 (-14%) | 3mo | $331,000 | $179 | 50 |
| 401 Whitestone Dr | 0.25mi | 4/2.5 (+1) | 1,886 (-12%) | 12mo | $339,999 | $180 | 48 |
| 4141 Locks Creek Church Rd | 0.40mi | 4/2.5 (+1) | 1,850 (-14%) | 8mo | $175,000 | $95 | 41 |
| 4041 Lifestyle Rd | 0.73mi | 4/2.5 (+1) | 2,273 (+6%) | 6mo | $315,000 | $139 | 40 |
Match score weights: distance 35% · size 25% · config 20% · recency 20%. Top-matched comps best support the ARV.
Projected returns pro-forma
10.0% appreciation · 3.0% rent growth · sell at horizon
- IRR
- 20.7%
- Equity multiple
- 2.68×
- Total profit
- $157,200
- Equity at exit
- $301,795
- IRR
- 18.8%
- Equity multiple
- 6.14×
- Total profit
- $482,533
- Equity at exit
- $650,831
Cash invested: $93,800 (down + closing). Projections, not guarantees.
Landlord ↔ Tenant lean methodology
- Overall (STATE)
- 85 Strongly Landlord-Friendly
- State North Carolina
- 85 Strongly Landlord-Friendly · R+3
- County
- — inherits STATE
- City
- — inherits STATE
ZIP-level market 28312
- Home prices YoY
- 6.9%
- Active inventory
- 222
- Price-to-rent
- 12.8×
Monthly cashflow live
- Estimated rent
- $2,176 medium interval (Pro) →
- Mortgage (P&I)
- −$1,757
- Tax from tax record
- −$210 /mo · $2,518/yr
- Insurance
- −$140
- HOA
- −$8
- Vacancy / Maint / Mgmt
- −$457
- Net cashflow
- $-395
Break-even live
UW: 25.0% down · 7.5% · 30yr · 1.5% tax · 5.0% vac · 8.0% maint · 8.0% mgmt
Financing live
Cash to close
- Down payment
- $83,750
- Closing costs
- $10,050
- Reserves months
- —
- Total cash needed
- —
Loan-product check · same deal, 3 products live
Conventional
25% down · 7.5% · 30yr
- Down + closing
- —
- Monthly P&I
- —
- Monthly cashflow
- —
- DSCR
- —
- Eligible?
- —
Personal DTI + credit; lowest rate.
DSCR
20% down · 8.5% · 30yr
- Down + closing
- —
- Monthly P&I
- —
- Monthly cashflow
- —
- DSCR
- —
- Eligible?
- —
No personal income docs; deal must DSCR.
Hard money
10% down · 12.0% · 12mo
- Down + closing
- —
- Monthly P&I
- —
- Monthly cashflow
- —
- DSCR
- —
- Eligible?
- —
Short-term bridge; refi at stabilization.
Rent comps 3 comps
| Address | Beds | Baths | Sqft | Rent | $/sqft | DOM | Units | Dist |
|---|---|---|---|---|---|---|---|---|
| 4233 Pleasantburg Dr Fayetteville, NC | 4.0 | 2.5 | 2252 | $2,300 | $1.02 | 13d | 1 | 0.06mi |
| 4243 Cinder Ln Fayetteville, NC | 4.0 | 3.0 | 2144 | $2,085 | $0.97 | 13d | 1 | 0.08mi |
| 4211 Cherry Hill Ln Fayetteville, NC | 4.0 | 2.5 | 2341 | $2,145 | $0.92 | 13d | 1 | 0.11mi |
HOA detail
- Monthly dues
- $8 · $96/yr
Listing history 11 events
-
2026-06-15statusdays on market $335,000 Pending 14 DOM
-
2026-06-14days on market $335,000 Active 13 DOM
-
2026-06-13days on market $335,000 Active 12 DOM
-
2026-06-10days on market $335,000 Active 10 DOM
-
2026-06-09days on market $335,000 Active 9 DOM
-
2026-06-08days on market $335,000 Active 8 DOM
-
2026-06-07days on market $335,000 Active 7 DOM
-
2026-06-03days on market $335,000 Active 3 DOM
-
2026-06-02days on market $335,000 Active 2 DOM
-
2026-06-01remarks 699-char remark
-
2026-06-01$335,000 Active 1 DOM
ⓘ Source: listings_history table (triggers on properties + properties_extension) + one-shot
backfill from property_details.listing_events for pre-trigger history.
Tax reassessment forecast NC · Resets to sale price
- Current annual tax
- $2,518 · $210/mo
- Projected year-2 tax
- $2,747 · $229/mo
- Expected delta
- +$229/yr (+$19/mo · 9.1%)
ⓘ Screening estimate from a state-policy table — verify with the county assessor before closing.
Climate risk First Street
- Flood 1/10 Low FEMA zone X (unshaded) · 0% chance over 30 yrs
- Wildfire 4/10 Moderate
- Heat 8/10 Severe 7 d/yr ≥106°F today · 17 d/yr by 30 yrs out
- Wind 8/10 Severe 80% chance of damaging wind over 30 yrs
- Air quality 1/10 Low 0 unhealthy d/yr today · 0 by 30 yrs out
Nearby sold comps map
Loading sold comps map…
Walkable amenities ~0.75 mi
Loading nearby amenities…
Taxation est. · year 1
- Rental income
- $26,114
- − Mortgage interest
- −$18,765
- − Property taxes
- −$2,518
- − Insurance
- −$1,675
- − Repairs & maintenance
- −$2,089
- − Management
- −$2,089
- − HOA
- −$96
- − Depreciation
- −$9,745
- Taxable loss
- −$10,864
- Est. tax savings @ 24.0%
- +$2,607
- After-tax cash flow
- $-2,133/yr
For passive investors: Depreciation is non-cash, so a rental often shows a tax loss while cash-flowing — sheltering income. Rental losses are passive: they offset passive income freely, and up to $25,000/yr can offset ordinary (W-2) income if you actively participate and your MAGI is under $100k (phasing out to $0 by $150k); unused losses carry forward. On sale, claimed depreciation is recaptured at up to 25%, and gains may owe capital-gains tax (a 1031 exchange can defer both). Figures are a year-1 estimate at your 24.0% rate — not tax advice; consult a CPA.
Schools (NCES district)
- District
- Cumberland County Schools
- NCES district ID
- 3700011
- Math proficiency
- 32% ▼ -2.00%
- Reading proficiency
- 41% ▼ -1.00%
- Median HH income
- $44,168
- Composite
- 31.0/100
- National rank
- #6096
- State rank
- #126 of 178 in NC
Livability — Vander
- Score
- 55/100
- State rank
- #645
- US rank
- #23450
Category grades
Schools grade is shown separately in the Schools card above.
Census & demographics
- Population (ZIP)
- 19,889
Population outlook (Cumberland County) Hauer SSP2
- Today (2025)
- 330,855 people
- By 2030
- 333,523 · +0.8%
- By 2040
- 335,583 · +1.4%
- By 2050
- 335,325 · +1.4%
- By 2075
- 342,853 · +3.6%
- By 2100
- 340,698 · +3.0%
Race, ethnicity, and origin ACS 2023
- Neighborhood character
- Diverse neighborhood (Simpson 0.61)
- Race & ethnicity
- White 55% Black 29% Two or more races 8% Hispanic / Latino 8% Native American 2%
- Hispanic origin (detail)
- Mexican 4% Puerto Rican 2%
- Common ancestry
- Slovak 3% Serbian 2% Italian 2%
- Foreign-born
- 4% · Canada
- Languages at home
- 93% English-only · Spanish 5% French/Haitian/Cajun 1%
Political lean MEDSL · Cumberland
- 2024 margin
- D (+13.4) · D 56.1% · R 42.7% · Other 1.2%
- 2008→2024 swing
- -4.3pp toward R · 2008: 17.7pp · 2024: 13.4pp
- All cycles
- 2024: D+13.4 2020: D+16.6 2016: D+16.0 2012: D+19.7 2008: D+17.7
Not yet ingested
- Civics
- —
Market trends
- HPI YoY
- ▲ 19.75%
- Current HPI
- 306.7749
- Rent YoY
- —
- Metro
- —
- State GDP YoY
- ▲ 3.28%
- F500 in state
- 26
Industry mix (Fortune 500 HQ in NC)
| Industry | F500 HQs | Revenue |
|---|---|---|
| Financial Services | 2 | $213B |
|
||
| Retail | 2 | $95B |
|
||
| Industrial Conglomerate | 1 | $38B |
|
||
| Metals / Steel | 1 | $35B |
|
||
| Utilities | 1 | $30B |
|
||
| Industrial Machinery | 1 | $19B |
|
||
Price history
+44.8% since first listed9 events — show timeline
- 2026-06-01 Listed $335,000 LPRMLS
- 2022-09-01 Sold (Public Records) $310,000 Public Records
- 2022-09-01 Sold (MLS) $310,000 TMLS
- 2022-09-01 Sold (MLS) $310,000 LPRMLS
- 2022-08-04 Pending — TMLS
- 2022-08-01 Listed $298,500 TMLS
- 2022-08-01 Listed $298,500 LPRMLS
- 2019-01-31 Sold (MLS) $231,999 LPRMLS
- 2018-09-05 Listed $231,399 LPRMLS
Property tax history
+28.6%/yrLatest (2025): $2,518 · +12.0% YoY. Source: county tax records.
Cash-flow waterfall
monthlySold comps — $/sqft
last 12 mo · ≤1 miLoading sold comps…