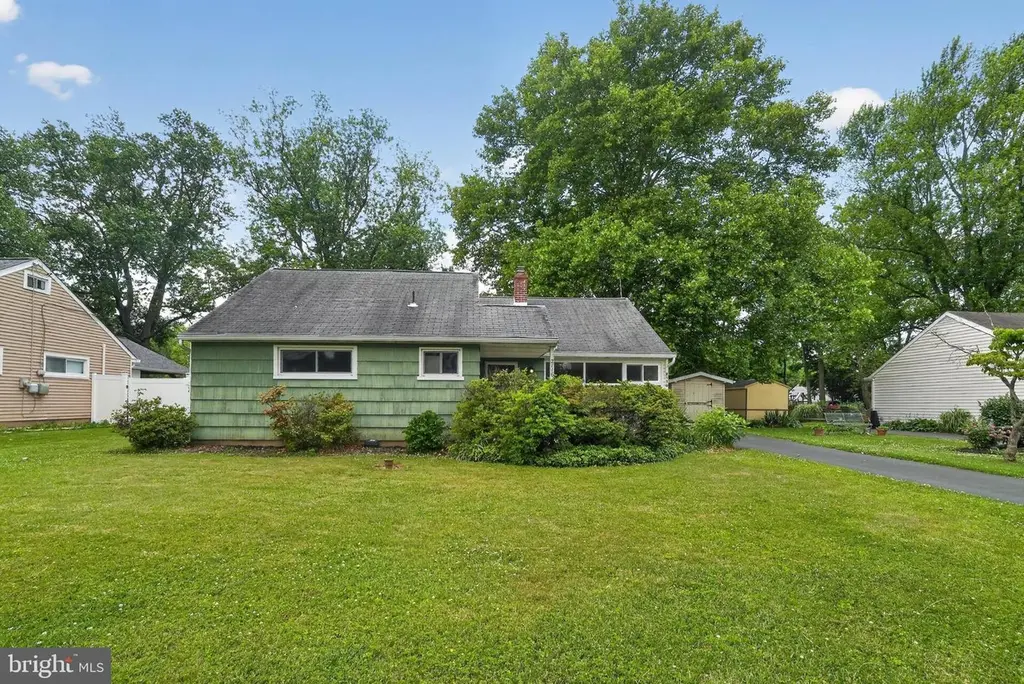
2116 Weber Ln · Trooper, PA
Flood risk 1/10 · Minimal
- FEMA flood zone
- X (unshaded)
- Chance of flooding over 30 yrs
- 0.0%
- Est. flood insurance / yr
- $507 – $1,088
Fire risk 1/10 · Minimal
- Est. fire insurance / yr
- $511 – $949
Heat risk 6/10 · Moderate
- Hot days now (above 102°F)
- 7 days/yr
- Hot days in 30 yrs
- 15 days/yr
Wind risk 6/10 · Moderate
- Chance of severe wind over 30 yrs
- 27.0%
Air-quality risk 4/10 · Minor
- Unhealthy air days now
- 3 days/yr
- Unhealthy air days in 30 yrs
- 5 days/yr
Risk factors via First Street. Map © Google.
Why this score? — see what drove the C- grade
The composite is a weighted blend of 9 inputs, each scored 0–100. Each bar is that input's sub-score; the figure is the points it added to the 100-point composite (weight × sub-score).
- ARV discount +15.0/15.0
- Cash flow +14.4/30.0
- 1% rule +4.7/10.0
- DSCR +4.4/10.0
- Livability +3.7/5.0
- Rent growth +3.6/5.0
- Condition / age +2.5/5.0
- Schools +2.2/10.0
- Appreciation +0.0/10.0
$225,000
🖨 Deal sheet (PDF) 📄 Offer letter ✓ Due diligence
Listing remarks
Unlock the potential of this 3-bedroom, 1.5-bath home in West Norriton Township—a prime opportunity for investors, contractors, flippers, or buyers looking to build sweat equity. Situated on a generous . 35-acre flat lot, this property offers a rare chance to create your ideal home or maximize your return on investment. Step inside and envision the possibilities. With solid bones and a functional layout, this home is ready for your updates, renovations, and personal touches. Whether you're planning a full rehab, cosmetic upgrades, or a long-term hold, this property delivers strong upside potential in a desirable Montgomery County location. The true standout feature is the expansive ba
Key facts
- Flat lot
- Expansive backyard
- 0.35 acre lot
Tags
Property features AI
Exterior
- Parking: Driveway parking for three vehicles; Three total garage and parking spaces
- Utilities: Public water; Public sewer; Electric service
- Home design: Detached home; Year built per assessor
- Construction: Vinyl siding; Slab foundation
- Exterior features: Lot dimensions approximately 75 x 0
Interior
- Bedrooms: Three bedrooms on the main level
- Bathrooms: One full bathroom; One half bathroom
- Heating & cooling: Forced air heating (natural gas); Central air conditioning (electric); Natural gas hot water
- Interior features: No basement; Living area determined from assessor records
Neighborhood map
What this means for you Summary
Snapshot
- This is a 3-bed/1.5-bath single-family listed at $225k.
Deal economics
- At list price, monthly cash flow is $45 ($540/yr) — positive.
- The deal already cash-flows at list — no discount required.
- To meet the 1% rule (rent ≥ 1% of price), the offer needs to be $218k (3.1% below list).
- Recommended offer: $218k (3.1% below list) — sets the bar for 1% rule.
- Cap rate 6.5% vs local median 2.1% in Trooper — top-decile yield for the area; either an underpriced asset or a hidden risk that comps aren't pricing in. Stress-test before assuming the spread holds.
Location & tenants
- Location reads 73/100 on livability (#557 in PA) — a middle-class / working-renter tenant base. Strengths: crime A+, employment A+, housing A+; Watch: schools D+, amenities F, commute F.
- Norristown Area SD (suburban): math 18% / reading 31% proficiency, ranked #466 of 539 in PA (top 86%) — low school quality limits family demand, transient renter base, plan for 1-2y turnover; 70% free/reduced lunch — lower-income household profile, screen leases tightly.
- Market conditions: Rents rising fast (+4.3%/yr); 155 active listings in the ZIP; 9 comparable units currently listed for rent nearby; rentals at typical pace (median 17d on market — plan ~3-4 weeks tenant-placement turnaround); solid renter incomes; 1,936 units permitted in Montgomery County in 2024 (530 in 5+ unit buildings).
Forward outlook
- Local home prices are declining (-3.0%/yr); year-one equity from $2k of loan paydown is wiped out by about $7k of value loss. Plan a longer hold.
- Montgomery County population projected at +5% by 2050 — modest demand growth; plan on rents tracking national, not racing it.
Negotiation context
- Only 1 days on market — expect competitive offers; lowballing is unlikely to land.
Risks & watch-outs
- Watch-outs: built in 1954 — expect roof / HVAC / electrical / plumbing capex.
- Climate carrying-cost: major wind risk, 27% chance of damaging wind over 30y; extreme-heat days projected 7→15/yr by 2055 (HVAC capex compounding) — expect insurance premiums to compound above CPI over the hold.
Questions for the listing agent
- Built in 1954 — when were the roof, HVAC, electrical panel, plumbing, and water heater last replaced?
- Is there a deadline driving the sale (1031 exchange, divorce, estate, relocation)? That informs how much negotiation room exists.
- Schools are D-rated, which usually means shorter tenancies and higher turnover. Who's the typical renter profile here, and what's been the actual vacancy rate?
- What's the average days-on-market for RENTAL listings here right now (not sales)? A rising rental-DOM trend means longer vacancies and softer asking-rent achievability than the comps imply.
- What's the recent tenant-quality profile in this submarket — average credit score on applications, eviction rate, late-payment / NSF rate, and stable-employment percentage? A property-management company in the area should have these aggregated.
- How much new for-sale + rental construction is in the pipeline within 1–3 miles? Heavy new supply typically softens prices + rents 12–24 months out; constrained supply supports both.
Investment metrics
- 1% rule
- 0.97% ✗
- Cap rate
- 6.53%
- Cash-on-cash
- 0.86%
- DSCR
- 1.04
- GRM
- 8.6
CMA / ARV
- ARV (on-the-fly)
- $373,468
- Comps found
- 12
Show comp detail 12 sales within ~0.75 mi
| Address | Dist | Beds/Ba | Sqft | Sold | Price | $/sf | Match |
|---|---|---|---|---|---|---|---|
| 36 Penfield | 0.36mi | 3/1.5 | 1,240 (-3%) | 10mo | $375,500 | $303 | 70 |
| 1957 Clearview | 0.47mi | 3/1.5 | 1,112 (-13%) | 3mo | $365,000 | $328 | 54 |
| 152 Liberty | 0.37mi | 3/1.5 | 1,392 (+9%) | 17mo | $365,000 | $262 | 54 |
| 25 Constitution | 0.49mi | 2/1.0 (-1) | 1,215 (-5%) | 11mo | $310,000 | $255 | 53 |
| 26 Union St | 0.46mi | 3/1.0 | 1,096 (-14%) | 0mo | $344,545 | $314 | 52 |
| 1817 Sterigere St | 0.74mi | 3/1.0 | 1,344 (+5%) | 4mo | $313,000 | $233 | 52 |
| 2 Republic Ave | 0.51mi | 3/2.0 | 1,386 (+8%) | 10mo | $405,000 | $292 | 51 |
| 112 N Whitehall Rd | 0.70mi | 4/— (+1) | 1,356 (+6%) | 2mo | $370,500 | $273 | 51 |
| 10 Jefferson Ave | 0.41mi | 3/2.0 | 1,142 (-11%) | 16mo | $350,000 | $306 | 48 |
| 34 Brant Rd | 0.67mi | 3/1.5 | 1,328 (+4%) | 19mo | $327,595 | $247 | 46 |
| 57 N Wakefield Rd | 0.61mi | 3/1.5 | 1,381 (+8%) | 15mo | $403,000 | $292 | 46 |
| 25 S Trooper Rd | 0.68mi | 2/1.5 (-1) | 1,363 (+7%) | 19mo | $365,500 | $268 | 36 |
Match score weights: distance 35% · size 25% · config 20% · recency 20%. Top-matched comps best support the ARV.
Projected returns pro-forma
-3.0% appreciation · 4.27% rent growth · sell at horizon
- IRR
- -13.4%
- Equity multiple
- 0.51×
- Total profit
- $-30,663
- Equity at exit
- $33,548
- IRR
- -2.4%
- Equity multiple
- 0.83×
- Total profit
- $-10,684
- Equity at exit
- $19,454
Cash invested: $63,000 (down + closing). Projections, not guarantees.
Landlord ↔ Tenant lean methodology
- Overall (STATE)
- 62 Landlord-Friendly
- State Pennsylvania
- 62 Landlord-Friendly · EVEN
- County
- — inherits STATE
- City
- — inherits STATE
ZIP-level market 19403
- Rents YoY
- 4.3%
- Active inventory
- 155
- Price-to-rent
- 8.6×
Monthly cashflow live
- Estimated rent
- $2,181 high interval (Pro) →
- Mortgage (P&I)
- −$1,180
- Tax from tax record
- −$404 /mo · $4,853/yr
- Insurance
- −$94
- HOA
- −$0
- Vacancy / Maint / Mgmt
- −$458
- Net cashflow
- $45
Break-even live
Sensitivity live
| Price | -10% $172 | -5% $109 | +0% $45 | +5% $-19 | +10% $-82 |
|---|---|---|---|---|---|
| Rent | -10% $-127 | -5% $-41 | +0% $45 | +5% $131 | +10% $217 |
| Rate | -1.0pp $158 | -0.5pp $102 | base $45 | +0.5pp $-13 | +1.0pp $-73 |
UW: 25.0% down · 7.5% · 30yr · 1.5% tax · 5.0% vac · 8.0% maint · 8.0% mgmt
Financing live
Cash to close
- Down payment
- $56,250
- Closing costs
- $6,750
- Reserves months
- —
- Total cash needed
- —
Loan-product check · same deal, 3 products live
Conventional
25% down · 7.5% · 30yr
- Down + closing
- —
- Monthly P&I
- —
- Monthly cashflow
- —
- DSCR
- —
- Eligible?
- —
Personal DTI + credit; lowest rate.
DSCR
20% down · 8.5% · 30yr
- Down + closing
- —
- Monthly P&I
- —
- Monthly cashflow
- —
- DSCR
- —
- Eligible?
- —
No personal income docs; deal must DSCR.
Hard money
10% down · 12.0% · 12mo
- Down + closing
- —
- Monthly P&I
- —
- Monthly cashflow
- —
- DSCR
- —
- Eligible?
- —
Short-term bridge; refi at stabilization.
Rent comps 9 comps
| Address | Beds | Baths | Sqft | Rent | $/sqft | DOM | Units | Dist |
|---|---|---|---|---|---|---|---|---|
| 54 Jefferson Ave West Norriton, PA | 2.0 | 1.0 | 952 | $1,950 | $2.05 | 26d | 1 | 0.40mi |
| 2070 Mill Rd West Norriton, PA | 1.0–3.0 | 1.0–2.0 | 927 | $2,490 | $2.68 | 0d | 10 | 0.87mi |
| 2437 Norrington Dr West Norriton, PA | 2.0 | 1.5 | 1280 | $2,300 | $1.80 | 17d | 1 | 0.92mi |
| 421 Wendover Dr Eagleville, PA | 2.0 | 1.0 | 903 | $1,940 | $2.15 | 7d | 1 | 1.08mi |
| 1029 Northridge Dr Unit 82B Norristown, PA | 2.0 | 1.0 | 903 | $1,950 | $2.16 | 45d | 1 | 1.09mi |
| 158 Woodstream Dr Unit 158 Norristown, PA | 3.0 | 2.0 | 1450 | $1,975 | $1.36 | 18d | 1 | 1.20mi |
| 18 Westover Club Dr Norristown, PA | 3.0 | 1.0–2.0 | 911 | $2,300 | $2.52 | 0d | 19 | 1.22mi |
| 1 Meadow Ln Jeffersonville, PA | 2.0 | 1.0 | 975 | $1,847 | $1.89 | 13d | 1 | 1.26mi |
| 1 Meadow Ln Jeffersonville, PA | 2.0 | 1.0 | 975 | $1,597 | $1.64 | 45d | 1 | 1.26mi |
Listing history 3 events
-
2026-06-21status $225,000 Pending 1 DOM
-
2026-06-18remarks 693-char remark
-
2026-06-18$225,000 Active 1 DOM
ⓘ Source: listings_history table (triggers on properties + properties_extension) + one-shot
backfill from property_details.listing_events for pre-trigger history.
Tax reassessment forecast PA · Partial reset (capped growth)
- Current annual tax
- $4,853 · $404/mo
- Projected year-2 tax
- $4,853 · $404/mo
- Expected delta
- $0/yr ($0/mo · 0.0%)
ⓘ Screening estimate from a state-policy table — verify with the county assessor before closing.
Climate risk First Street
- Flood 1/10 Low FEMA zone X (unshaded) · 0% chance over 30 yrs
- Wildfire 1/10 Low
- Heat 6/10 Major 7 d/yr ≥102°F today · 15 d/yr by 30 yrs out
- Wind 6/10 Major 27% chance of damaging wind over 30 yrs
- Air quality 4/10 Moderate 3 unhealthy d/yr today · 5 by 30 yrs out
Nearby sold comps map
Loading sold comps map…
Walkable amenities ~0.75 mi
Loading nearby amenities…
Taxation est. · year 1
- Rental income
- $26,174
- − Mortgage interest
- −$12,603
- − Property taxes
- −$4,853
- − Insurance
- −$1,125
- − Repairs & maintenance
- −$2,094
- − Management
- −$2,094
- − Depreciation
- −$6,545
- Taxable loss
- −$3,141
- Est. tax savings @ 24.0%
- +$754
- After-tax cash flow
- $1,294/yr
For passive investors: Depreciation is non-cash, so a rental often shows a tax loss while cash-flowing — sheltering income. Rental losses are passive: they offset passive income freely, and up to $25,000/yr can offset ordinary (W-2) income if you actively participate and your MAGI is under $100k (phasing out to $0 by $150k); unused losses carry forward. On sale, claimed depreciation is recaptured at up to 25%, and gains may owe capital-gains tax (a 1031 exchange can defer both). Figures are a year-1 estimate at your 24.0% rate — not tax advice; consult a CPA.
Schools (NCES district)
- District
- Norristown Area SD
- NCES district ID
- 4216980
- Math proficiency
- 18% ▼ -11.00%
- Reading proficiency
- 31% ▼ -14.00%
- Median HH income
- $56,024
- Composite
- 22.17/100
- National rank
- #8166
- State rank
- #466 of 539 in PA
Livability — Trooper
- Score
- 73/100
- State rank
- #557
- US rank
- #5191
Category grades
Schools grade is shown separately in the Schools card above.
Census & demographics
- County
- Montgomery County · 712,331 people
- Metro
- Philadelphia-Camden-Wilmington, PA-NJ-DE-MD
- Population (ZIP)
- 44,017
- Household income
- $104,071
- Rent vs Own
- Severe rent burden
- 1088.0
Population outlook (Montgomery County) Hauer SSP2
- Today (2025)
- 856,074 people
- By 2030
- 870,887 · +1.7%
- By 2040
- 891,195 · +4.1%
- By 2050
- 896,417 · +4.7%
- By 2075
- 903,212 · +5.5%
- By 2100
- 843,240 · -1.5%
Race, ethnicity, and origin ACS 2023
- Neighborhood character
- Predominantly White (75%)
- Race & ethnicity
- White 75% Asian 9% Black 8% Hispanic / Latino 6% Two or more races 4%
- Hispanic origin (detail)
- Mexican 2% Puerto Rican 2%
- Common ancestry
- Romanian 6% Slovak 2% Subsaharan African 1%
- Foreign-born
- 13% · Canada, China, South Korea
- Languages at home
- 85% English-only · Spanish 4% Other Indo-European 3% Other Asian/Pacific 3%
Political lean MEDSL · Montgomery
- 2024 margin
- Strong D (+22.8) · D 60.9% · R 38.1% · Other 1.1%
- 2008→2024 swing
- +2.0pp toward D · 2008: 20.8pp · 2024: 22.8pp
- All cycles
- 2024: D+22.8 2020: D+26.3 2016: D+21.1 2012: D+14.3 2008: D+20.8
Not yet ingested
- Civics
- —
Market trends
- HPI YoY
- ▼ -245.63%
- Current HPI
- 290.0201
- Rent YoY
- ▲ 4.27%
- Metro
- Philadelphia-Camden-Wilmington, PA-NJ-DE-MD
- State GDP YoY
- ▲ 1.68%
- F500 in state
- 34
Industry mix (Fortune 500 HQ in PA)
| Industry | F500 HQs | Revenue |
|---|---|---|
| Healthcare | 2 | $309B |
|
||
| Insurance | 2 | $27B |
|
||
| Telecommunications / Media | 1 | $124B |
|
||
| Industrial Distribution | 1 | $22B |
|
||
| Financial Services | 1 | $20B |
|
||
| Chemicals / Materials | 1 | $18B |
|
||
Price history
2 events — show timeline
- 2026-06-19 Pending — BRIGHT MLS
- 2026-06-18 Listed $225,000 BRIGHT MLS
Property tax history
+2.5%/yrLatest (2026): $4,853 · +2.0% YoY. Source: county tax records.
Cash-flow waterfall
monthlySold comps — $/sqft
last 12 mo · ≤1 miLoading sold comps…