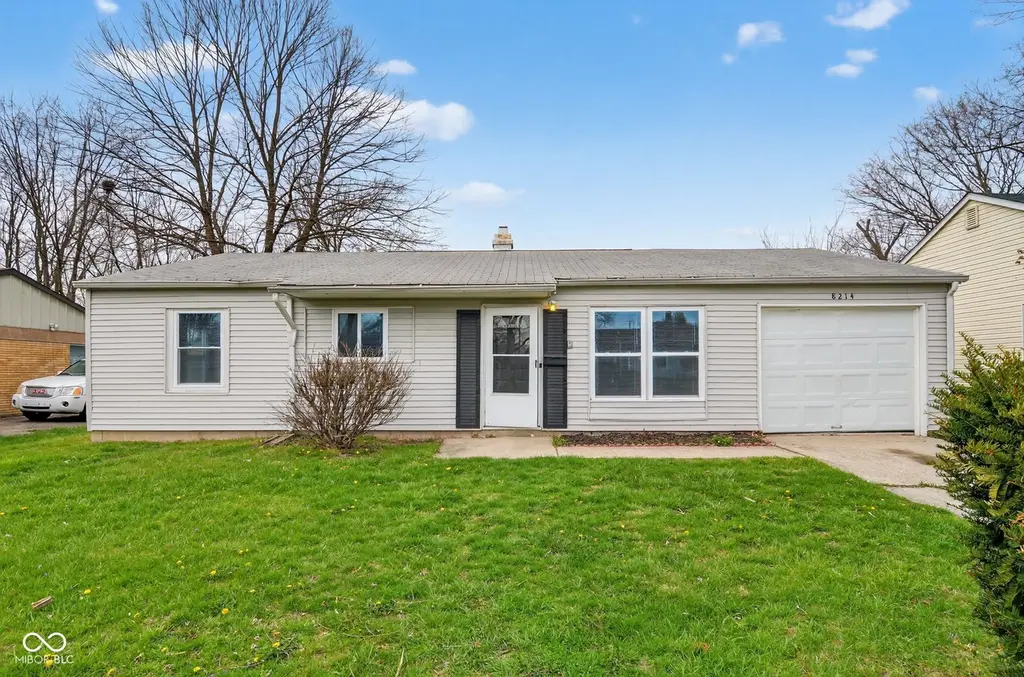
8214 Wysong Dr · Indianapolis city (balance), IN
Flood risk 1/10 · Minimal
- FEMA flood zone
- X (unshaded)
- Chance of flooding over 30 yrs
- 0.0%
- Est. flood insurance / yr
- $507 – $1,088
Fire risk 1/10 · Minimal
- Est. fire insurance / yr
- $717 – $1,331
Heat risk 3/10 · Minor
- Hot days now (above 101°F)
- 7 days/yr
- Hot days in 30 yrs
- 18 days/yr
Wind risk 2/10 · Minimal
- Chance of severe wind over 30 yrs
- 1.0%
Air-quality risk 3/10 · Minor
- Unhealthy air days now
- 3 days/yr
- Unhealthy air days in 30 yrs
- 4 days/yr
Risk factors via First Street. Map © Google.
Why this score? — see what drove the D- grade
The composite is a weighted blend of 9 inputs, each scored 0–100. Each bar is that input's sub-score; the figure is the points it added to the 100-point composite (weight × sub-score).
- Cash flow +10.7/30.0
- ARV discount +9.2/15.0
- 1% rule +3.5/10.0
- Rent growth +3.2/5.0
- DSCR +3.1/10.0
- Livability +2.5/5.0
- Condition / age +2.5/5.0
- Schools +1.4/10.0
- Appreciation +0.0/10.0
$154,900
🖨 Deal sheet (PDF) 📄 Offer letter ✓ Due diligence
Listing remarks MLS
BACK ON MARKET AT NO FAULT OF SELLER. Welcome to this charming 3-bedroom home featuring a practical floor plan and comfortable living spaces. Enjoy a generous yard ideal for relaxing or entertaining. Conveniently located near parks, shopping, dining, and schools within Indianapolis Public Schools. Easy access to major highways makes commuting a breeze. A great place to call home!
Key facts
- Near schools
- Near dining
- Generous yard
Tags
Neighborhood map
What this means for you Summary
Snapshot
- This is a 2-bed/2.0-bath single-family listed at $155k.
Deal economics
- At list price, monthly cash flow is $-74 ($-890/yr) — negative.
- To cash-flow at today's rent, offer at most $142k (8.5% below list).
- To meet the 1% rule (rent ≥ 1% of price), the offer needs to be $132k (14.7% below list).
- Recommended offer: $132k (14.7% below list) — sets the bar for 1% rule.
- Cap rate 5.7% vs local median 4.4% in Indianapolis city (balance) — meaningfully above typical; check what's discounted (condition, days-on-market, listing class) to confirm the premium yield is real.
Location & tenants
- Location reads: area grade D — affects rentability + tenant quality, not the cash-flow math above.
- Indianapolis Public Schools (urban): math 14% / reading 20% proficiency, ranked #286 of 301 in IN (top 95%) — low school quality limits family demand, transient renter base, plan for 1-2y turnover; 77% free/reduced lunch — lower-income household profile, screen leases tightly.
- Market conditions: Rents rising (+2.6%/yr); 143 active listings in the ZIP; 9 comparable units currently listed for rent nearby; rentals at typical pace (median 25d on market — plan ~3-4 weeks tenant-placement turnaround); 1,906 units permitted in Marion County in 2024 (621 in 5+ unit buildings).
Forward outlook
- Local home prices are declining (-3.0%/yr); year-one equity from $1k of loan paydown is wiped out by about $5k of value loss. Plan a longer hold.
- Marion County population projected at +18% by 2050 — long-run rental-demand tailwind backs the buy-and-hold thesis.
Negotiation context
- It's been on market 20 days — a 2% lower offer ($153k) is reasonable based on typical stale-listing flexibility.
- 4 sale attempts since 25y ago with the ask held roughly flat each time — persistent listings suggest the price (not the market) is what's stuck; bring a comps-based counter.
- Current owner paid $66k; list at $155k implies a 136% gain — meaningful room to come down on a strong offer.
Questions for the listing agent
- What do current leases actually rent for vs. the listed asking? Can we see a recent rent roll and the last 12 months of T-12 income?
- Built in 1967 — when were the roof, HVAC, electrical panel, plumbing, and water heater last replaced?
- Is there a deadline driving the sale (1031 exchange, divorce, estate, relocation)? That informs how much negotiation room exists.
- The area grade is low — what's the realistic commute time and amenity access for the typical tenant pool here? Any planned neighborhood developments (good or bad) we should know about?
- What's the average days-on-market for RENTAL listings here right now (not sales)? A rising rental-DOM trend means longer vacancies and softer asking-rent achievability than the comps imply.
- What's the recent tenant-quality profile in this submarket — average credit score on applications, eviction rate, late-payment / NSF rate, and stable-employment percentage? A property-management company in the area should have these aggregated.
- How much new for-sale + rental construction is in the pipeline within 1–3 miles? Heavy new supply typically softens prices + rents 12–24 months out; constrained supply supports both.
Investment metrics
- 1% rule
- 0.85% ✗
- Cap rate
- 5.72%
- Cash-on-cash
- -2.05%
- DSCR
- 0.91
- GRM
- 9.8
CMA / ARV
- ARV (median comp)
- $161,098
- List price
- $154,900
- Delta
- -3.85%
- Verdict
- FAIR
- Comps
- 20 within 1.0 mi
Show comp detail 12 sales within ~0.75 mi
| Address | Dist | Beds/Ba | Sqft | Sold | Price | $/sf | Match |
|---|---|---|---|---|---|---|---|
| 8214 Wysong Dr | 0.00mi | 3/2.0 (+1) | 1,073 (0%) | 1mo | $152,000 | $142 | 94 |
| 8115 Barry Rd | 0.08mi | 3/2.0 (+1) | 1,073 (0%) | 2mo | $169,900 | $158 | 90 |
| 2337 Sickle Rd | 0.16mi | 3/1.0 (+1) | 1,073 (0%) | 2mo | $149,900 | $140 | 82 |
| 2626 Ebbie Rd | 0.19mi | 3/1.0 (+1) | 1,073 (0%) | 3mo | $161,500 | $151 | 80 |
| 7803 Wysong Dr | 0.38mi | 3/1.0 (+1) | 1,073 (0%) | 1mo | $155,000 | $144 | 72 |
| 7848 Souter Dr | 0.29mi | 3/1.0 (+1) | 1,140 (+6%) | 2mo | $133,000 | $117 | 66 |
| 2459 N Eaton Ave | 0.14mi | 3/1.0 (+1) | 1,175 (+10%) | 7mo | $145,000 | $123 | 62 |
| 7816 Wysong Dr | 0.36mi | 3/1.0 (+1) | 1,140 (+6%) | 6mo | $144,000 | $126 | 59 |
| 7822 Wysong Dr | 0.35mi | 3/1.0 (+1) | 1,140 (+6%) | 8mo | $162,000 | $142 | 58 |
| 7818 Cullen Dr | 0.39mi | 3/1.0 (+1) | 1,140 (+6%) | 9mo | $160,000 | $140 | 55 |
| 3117 Roseway Dr | 0.73mi | 3/1.0 (+1) | 1,000 (-7%) | 8mo | $169,900 | $170 | 39 |
| 7902 Renfrew Dr | 0.67mi | 3/1.0 (+1) | 1,200 (+12%) | 10mo | $195,000 | $163 | 32 |
Match score weights: distance 35% · size 25% · config 20% · recency 20%. Top-matched comps best support the ARV.
Projected returns pro-forma
-3.0% appreciation · 2.63% rent growth · sell at horizon
- IRR
- -20.1%
- Equity multiple
- 0.30×
- Total profit
- $-30,268
- Equity at exit
- $23,096
- IRR
- -13.9%
- Equity multiple
- 0.21×
- Total profit
- $-34,239
- Equity at exit
- $13,393
Cash invested: $43,372 (down + closing). Projections, not guarantees.
Landlord ↔ Tenant lean methodology
- Overall (STATE)
- 90 Strongly Landlord-Friendly
- State Indiana
- 90 Strongly Landlord-Friendly · R+11
- County
- — inherits STATE
- City
- — inherits STATE
ZIP-level market 46219
- Rents YoY
- 2.6%
- Active inventory
- 143
- Price-to-rent
- 9.8×
Monthly cashflow live
- Estimated rent
- $1,321 high interval (Pro) →
- Mortgage (P&I)
- −$812
- Tax from tax record
- −$241 /mo · $2,891/yr
- Insurance
- −$65
- HOA
- −$0
- Vacancy / Maint / Mgmt
- −$277
- Net cashflow
- $-74
Break-even live
Sensitivity live
| Price | -10% $13 | -5% $-30 | +0% $-74 | +5% $-118 | +10% $-162 |
|---|---|---|---|---|---|
| Rent | -10% $-179 | -5% $-126 | +0% $-74 | +5% $-22 | +10% $30 |
| Rate | -1.0pp $4 | -0.5pp $-35 | base $-74 | +0.5pp $-114 | +1.0pp $-155 |
UW: 25.0% down · 7.5% · 30yr · 1.5% tax · 5.0% vac · 8.0% maint · 8.0% mgmt
Financing live
Cash to close
- Down payment
- $38,725
- Closing costs
- $4,647
- Reserves months
- —
- Total cash needed
- —
Loan-product check · same deal, 3 products live
Conventional
25% down · 7.5% · 30yr
- Down + closing
- —
- Monthly P&I
- —
- Monthly cashflow
- —
- DSCR
- —
- Eligible?
- —
Personal DTI + credit; lowest rate.
DSCR
20% down · 8.5% · 30yr
- Down + closing
- —
- Monthly P&I
- —
- Monthly cashflow
- —
- DSCR
- —
- Eligible?
- —
No personal income docs; deal must DSCR.
Hard money
10% down · 12.0% · 12mo
- Down + closing
- —
- Monthly P&I
- —
- Monthly cashflow
- —
- DSCR
- —
- Eligible?
- —
Short-term bridge; refi at stabilization.
Rent comps 9 comps
| Address | Beds | Baths | Sqft | Rent | $/sqft | DOM | Units | Dist |
|---|---|---|---|---|---|---|---|---|
| 7910 Roy Rd Indianapolis, IN | 3.0 | 1.0 | 1073 | $1,445 | $1.35 | 24d | 1 | 0.30mi |
| 7845 Bonita Ct Indianapolis, IN | 3.0 | 1.0 | 1073 | $1,400 | $1.30 | 8d | 1 | 0.34mi |
| 3226 Wellington Ave Indianapolis, IN | 3.0 | 1.0 | 900 | $1,149 | $1.28 | 11d | 1 | 0.95mi |
| 7838 Ridgewood Dr Indianapolis, IN | 3.0 | 2.0 | 936 | $1,540 | $1.65 | 24d | 1 | 1.00mi |
| 7838 Ridgewood Dr Indianapolis, IN | 3.0 | 2.0 | 936 | $1,540 | $1.65 | 44d | 1 | 1.00mi |
| 3513 Roseway Dr Indianapolis, IN | 3.0 | 2.0 | 1216 | $1,600 | $1.32 | 18d | 1 | 1.27mi |
| 3540 Dubarry Ct Indianapolis, IN | 3.0 | 2.0 | 1297 | $1,400 | $1.08 | 24d | 1 | 1.39mi |
| 8203 Penway St Indianapolis, IN | 3.0 | 1.5 | 1360 | $1,500 | $1.10 | 24d | 1 | 1.41mi |
| 3631 Decamp Dr Indianapolis, IN | 3.0 | 1.0 | 1000 | $1,335 | $1.33 | 24d | 1 | 1.49mi |
Listing history 10 events
-
2026-05-04status Pending 382-char remark
Show marketing remark (382 chars)
BACK ON MARKET AT NO FAULT OF SELLER. Welcome to this charming 3-bedroom home featuring a practical floor plan and comfortable living spaces. Enjoy a generous yard ideal for relaxing or entertaining. Conveniently located near parks, shopping, dining, and schools within Indianapolis Public Schools. Easy access to major highways makes commuting a breeze. A great place to call home!
-
2026-04-26status Active 382-char remark
Show marketing remark (382 chars)
BACK ON MARKET AT NO FAULT OF SELLER. Welcome to this charming 3-bedroom home featuring a practical floor plan and comfortable living spaces. Enjoy a generous yard ideal for relaxing or entertaining. Conveniently located near parks, shopping, dining, and schools within Indianapolis Public Schools. Easy access to major highways makes commuting a breeze. A great place to call home!
-
2026-04-15status Pending 382-char remark
Show marketing remark (382 chars)
BACK ON MARKET AT NO FAULT OF SELLER. Welcome to this charming 3-bedroom home featuring a practical floor plan and comfortable living spaces. Enjoy a generous yard ideal for relaxing or entertaining. Conveniently located near parks, shopping, dining, and schools within Indianapolis Public Schools. Easy access to major highways makes commuting a breeze. A great place to call home!
-
2026-04-03$154,900 Active 382-char remark
Show marketing remark (382 chars)
BACK ON MARKET AT NO FAULT OF SELLER. Welcome to this charming 3-bedroom home featuring a practical floor plan and comfortable living spaces. Enjoy a generous yard ideal for relaxing or entertaining. Conveniently located near parks, shopping, dining, and schools within Indianapolis Public Schools. Easy access to major highways makes commuting a breeze. A great place to call home!
-
2020-10-29soldstatus $65,500 Sold 596-char remark
Show marketing remark (596 chars)
Spacious home ready for your touch. Huge living room great for entertaining or just relaxing at home. Lots of space for the upcoming holidays. Eat in kitchen with a huge pantry for all your storage needs and bulk purchases. Laundry conveniently located near the back door ready to accept all your mess. Lots of storage closets in this home. 2 bedrooms and 2 full bathrooms so everyone has their own space. Could convert the extra space in living room back into a 3rd bedroom by adding one wall. Fenced in back yard and a covered patio along with great neighbors! Possession at closing !
-
2020-10-22status Pending 596-char remark
Show marketing remark (596 chars)
Spacious home ready for your touch. Huge living room great for entertaining or just relaxing at home. Lots of space for the upcoming holidays. Eat in kitchen with a huge pantry for all your storage needs and bulk purchases. Laundry conveniently located near the back door ready to accept all your mess. Lots of storage closets in this home. 2 bedrooms and 2 full bathrooms so everyone has their own space. Could convert the extra space in living room back into a 3rd bedroom by adding one wall. Fenced in back yard and a covered patio along with great neighbors! Possession at closing !
-
2020-10-15$89,000 Active 596-char remark
Show marketing remark (596 chars)
Spacious home ready for your touch. Huge living room great for entertaining or just relaxing at home. Lots of space for the upcoming holidays. Eat in kitchen with a huge pantry for all your storage needs and bulk purchases. Laundry conveniently located near the back door ready to accept all your mess. Lots of storage closets in this home. 2 bedrooms and 2 full bathrooms so everyone has their own space. Could convert the extra space in living room back into a 3rd bedroom by adding one wall. Fenced in back yard and a covered patio along with great neighbors! Possession at closing !
-
2002-04-09soldstatus $58,171
-
2002-03-29soldstatus $58,500
-
2001-05-24$62,900
ⓘ Source: listings_history table (triggers on properties + properties_extension) + one-shot
backfill from property_details.listing_events for pre-trigger history.
Tax reassessment forecast IN · Partial reset (capped growth)
- Current annual tax
- $2,891 · $241/mo
- Projected year-2 tax
- $2,891 · $241/mo
- Expected delta
- $0/yr ($0/mo · 0.0%)
ⓘ Screening estimate from a state-policy table — verify with the county assessor before closing.
Climate risk First Street
- Flood 1/10 Low FEMA zone X (unshaded) · 0% chance over 30 yrs
- Wildfire 1/10 Low
- Heat 3/10 Moderate 7 d/yr ≥101°F today · 18 d/yr by 30 yrs out
- Wind 2/10 Low 100% chance of damaging wind over 30 yrs
- Air quality 3/10 Moderate 3 unhealthy d/yr today · 4 by 30 yrs out
Nearby sold comps map
Loading sold comps map…
Walkable amenities ~0.75 mi
Loading nearby amenities…
Taxation est. · year 1
- Rental income
- $15,852
- − Mortgage interest
- −$8,677
- − Property taxes
- −$2,891
- − Insurance
- −$774
- − Repairs & maintenance
- −$1,268
- − Management
- −$1,268
- − Depreciation
- −$4,506
- Taxable loss
- −$3,533
- Est. tax savings @ 24.0%
- +$848
- After-tax cash flow
- $-43/yr
For passive investors: Depreciation is non-cash, so a rental often shows a tax loss while cash-flowing — sheltering income. Rental losses are passive: they offset passive income freely, and up to $25,000/yr can offset ordinary (W-2) income if you actively participate and your MAGI is under $100k (phasing out to $0 by $150k); unused losses carry forward. On sale, claimed depreciation is recaptured at up to 25%, and gains may owe capital-gains tax (a 1031 exchange can defer both). Figures are a year-1 estimate at your 24.0% rate — not tax advice; consult a CPA.
Schools (NCES district)
- District
- Indianapolis Public Schools
- NCES district ID
- 1804770
- Math proficiency
- 14% ▼ -7.00%
- Reading proficiency
- 20% ▼ -3.00%
- Median HH income
- $32,034
- Composite
- 13.69/100
- National rank
- #9499
- State rank
- #286 of 301 in IN
Livability — Indianapolis city (balance)
No livability data for this city. (Only ~50 U.S. cities are tracked.)
Census & demographics
- Census place
- Indianapolis city (balance), IN
- County
- Marion County · 998,460 people
- City population
- 881,119
- Metro
- Indianapolis-Carmel-Anderson, IN
- Population (ZIP)
- 38,855
- Household income
- $60,803
- Rent vs Own
- Severe rent burden
- 2191.0
Population outlook (Marion County) Hauer SSP2
- Today (2025)
- 1,025,572 people
- By 2030
- 1,065,727 · +3.9%
- By 2040
- 1,141,577 · +11.3%
- By 2050
- 1,208,920 · +17.9%
- By 2075
- 1,367,288 · +33.3%
- By 2100
- 1,438,201 · +40.2%
Race, ethnicity, and origin ACS 2023
- Neighborhood character
- Diverse neighborhood (Simpson 0.63)
- Race & ethnicity
- White 54% Black 22% Hispanic / Latino 18% Two or more races 9%
- Hispanic origin (detail)
- Mexican 10% Puerto Rican 1%
- Common ancestry
- Slovak 2% Romanian 2% Lithuanian 2%
- Foreign-born
- 10% · Canada
- Languages at home
- 85% English-only · Spanish 14%
Political lean MEDSL · Marion
- 2024 margin
- Strong D (+27.7) · D 63.0% · R 35.3% · Other 1.7%
- 2008→2024 swing
- -0.7pp no change · 2008: 28.4pp · 2024: 27.7pp
- All cycles
- 2024: D+27.7 2020: D+29.1 2016: D+22.8 2012: D+22.2 2008: D+28.4
Not yet ingested
- Civics
- —
Market trends
- HPI YoY
- ▼ -199.69%
- Current HPI
- 289.8788
- Rent YoY
- ▲ 2.63%
- Metro
- Indianapolis-Carmel-Anderson, IN
- State GDP YoY
- ▲ 2.90%
- F500 in state
- 18
Industry mix (Fortune 500 HQ in IN)
| Industry | F500 HQs | Revenue |
|---|---|---|
| Industrial Machinery | 2 | $37B |
|
||
| Healthcare | 1 | $177B |
|
||
| Pharmaceuticals | 1 | $45B |
|
||
| Metals / Steel | 1 | $18B |
|
||
| Agriculture | 1 | $17B |
|
||
| Packaging | 1 | $12B |
|
||
Price history
+146.3% since first listed10 events — show timeline
- 2026-05-04 Pending — MIBOR as Distributed by MLS Grid
- 2026-04-26 Relisted — MIBOR as Distributed by MLS Grid
- 2026-04-15 Pending — MIBOR as Distributed by MLS Grid
- 2026-04-03 Listed $154,900 MIBOR as Distributed by MLS Grid
- 2020-10-29 Sold (MLS) $65,500 MIBOR as Distributed by MLS Grid
- 2020-10-22 Pending — MIBOR as Distributed by MLS Grid
- 2020-10-15 Listed $89,000 MIBOR as Distributed by MLS Grid
- 2002-04-09 Sold (Public Records) $58,171 Public Records
- 2002-03-29 Sold (MLS) $58,500 MIBOR as Distributed by MLS Grid
- 2001-05-24 Listed $62,900 MIBOR as Distributed by MLS Grid
Property tax history
+19.8%/yrLatest (2025): $2,891 · +15.8% YoY. Source: county tax records.
Cash-flow waterfall
monthlySold comps — $/sqft
last 12 mo · ≤1 miLoading sold comps…