 🏗️ New Construction
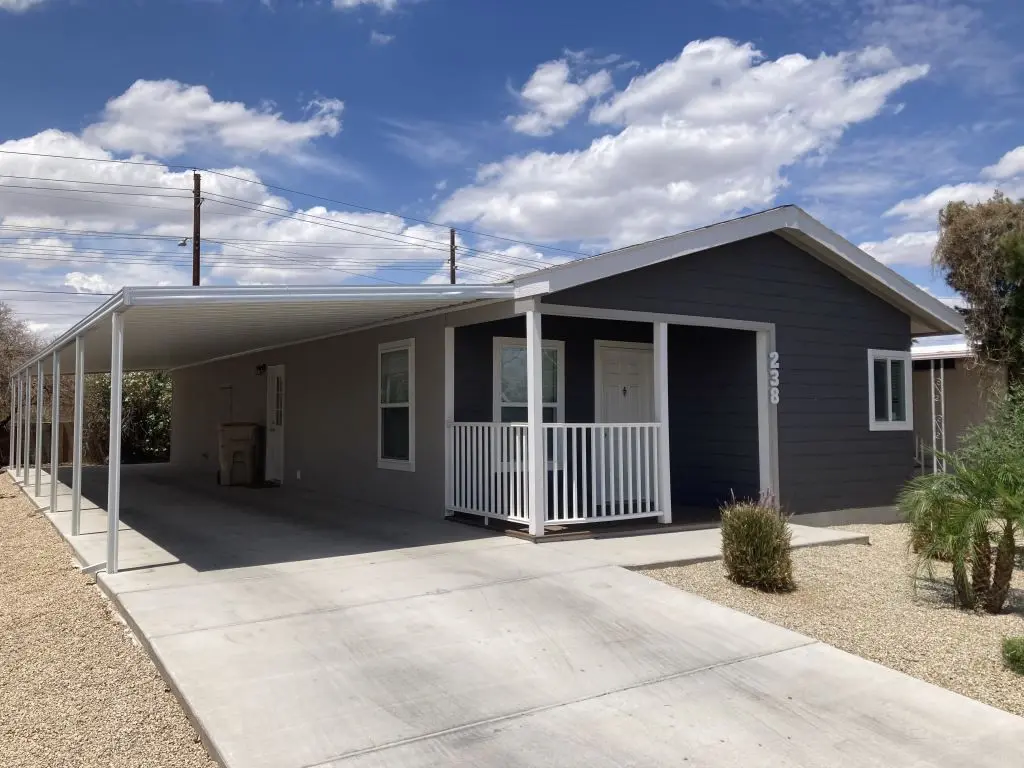
Sierra Vista Plan · Peoria, AZ
Flood risk 1/10 · Minimal
- FEMA flood zone
- X (shaded)
- Chance of flooding over 30 yrs
- 0.0%
- Est. flood insurance / yr
- $507 – $1,088
Fire risk 1/10 · Minimal
- Est. fire insurance / yr
- $610 – $1,132
Heat risk 9/10 · Severe
- Hot days now (above 113°F)
- 6 days/yr
- Hot days in 30 yrs
- 16 days/yr
Wind risk 1/10 · Minimal
- Chance of severe wind over 30 yrs
- —
Air-quality risk 2/10 · Minimal
- Unhealthy air days now
- 1 days/yr
- Unhealthy air days in 30 yrs
- 1 days/yr
Risk factors via First Street. Map © Google.
Why this score? — see what drove the B grade
The composite is a weighted blend of 9 inputs, each scored 0–100. Each bar is that input's sub-score; the figure is the points it added to the 100-point composite (weight × sub-score).
- Cash flow +30.0/30.0
- 1% rule +10.0/10.0
- DSCR +10.0/10.0
- ARV discount +7.5/15.0
- Condition / age +4.0/5.0
- Livability +3.8/5.0
- Schools +3.5/10.0
- Rent growth +2.7/5.0
- Appreciation +0.0/10.0
$189,900
🖨 Deal sheet 📄 Offer letter ✓ Due diligence
Listing remarks
55+ age qualified community. Tentatively available 6/15/2026. Find your place in the 55+ community of Casa del Sol Resort West I, a well-maintained, professionally managed manufactured home community. Right now, we have a 2023 model year, 1250.80 sq. ft. , 3 bed/2 bath home available to lease. You owe it to yourself to call our representatives and schedule a viewing of this home before someone else snaps it up! Lush green surroundings, pool, spa, lounge, gym, huge clubhouse for activities, library, pool table and card room, bocci ball, 9 hole pitch and putt, near fabulous find dining, shopping, sports centers, casinos and so much more nearby. Just a few touch ups and you can find this home
Key facts
- Listed 14 days
Property features AI
Finance
- Financial info: List price $189,900
Exterior
- Home design: Single-family plan (Sierra Vista); Located at N 91st Ave, Peoria, AZ 85345
- Exterior features: Living area approximately 1250
Interior
- Bedrooms: 3 bedrooms
- Bathrooms: 2 bathrooms (full)
- Interior features: Plan: Sierra Vista (new construction)
Neighborhood map
What this means for you Summary
Snapshot
- This is a 3-bed/2.0-bath manufactured listed at $190k. Condition is rated good.
Deal economics
- At list price, monthly cash flow is $875 ($11k/yr) — positive.
- The deal already cash-flows at list — no discount required.
- Meets the 1% rule at list price ($2k rent vs $190k).
- Cap rate 17.2% vs local median 3.3% in Peoria — top-decile yield for the area; either an underpriced asset or a hidden risk that comps aren't pricing in. Stress-test before assuming the spread holds.
Location & tenants
- Location reads 76/100 on livability (#14 in AZ, #3,603 nationally) — a middle-class / working-renter tenant base. Strengths: housing A+, commute A, employment A; Watch: cost of living C-, amenities D, health & safety F.
- Peoria Unified School District (4237) (suburban): math 36% / reading 42% proficiency, ranked #64 of 249 in AZ (top 26%) — families likely to look elsewhere, expect single-tenant / working-renter base with shorter leases.
- Market conditions: Rents flat; 333 active listings in the ZIP; 40 comparable units currently listed for rent nearby; rentals at typical pace (median 24d on market — plan ~3-4 weeks tenant-placement turnaround); 36,011 units permitted in Maricopa County in 2024 (12,801 in 5+ unit buildings).
- This rent runs 35% of the median local income ($67k/yr) — at the standard rent-burdened threshold; future hikes will face affordability resistance.
Forward outlook
- Local home prices are declining (-3.0%/yr); year-one equity from $666 of loan paydown is wiped out by about $3k of value loss. Plan a longer hold.
- Maricopa County population projected at +38% by 2050 — long-run rental-demand tailwind backs the buy-and-hold thesis.
- At projected returns (-3.0% appreciation + 0.6% rent growth), your $27k cash investment doubles in ~4 years — after that, you're playing with house money.
Negotiation context
- Only 14 days on market — expect competitive offers; lowballing is unlikely to land.
Risks & watch-outs
- Climate carrying-cost: extreme-heat days projected 6→16/yr by 2055 (HVAC capex compounding) — expect insurance premiums to compound above CPI over the hold.
Questions for the listing agent
- Is there a deadline driving the sale (1031 exchange, divorce, estate, relocation)? That informs how much negotiation room exists.
- Schools are B-rated — typically a magnet for longer-tenancy family renters. What's the average tenant stay here, and is there a school-zone premium baked into asking?
- What's the average days-on-market for RENTAL listings here right now (not sales)? A rising rental-DOM trend means longer vacancies and softer asking-rent achievability than the comps imply.
- What's the recent tenant-quality profile in this submarket — average credit score on applications, eviction rate, late-payment / NSF rate, and stable-employment percentage? A property-management company in the area should have these aggregated.
- How much new for-sale + rental construction is in the pipeline within 1–3 miles? Heavy new supply typically softens prices + rents 12–24 months out; constrained supply supports both.
Investment metrics
- 1% rule
- 2.03% ✓
- Cap rate
- 17.21%
- Cash-on-cash
- 38.98%
- DSCR
- 2.73
- GRM
- 4.1
CMA / ARV
- ARV (on-the-fly)
- $96,250
- Comps found
- 12
Show comp detail 12 sales within ~0.75 mi
| Address | Dist | Beds/Ba | Sqft | Sold | Price | $/sf | Match |
|---|---|---|---|---|---|---|---|
| 11411 N 91st Ave #195 | 0.11mi | 2/2.0 (-1) | 1,232 (-1%) | 7mo | $42,000 | $34 | 82 |
| 11411 N 91st Ave #80 | 0.16mi | 3/2.0 | 1,344 (+8%) | 4mo | $43,000 | $32 | 77 |
| 10951 N 91st Ave #61 | 0.24mi | 3/2.0 | 1,320 (+6%) | 4mo | $79,000 | $60 | 76 |
| 11411 N 91st Ave #218 | 0.02mi | 2/2.0 (-1) | 1,344 (+8%) | 7mo | $52,000 | $39 | 75 |
| 10951 N 91st Ave #218 | 0.31mi | 3/2.0 | 1,168 (-7%) | 1mo | $114,000 | $98 | 74 |
| 10951 N 91 Ave #23 | 0.24mi | 3/2.0 | 1,152 (-8%) | 4mo | $85,000 | $74 | 72 |
| 10951 N 91st Ave #16 | 0.35mi | 3/2.0 | 1,344 (+8%) | 3mo | $65,000 | $48 | 69 |
| 11411 N 91st Ave #225 | 0.16mi | 2/2.0 (-1) | 1,144 (-8%) | 7mo | $88,000 | $77 | 68 |
| 10951 N 91st Ave #245 | 0.31mi | 4/2.0 (+1) | 1,344 (+8%) | 6mo | $135,000 | $100 | 63 |
| 11275 N 99th Ave #118 | 0.74mi | 3/2.0 | 1,273 (+2%) | 2mo | $265,000 | $208 | 60 |
| 11275 N 99th Ave #1 | 0.72mi | 3/2.0 | 1,152 (-8%) | 8mo | $210,000 | $182 | 47 |
| 11275 N 99th Ave #119 | 0.74mi | 3/2.0 | 1,392 (+11%) | 4mo | $265,000 | $190 | 43 |
Match score weights: distance 35% · size 25% · config 20% · recency 20%. Top-matched comps best support the ARV.
Projected returns pro-forma
-3.0% appreciation · 0.62% rent growth · sell at horizon
- IRR
- 32.5%
- Equity multiple
- 2.32×
- Total profit
- $35,627
- Equity at exit
- $14,351
- IRR
- 38.2%
- Equity multiple
- 4.16×
- Total profit
- $85,092
- Equity at exit
- $8,322
Cash invested: $26,950 (down + closing). Projections, not guarantees.
Landlord ↔ Tenant lean methodology
- Overall (STATE)
- 87 Strongly Landlord-Friendly
- State Arizona
- 87 Strongly Landlord-Friendly · R+3
- County
- — inherits STATE
- City
- — inherits STATE
ZIP-level market 85345
- Home prices YoY
- -19.8%
- Rents YoY
- 0.6%
- Active inventory
- 333
- Price-to-rent
- 8.1×
Monthly cashflow live
- Estimated rent
- $1,950 high interval (Pro) →
- Mortgage (P&I)
- −$505
- Tax est. 1.5%
- −$120 /mo · $1,444/yr
- Insurance
- −$40
- HOA
- −$0
- Vacancy / Maint / Mgmt
- −$410
- Net cashflow
- $875
Break-even live
UW: 25.0% down · 7.5% · 30yr · 1.5% tax · 5.0% vac · 8.0% maint · 8.0% mgmt
Financing live
Cash to close
- Down payment
- $24,062
- Closing costs
- $2,888
- Reserves months
- —
- Total cash needed
- —
Loan-product check · same deal, 3 products live
Conventional
25% down · 7.5% · 30yr
- Down + closing
- —
- Monthly P&I
- —
- Monthly cashflow
- —
- DSCR
- —
- Eligible?
- —
Personal DTI + credit; lowest rate.
DSCR
20% down · 8.5% · 30yr
- Down + closing
- —
- Monthly P&I
- —
- Monthly cashflow
- —
- DSCR
- —
- Eligible?
- —
No personal income docs; deal must DSCR.
Hard money
10% down · 12.0% · 12mo
- Down + closing
- —
- Monthly P&I
- —
- Monthly cashflow
- —
- DSCR
- —
- Eligible?
- —
Short-term bridge; refi at stabilization.
Rent comps 40 comps
| Address | Beds | Baths | Sqft | Rent | $/sqft | DOM | Units | Dist |
|---|---|---|---|---|---|---|---|---|
| 11411 N 91st Ave Unit 134 Peoria, AZ | 3.0 | 2.0 | 1310 | $1,599 | $1.22 | 43d | 1 | 0.02mi |
| 9221 W Gary Rd Peoria, AZ | 4.0 | 1.0 | 1300 | $2,000 | $1.54 | 43d | 1 | 0.23mi |
| 8821 W Sahuaro Dr Peoria, AZ | 3.0 | 2.0 | 1074 | $1,595 | $1.49 | 2d | 1 | 0.46mi |
| 8821 W Sahuaro Dr Peoria, AZ | 3.0 | 2.0 | 1074 | $1,595 | $1.49 | 24d | 1 | 0.46mi |
| 8763 W Paradise Dr Peoria, AZ | 3.0 | 2.0 | 1575 | $1,800 | $1.14 | 43d | 1 | 0.54mi |
| 8782 W Shaw Butte Dr Peoria, AZ | 3.0 | 2.0 | 1575 | $2,200 | $1.40 | 24d | 1 | 0.59mi |
| 8642 W Laurel Ln Peoria, AZ | 4.0 | 2.0 | 1680 | $2,300 | $1.37 | 43d | 1 | 0.62mi |
| 8650 W Peoria Ave Peoria, AZ | 1.0–2.0 | 1.0–2.0 | 836 | $1,492 | $1.78 | 2d | 19 | 0.67mi |
| 8543 W Cherry Hills Dr Peoria, AZ | 4.0 | 2.0 | 1680 | $2,341 | $1.39 | 24d | 1 | 0.70mi |
| 8621 W Shaw Butte Dr Peoria, AZ | 3.0 | 2.0 | 1546 | $1,975 | $1.28 | 18d | 1 | 0.70mi |
| 8930 W Monroe St Peoria, AZ | 3.0 | 2.0 | 1300 | $1,899 | $1.46 | 43d | 2 | 0.70mi |
| 8930 W Monroe St Peoria, AZ | 3.0 | 2.0 | 1300 | $2,099 | $1.61 | 23d | 1 | 0.70mi |
| 8630 W Shaw Butte Dr Peoria, AZ | 3.0 | 2.0 | 1284 | $1,951 | $1.52 | 12d | 1 | 0.71mi |
| 8560 W Peoria Ave Peoria, AZ | 2.0 | 1.0 | 888 | $1,450 | $1.63 | 1d | 8 | 0.73mi |
| 10221 N 87th Ln Peoria, AZ | 3.0 | 2.0 | 1232 | $2,059 | $1.67 | 43d | 1 | 0.76mi |
| 10101 N 91st Ave #109 Peoria, AZ | 2.0 | 2.5 | 1161 | $1,395 | $1.20 | 2d | 1 | 0.83mi |
| 10316 N 94th Ln Peoria, AZ | 3.0 | 2.0 | 1352 | $2,000 | $1.48 | 24d | 1 | 0.87mi |
| 9002 W Malapai Dr Peoria, AZ | 3.0 | 2.0 | 1270 | $2,040 | $1.61 | 20d | 1 | 0.88mi |
| 9426 W Monroe St Peoria, AZ | 3.0 | 3.5 | 1405 | $1,800 | $1.28 | 16d | 1 | 0.90mi |
| 8368 W Paradise Dr Peoria, AZ | 3.0 | 2.0 | 1666 | $2,125 | $1.28 | 43d | 1 | 0.92mi |
| 8311 W Edwards St Peoria, AZ | 3.0 | 2.0 | 1242 | $2,100 | $1.69 | 24d | 1 | 0.93mi |
| 12751 N Plaza Del Rio Blvd Peoria, AZ | 1.0–2.0 | 1.0–2.0 | 1007 | $1,890 | $1.88 | 1d | 10 | 0.95mi |
| 11635 N 83rd Ave Peoria, AZ | 4.0 | 2.0 | 1740 | $2,070 | $1.19 | 5d | 1 | 0.97mi |
| 11110 N 82nd Ln Peoria, AZ | 3.0 | 2.0 | 1350 | $1,899 | $1.41 | 24d | 1 | 0.98mi |
| 12160 N 83rd Dr Peoria, AZ | 4.0 | 2.0 | 1818 | $1,995 | $1.10 | 21d | 1 | 0.99mi |
| 11175 N 82nd Ln Peoria, AZ | 3.0 | 2.0 | 1821 | $2,390 | $1.31 | 1d | 1 | 0.99mi |
| 12976 N 88th Ln Peoria, AZ | 3.0 | 2.5 | 1765 | $1,825 | $1.03 | 43d | 1 | 1.01mi |
| 12990 N 88th Ln Peoria, AZ | 3.0 | 2.5 | 1624 | $1,995 | $1.23 | 21d | 1 | 1.01mi |
| 8773 W Dahlia Dr Peoria, AZ | 3.0 | 2.5 | 1439 | $2,200 | $1.53 | 4d | 1 | 1.03mi |
| 12972 N 88th Ave Peoria, AZ | 3.0 | 2.5 | 1522 | $2,000 | $1.31 | 43d | 1 | 1.04mi |
| 9323 W Ironwood Dr Peoria, AZ | 3.0 | 2.0 | 1306 | $1,985 | $1.52 | 23d | 1 | 1.05mi |
| 9323 W Ironwood Dr Peoria, AZ | 3.0 | 2.0 | 1306 | $2,085 | $1.60 | 43d | 1 | 1.05mi |
| 8834 W Purdue Ave Peoria, AZ | 3.0 | 2.0 | 1319 | $1,800 | $1.36 | 3d | 1 | 1.05mi |
| 8609 W Dahlia Dr Peoria, AZ | 3.0 | 3.0 | 1431 | $1,550 | $1.08 | 43d | 1 | 1.11mi |
| 10104 N 96th Dr Unit A Peoria, AZ | 2.0 | 2.0 | 1072 | $1,750 | $1.63 | 24d | 1 | 1.12mi |
| 12480 N 83rd Dr Peoria, AZ | 3.0 | 2.0 | 1410 | $1,895 | $1.34 | 2d | 1 | 1.14mi |
| 9427 W Ironwood Dr Peoria, AZ | 4.0 | 2.0 | 1591 | $1,944 | $1.22 | 10d | 1 | 1.14mi |
| 9607 N 88th Dr Peoria, AZ | 4.0 | 2.0 | 1541 | $1,989 | $1.29 | 20d | 1 | 1.15mi |
| 11014 N 81st Ave Peoria, AZ | 3.0 | 3.0 | 1133 | $1,699 | $1.50 | 5d | 1 | 1.19mi |
| 8770 W Wood Dr Peoria, AZ | 4.0 | 2.5 | 1765 | $2,025 | $1.15 | 5d | 1 | 1.20mi |
Listing history 11 events
-
2026-06-18days on market $189,900 Active 14 DOM
-
2026-06-17days on market $189,900 Active 13 DOM
-
2026-06-16days on market $189,900 Active 12 DOM
-
2026-06-15days on market $189,900 Active 11 DOM
-
2026-06-13days on market $189,900 Active 9 DOM
-
2026-06-13days on market $189,900 Active 8 DOM
-
2026-06-09days on market $189,900 Active 5 DOM
-
2026-06-08days on market $189,900 Active 4 DOM
-
2026-06-07days on market $189,900 Active 3 DOM
-
2026-06-04remarks 699-char remark
-
2026-06-04$189,900 Active 1 DOM
ⓘ Source: listings_history table (triggers on properties + properties_extension) + one-shot
backfill from property_details.listing_events for pre-trigger history.
Climate risk First Street
- Flood 1/10 Low FEMA zone X (shaded) · 0% chance over 30 yrs
- Wildfire 1/10 Low
- Heat 9/10 Extreme 6 d/yr ≥113°F today · 16 d/yr by 30 yrs out
- Wind 1/10 Low
- Air quality 2/10 Low 1 unhealthy d/yr today · 1 by 30 yrs out
Nearby sold comps map
Loading sold comps map…
Walkable amenities ~0.75 mi
Loading nearby amenities…
Taxation est. · year 1
- Rental income
- $23,401
- − Mortgage interest
- −$5,391
- − Property taxes
- −$1,444
- − Insurance
- −$481
- − Repairs & maintenance
- −$1,872
- − Management
- −$1,872
- − Depreciation
- −$2,800
- Taxable income
- $9,541
- Est. tax owed @ 24.0%
- −$2,290
- After-tax cash flow
- $8,215/yr
For passive investors: Depreciation is non-cash, so a rental often shows a tax loss while cash-flowing — sheltering income. Rental losses are passive: they offset passive income freely, and up to $25,000/yr can offset ordinary (W-2) income if you actively participate and your MAGI is under $100k (phasing out to $0 by $150k); unused losses carry forward. On sale, claimed depreciation is recaptured at up to 25%, and gains may owe capital-gains tax (a 1031 exchange can defer both). Figures are a year-1 estimate at your 24.0% rate — not tax advice; consult a CPA.
Condition & rehab AI · 13 photos
This 55+ community home is in good condition with modern amenities and a well-maintained exterior. A fresh coat of paint and new carpets would significantly enhance its curb appeal and resale value.
Value-add opportunities
- Both paint exterior — enhances curb appeal and resale value
- Both replace carpets — improves comfort and reduces allergens
Renovation cost estimate screening
Value-add ROI direction
- Both paint exterior — enhances curb appeal and resale value ↑
- Both replace carpets — improves comfort and reduces allergens ↑
ⓘ Cost ranges are severity-bucket heuristics (US national rule-of-thumb). Get contractor quotes + a written scope before underwriting a rehab budget.
Schools (NCES district)
- District
- Peoria Unified School District (4237)
- NCES district ID
- 0406250
- Math proficiency
- 36% ▼ -14.00%
- Reading proficiency
- 42% ▼ -8.00%
- Median HH income
- $60,171
- Composite
- 34.62/100
- National rank
- #5152
- State rank
- #64 of 249 in AZ
Livability — Peoria
- Score
- 76/100
- State rank
- #14
- US rank
- #3603
Category grades
Schools grade is shown separately in the Schools card above.
Census & demographics
- Census place
- Peoria, AZ
- County
- Maricopa County · 4,537,380 people
- City population
- 206,687
- Metro
- Phoenix-Mesa-Chandler, AZ
- Population (ZIP)
- 60,918
- Household income
- $67,380
- Rent vs Own
- Severe rent burden
- 1879.0
Population outlook (Maricopa County) Hauer SSP2
- Today (2025)
- 4,979,203 people
- By 2030
- 5,378,229 · +8.0%
- By 2040
- 6,156,598 · +23.6%
- By 2050
- 6,872,376 · +38.0%
- By 2075
- 8,401,270 · +68.7%
- By 2100
- 9,247,439 · +85.7%
Race, ethnicity, and origin ACS 2023
- Neighborhood character
- Diverse neighborhood (Simpson 0.62)
- Race & ethnicity
- White 51% Hispanic / Latino 34% Two or more races 14% Black 5% Asian 4% Native American 2%
- Hispanic origin (detail)
- Mexican 29%
- Common ancestry
- Romanian 2% Italian 2% Slovak 1%
- Foreign-born
- 13% · Canada, Vietnam
- Languages at home
- 76% English-only · Spanish 18% Other Indo-European 1% Vietnamese 1%
Political lean MEDSL · Maricopa
- 2024 margin
- Toss-up / Even · D 47.7% · R 51.2% · Other 1.1%
- 2008→2024 swing
- +7.1pp toward D · 2008: -10.6pp · 2024: -3.5pp
- All cycles
- 2024: R+3.5 2020: D+2.2 2016: R+3.5 2012: R+12.0 2008: R+10.6
Not yet ingested
- Civics
- —
Market trends
- HPI YoY
- ▼ -80.77%
- Current HPI
- 328.1069
- Rent YoY
- ▲ 0.62%
- Metro
- Phoenix-Mesa-Chandler, AZ
- State GDP YoY
- ▲ 4.54%
- F500 in state
- 20
Industry mix (Fortune 500 HQ in AZ)
| Industry | F500 HQs | Revenue |
|---|---|---|
| Technology | 2 | $13B |
|
||
| Mining / Metals | 1 | $23B |
|
||
| Environmental Services | 1 | $16B |
|
||
| Metals / Steel | 1 | $14B |
|
||
| Technology Distribution | 1 | $9B |
|
||
| Homebuilding | 1 | $8B |
|
||
Cash-flow waterfall
monthlySold comps — $/sqft
last 12 mo · ≤1 miLoading sold comps…