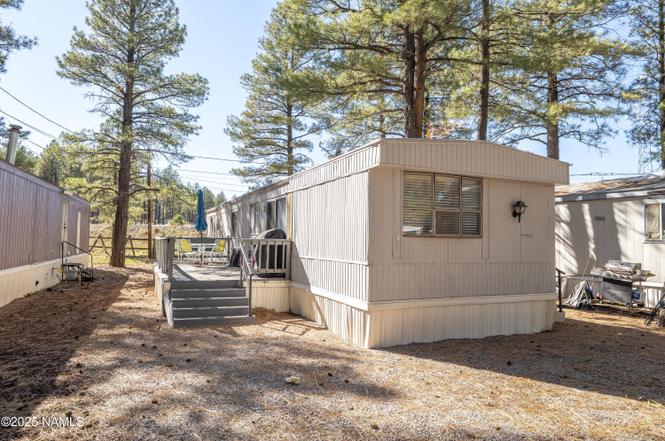
2500 W Route 66 #83 · Flagstaff, AZ
Flood risk 1/10 · Minimal
- FEMA flood zone
- X (unshaded)
- Chance of flooding over 30 yrs
- 0.0%
- Est. flood insurance / yr
- $507 – $1,088
Fire risk 8/10 · Major
- Est. fire insurance / yr
- $610 – $1,132
Heat risk 1/10 · Minimal
- Hot days now (above 86°F)
- 6 days/yr
- Hot days in 30 yrs
- 14 days/yr
Wind risk 1/10 · Minimal
- Chance of severe wind over 30 yrs
- —
Air-quality risk 1/10 · Minimal
- Unhealthy air days now
- 0 days/yr
- Unhealthy air days in 30 yrs
- 0 days/yr
Risk factors via First Street. Map © Google.
Why this score? — see what drove the B- grade
The composite is a weighted blend of 9 inputs, each scored 0–100. Each bar is that input's sub-score; the figure is the points it added to the 100-point composite (weight × sub-score).
- Cash flow +30.0/30.0
- 1% rule +10.0/10.0
- DSCR +10.0/10.0
- ARV discount +7.6/15.0
- Livability +3.1/5.0
- Rent growth +2.6/5.0
- Condition / age +2.5/5.0
- Schools +2.1/10.0
- Appreciation +0.0/10.0
$89,500
🖨 Deal sheet (PDF) 📄 Offer letter ✓ Due diligence
Listing remarks
One of the most desirable lots in the park, this light and bright all-electric home offers comfortable, easy living with no neighbors behind you. The inviting front-kitchen floor plan features a large bay window and abundant windows throughout, filling the home with natural light and showcasing the surrounding ponderosa pines. Enjoy a spacious covered porch, wall air conditioning, and parking for up to four cars, all tucked into a heavily treed setting that provides both beauty and privacy. Come experience this special property for yourself. Lot rent is 795/month and includes water, sewer, and trash. Buyer must be approved by the park prior to submitting an offer; see requirements at https:
Key facts
- Natural light
- Large bay window
- Built 1978
Tags
Property features AI
Finance
- Other: Land lease in effect
- HOA & community: Located in Hidden Hollow Mobile Home Park
Exterior
- Utilities: Electricity available
- Home design: Single wide mobile home
- Construction: Crawl space foundation; Year built provided by owner
- Exterior features: Deck; Level topography; Forest view; Paved, publicly maintained road access
Interior
- Kitchen: Electric range
- Flooring: Carpet; Ceramic tile
- Bathrooms: 2 bathrooms
- Heating & cooling: Forced air heating; Wall/window cooling unit(s)
- Interior features: Aluminum-framed windows; Carpet and ceramic tile floors; Electric range
Neighborhood map
What this means for you Summary
Snapshot
- This is a 2-bed/2.0-bath manufactured listed at $90k.
Deal economics
- At list price, monthly cash flow is $1k ($13k/yr) — positive.
- The deal already cash-flows at list — no discount required.
- Meets the 1% rule at list price ($2k rent vs $90k).
- Cap rate 20.8% vs local median 2.1% in Flagstaff — top-decile yield for the area; either an underpriced asset or a hidden risk that comps aren't pricing in. Stress-test before assuming the spread holds.
Location & tenants
- Location reads 61/100 on livability (#167 in AZ) — a middle-class / working-renter tenant base. Strengths: housing B; Watch: employment C-, crime D-, amenities F.
- Flagstaff Unified District (4192) (urban): math 18% / reading 29% proficiency, ranked #158 of 249 in AZ (top 64%) — low school quality limits family demand, transient renter base, plan for 1-2y turnover.
- Zoned schools: Manuel Demiguel Elementary School (math 39% / reading 55%, grade D-, #308 of 1,109 statewide, top 29%, 579 students, 19% FRL); Mount Elden Middle School (math 16% / reading 23%, grade F, #134 of 218 statewide, top 63%, 757 students, 51% FRL); Flagstaff High School (math 22% / reading 27%, grade F, #154 of 381 statewide, top 53%, 1,620 students, 25% FRL).
- Market conditions: Rents flat; 281 active listings in the ZIP; 11 comparable units currently listed for rent nearby; rentals lingering (median 46d on market — plan ~5-8 weeks vacancy on turnover, expect pricing pressure); 100% of comp listings sitting > 30 days — soft ceiling on asking rent; 698 units permitted in Coconino County in 2024 (354 in 5+ unit buildings).
- This rent runs 40% of the median local income ($65k/yr) — at the standard rent-burdened threshold; future hikes will face affordability resistance.
Forward outlook
- Local home prices are declining (-3.0%/yr); year-one equity from $619 of loan paydown is wiped out by about $3k of value loss. Plan a longer hold.
- Coconino County population projected at +20% by 2050 — long-run rental-demand tailwind backs the buy-and-hold thesis.
- At projected returns (-3.0% appreciation + 0.6% rent growth), your $25k cash investment doubles in ~3 years — after that, you're playing with house money.
Negotiation context
- Only 3 days on market — expect competitive offers; lowballing is unlikely to land.
- 2 sale attempts with the ask held roughly flat each time — persistent listings suggest the price (not the market) is what's stuck; bring a comps-based counter.
Risks & watch-outs
- Climate carrying-cost: severe wildfire risk — expect insurance premiums to compound above CPI over the hold.
Questions for the listing agent
- Built in 1978 — when were the roof, HVAC, electrical panel, plumbing, and water heater last replaced?
- Is there a deadline driving the sale (1031 exchange, divorce, estate, relocation)? That informs how much negotiation room exists.
- Crime grade is D in this area — have there been break-ins, vandalism, or insurance claims at this property in the last 3 years? What carrier currently insures it and at what premium?
- What's the average days-on-market for RENTAL listings here right now (not sales)? A rising rental-DOM trend means longer vacancies and softer asking-rent achievability than the comps imply.
- What's the recent tenant-quality profile in this submarket — average credit score on applications, eviction rate, late-payment / NSF rate, and stable-employment percentage? A property-management company in the area should have these aggregated.
- How much new for-sale + rental construction is in the pipeline within 1–3 miles? Heavy new supply typically softens prices + rents 12–24 months out; constrained supply supports both.
Investment metrics
- 1% rule
- 2.40% ✓
- Cap rate
- 20.80%
- Cash-on-cash
- 51.80%
- DSCR
- 3.30
- GRM
- 3.5
CMA / ARV
- ARV (on-the-fly)
- $89,600
- Comps found
- 7
Show comp detail 7 sales within ~0.75 mi
| Address | Dist | Beds/Ba | Sqft | Sold | Price | $/sf | Match |
|---|---|---|---|---|---|---|---|
| 2500 W Route 66 #1 | 0.00mi | 2/2.0 | 896 (0%) | 9mo | $70,000 | $78 | 92 |
| 2500 W Route 66 #65 | 0.00mi | 2/2.0 | 896 (0%) | 11mo | $100,000 | $112 | 91 |
| 2500 W Route 66 #27 | 0.00mi | 3/2.0 (+1) | 896 (0%) | 12mo | $84,000 | $94 | 85 |
| 2500 W Route 66 #21 | 0.07mi | 2/1.0 | 791 (-12%) | 1mo | $69,900 | $88 | 73 |
| 2500 W Route 66 #49 | 0.17mi | 3/2.0 (+1) | 896 (0%) | 17mo | $90,000 | $100 | 73 |
| 2500 W Rte 66 -- #23 | 0.17mi | 3/2.0 (+1) | 869 (-3%) | 22mo | $112,000 | $129 | 64 |
| 2401 W Route 66 Dr #66 | 0.36mi | 2/2.0 | 868 (-3%) | 22mo | $161,500 | $186 | 60 |
Match score weights: distance 35% · size 25% · config 20% · recency 20%. Top-matched comps best support the ARV.
Projected returns pro-forma
-3.0% appreciation · 0.55% rent growth · sell at horizon
- IRR
- 46.9%
- Equity multiple
- 2.97×
- Total profit
- $49,246
- Equity at exit
- $13,345
- IRR
- 51.6%
- Equity multiple
- 5.45×
- Total profit
- $111,496
- Equity at exit
- $7,738
Cash invested: $25,060 (down + closing). Projections, not guarantees.
Landlord ↔ Tenant lean methodology
- Overall (STATE)
- 87 Strongly Landlord-Friendly
- State Arizona
- 87 Strongly Landlord-Friendly · R+3
- County
- — inherits STATE
- City
- — inherits STATE
ZIP-level market 86001
- Rents YoY
- 0.6%
- Active inventory
- 281
- Price-to-rent
- 3.5×
Monthly cashflow live
- Estimated rent
- $2,152 high interval (Pro) →
- Mortgage (P&I)
- −$469
- Tax est. 1.5%
- −$112 /mo · $1,342/yr
- Insurance
- −$37
- HOA
- −$0
- Vacancy / Maint / Mgmt
- −$452
- Net cashflow
- $1,082
Break-even live
Sensitivity live
| Price | -10% $1,144 | -5% $1,113 | +0% $1,082 | +5% $1,051 | +10% $1,020 |
|---|---|---|---|---|---|
| Rent | -10% $912 | -5% $997 | +0% $1,082 | +5% $1,167 | +10% $1,252 |
| Rate | -1.0pp $1,127 | -0.5pp $1,104 | base $1,082 | +0.5pp $1,059 | +1.0pp $1,035 |
UW: 25.0% down · 7.5% · 30yr · 1.5% tax · 5.0% vac · 8.0% maint · 8.0% mgmt
Financing live
Cash to close
- Down payment
- $22,375
- Closing costs
- $2,685
- Reserves months
- —
- Total cash needed
- —
Loan-product check · same deal, 3 products live
Conventional
25% down · 7.5% · 30yr
- Down + closing
- —
- Monthly P&I
- —
- Monthly cashflow
- —
- DSCR
- —
- Eligible?
- —
Personal DTI + credit; lowest rate.
DSCR
20% down · 8.5% · 30yr
- Down + closing
- —
- Monthly P&I
- —
- Monthly cashflow
- —
- DSCR
- —
- Eligible?
- —
No personal income docs; deal must DSCR.
Hard money
10% down · 12.0% · 12mo
- Down + closing
- —
- Monthly P&I
- —
- Monthly cashflow
- —
- DSCR
- —
- Eligible?
- —
Short-term bridge; refi at stabilization.
Rent comps 11 comps
| Address | Beds | Baths | Sqft | Rent | $/sqft | DOM | Units | Dist |
|---|---|---|---|---|---|---|---|---|
| 2701 S Woody Mountain Rd Flagstaff, AZ | 1.0–3.0 | 1.0–2.0 | 1078 | $2,642 | $2.45 | 46d | 77 | 0.35mi |
| 2292 S Alvan Clark Blvd Flagstaff, AZ | 2.0–3.0 | 1.0–2.0 | 978 | $1,473 | $1.51 | 46d | 12 | 0.47mi |
| 1385 W University Ave Flagstaff, AZ | 2.0 | 2.0 | 906 | $1,725 | $1.90 | 46d | 3 | 0.99mi |
| 1000 W Forest Meadows St Flagstaff, AZ | 2.0 | 2.0 | 947 | $1,925 | $2.03 | 46d | 1 | 1.11mi |
| 927 W Forest Meadows St Flagstaff, AZ | 1.0–2.0 | 1.0–2.0 | 958 | $2,806 | $2.93 | 46d | 11 | 1.16mi |
| 1580 S Plaza Way Flagstaff, AZ | 1.0–2.0 | 1.0–2.0 | 875 | $2,455 | $2.81 | 46d | 12 | 1.25mi |
| 923 W University Ave Flagstaff, AZ | 1.0–2.0 | 1.0–2.0 | 877 | $2,304 | $2.63 | 46d | 36 | 1.25mi |
| 800 W Forest Meadows St Flagstaff, AZ | 1.0–3.0 | 1.0–2.0 | 847 | $2,548 | $3.01 | 46d | 32 | 1.31mi |
| 1515 S Yale St Flagstaff, AZ | 2.0 | 1.0–2.0 | 860 | $1,740 | $2.02 | 46d | 6 | 1.32mi |
| 813 W University Ave Flagstaff, AZ | 2.0 | 1.0–2.0 | 567 | $1,840 | $3.25 | 46d | 1 | 1.33mi |
| 700 W University Ave Flagstaff, AZ | 2.0 | 1.0–2.0 | 675 | $1,735 | $2.57 | 46d | 1 | 1.33mi |
Listing history 3 events
-
2026-06-21days on market $89,500 Active 3 DOM
-
2026-06-19remarks 699-char remark
-
2026-06-19$89,500 Active 1 DOM
ⓘ Source: listings_history table (triggers on properties + properties_extension) + one-shot
backfill from property_details.listing_events for pre-trigger history.
Climate risk First Street
- Flood 1/10 Low FEMA zone X (unshaded) · 0% chance over 30 yrs
- Wildfire 8/10 Severe
- Heat 1/10 Low 6 d/yr ≥86°F today · 14 d/yr by 30 yrs out
- Wind 1/10 Low
- Air quality 1/10 Low 0 unhealthy d/yr today · 0 by 30 yrs out
Nearby sold comps map
Loading sold comps map…
Walkable amenities ~0.75 mi
Loading nearby amenities…
Taxation est. · year 1
- Rental income
- $25,826
- − Mortgage interest
- −$5,013
- − Property taxes
- −$1,342
- − Insurance
- −$448
- − Repairs & maintenance
- −$2,066
- − Management
- −$2,066
- − Depreciation
- −$2,604
- Taxable income
- $12,287
- Est. tax owed @ 24.0%
- −$2,949
- After-tax cash flow
- $10,032/yr
For passive investors: Depreciation is non-cash, so a rental often shows a tax loss while cash-flowing — sheltering income. Rental losses are passive: they offset passive income freely, and up to $25,000/yr can offset ordinary (W-2) income if you actively participate and your MAGI is under $100k (phasing out to $0 by $150k); unused losses carry forward. On sale, claimed depreciation is recaptured at up to 25%, and gains may owe capital-gains tax (a 1031 exchange can defer both). Figures are a year-1 estimate at your 24.0% rate — not tax advice; consult a CPA.
Schools (NCES district)
- District
- Flagstaff Unified District (4192)
- NCES district ID
- 0402860
- Math proficiency
- 18% ▼ -16.00%
- Reading proficiency
- 29% ▼ -10.00%
- Median HH income
- $53,510
- Composite
- 21.11/100
- National rank
- #8437
- State rank
- #158 of 249 in AZ
Livability — Flagstaff
- Score
- 61/100
- State rank
- #167
- US rank
- #18308
Category grades
Schools grade is shown separately in the Schools card above.
Census & demographics
- County
- Coconino County · 91,667 people
- City population
- 91,667
- Metro
- Flagstaff, AZ
- Population (ZIP)
- 37,312
- Household income
- $64,626
- Rent vs Own
- Severe rent burden
- 3117.0
Population outlook (Coconino County) Hauer SSP2
- Today (2025)
- 150,645 people
- By 2030
- 156,857 · +4.1%
- By 2040
- 168,714 · +12.0%
- By 2050
- 181,082 · +20.2%
- By 2075
- 218,399 · +45.0%
- By 2100
- 238,853 · +58.6%
Race, ethnicity, and origin ACS 2023
- Neighborhood character
- Diverse neighborhood (Simpson 0.59)
- Race & ethnicity
- White 62% Hispanic / Latino 15% Native American 12% Two or more races 9% Asian 3% Black 2%
- Hispanic origin (detail)
- Mexican 10%
- Common ancestry
- Italian 2% Slovak 2% Romanian 2%
- Foreign-born
- 6% · Canada, China, Jamaica
- Languages at home
- 84% English-only · Spanish 8% Other Indo-European 1% Chinese 1%
Political lean MEDSL · Coconino
- 2024 margin
- D (+19.9) · D 59.2% · R 39.4% · Other 1.4%
- 2008→2024 swing
- +2.9pp toward D · 2008: 17.0pp · 2024: 19.9pp
- All cycles
- 2024: D+19.9 2020: D+24.1 2016: D+19.4 2012: D+14.9 2008: D+17.0
Not yet ingested
- Civics
- —
Market trends
- HPI YoY
- ▼ -488.37%
- Current HPI
- 393.2551
- Rent YoY
- ▲ 0.55%
- Metro
- Flagstaff, AZ
- State GDP YoY
- ▲ 4.54%
- F500 in state
- 20
Industry mix (Fortune 500 HQ in AZ)
| Industry | F500 HQs | Revenue |
|---|---|---|
| Technology | 2 | $13B |
|
||
| Mining / Metals | 1 | $23B |
|
||
| Environmental Services | 1 | $16B |
|
||
| Metals / Steel | 1 | $14B |
|
||
| Technology Distribution | 1 | $9B |
|
||
| Homebuilding | 1 | $8B |
|
||
Price history
-0.4% since first listed4 events — show timeline
- 2026-06-17 Listed $89,500 NAZMLS
- 2026-02-09 Listing Removed — NAZMLS
- 2025-11-18 Price Changed $79,900 NAZMLS
- 2025-10-23 Listed $89,900 NAZMLS
Cash-flow waterfall
monthlySold comps — $/sqft
last 12 mo · ≤1 miLoading sold comps…