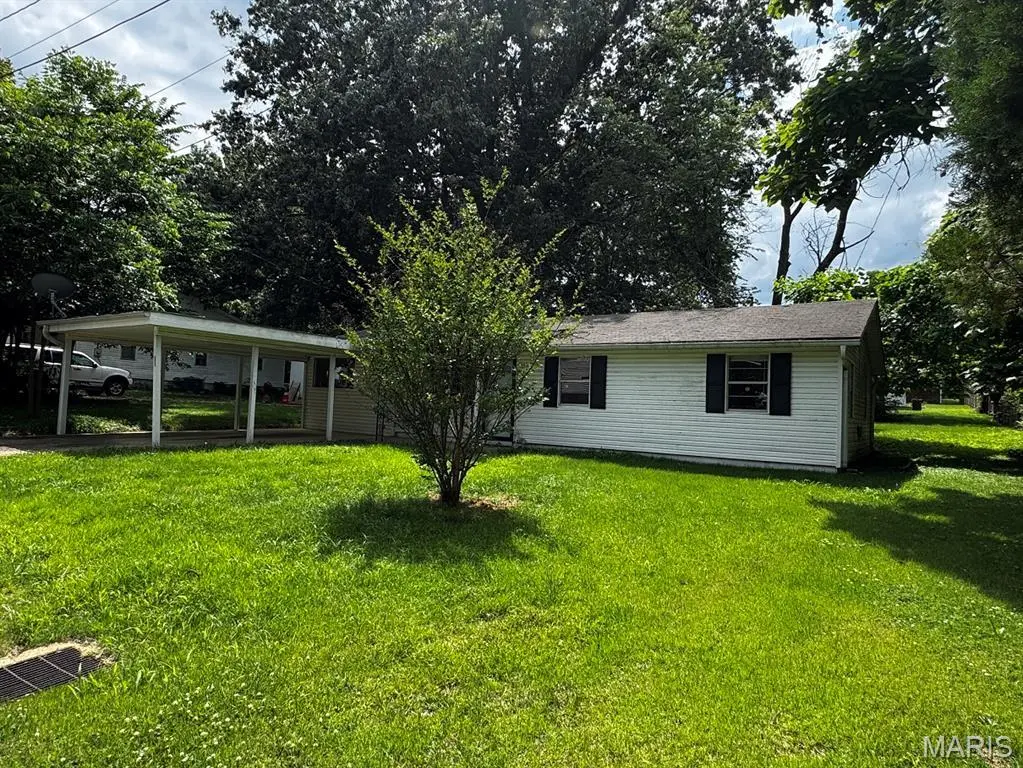
1705 Minola St · Poplar Bluff, MO
Flood risk 1/10 · Minimal
- FEMA flood zone
- X (unshaded)
- Chance of flooding over 30 yrs
- 0.0%
- Est. flood insurance / yr
- $507 – $1,088
Fire risk 2/10 · Minimal
- Est. fire insurance / yr
- $1,054 – $1,958
Heat risk 5/10 · Moderate
- Hot days now (above 108°F)
- 7 days/yr
- Hot days in 30 yrs
- 20 days/yr
Wind risk 3/10 · Minor
- Chance of severe wind over 30 yrs
- 6.0%
Air-quality risk 2/10 · Minimal
- Unhealthy air days now
- 0 days/yr
- Unhealthy air days in 30 yrs
- 2 days/yr
Risk factors via First Street. Map © Google.
Why this score? — see what drove the B- grade
The composite is a weighted blend of 9 inputs, each scored 0–100. Each bar is that input's sub-score; the figure is the points it added to the 100-point composite (weight × sub-score).
- Cash flow +30.0/30.0
- 1% rule +10.0/10.0
- DSCR +10.0/10.0
- ARV discount +7.5/15.0
- Schools +3.5/10.0
- Livability +3.5/5.0
- Rent growth +2.5/5.0
- Condition / age +2.5/5.0
- Appreciation +0.0/10.0
$44,900
🖨 Deal sheet (PDF) 📄 Offer letter ✓ Due diligence
Listing remarks MLS
Clean, Cute, Affordable!! Located in the heart of Poplar Bluff is your clean 3 bedroom, 1 full bath home with nice usable yard with shed.
Key facts
- Open floor plan
- Storage shed
- Outdoor space
Tags
Property features AI
Finance
- Other: Above-grade finished area reported as 1,152 (assessor); Lot dimensions approximately 67x150, about 0.23 acre
- Financial info: Lease not considered
Exterior
- Parking: Carport (1 space)
- Utilities: Public water; Public sewer; Electricity connected (electric: Other)
- Home design: Single-family residence; One story; Private ownership; Property listed as fixer
- Construction: Vinyl siding; Shingle roof
- Exterior features: Patio; Porch; City lot; Workshop on the property; Asphalt road frontage (city street)
Interior
- Kitchen: Dishwasher; Gas oven; Refrigerator
- Bedrooms: 3 bedrooms (all on the main level); Bedroom sizes: 11x10, 11x10, 11x7
- Flooring: Other
- Bathrooms: 1 full bathroom (on the main level); Bathroom size: 5x6
- Heating & cooling: Forced air heating (Natural gas); Central air; Ceiling fan(s)
- Interior features: Eat-in kitchen; No basement
- Laundry & utility: Main-level laundry
Neighborhood map
What this means for you Summary
Snapshot
- This is a 3-bed/1.0-bath other listed at $45k.
Deal economics
- At list price, monthly cash flow is $659 ($8k/yr) — positive.
- The deal already cash-flows at list — no discount required.
- Meets the 1% rule at list price ($1k rent vs $45k).
- Recommended offer: $44k (1.5% below list) — sets the bar for market timing.
- Cap rate 23.9% vs local median 4.4% in Poplar Bluff — top-decile yield for the area; either an underpriced asset or a hidden risk that comps aren't pricing in. Stress-test before assuming the spread holds.
Location & tenants
- Location reads 70/100 on livability (#143 in MO) — a middle-class / working-renter tenant base. Strengths: crime A+, cost of living A+, housing A+; Watch: amenities F, commute F, employment F.
- Poplar Bluff R-I (town): math 38% / reading 47% proficiency, ranked #127 of 324 in MO (top 39%) — families likely to look elsewhere, expect single-tenant / working-renter base with shorter leases.
- Zoned schools: O'Neal Elem. (math 52% / reading 52%, grade C-, #231 of 1,115 statewide, top 24%, 325 students, 99% FRL); Poplar Bluff High (math 22% / reading 42%, grade F, #356 of 521 statewide, top 71%, 1,504 students, 56% FRL) — zoned schools average 78% FRL vs 56% district-wide (21 pts higher); higher-poverty schools than district average — tighter screening recommended.
- Market conditions: 277 active listings in the ZIP; 63 units permitted in Butler County in 2024 (48 in 5+ unit buildings).
Forward outlook
- Local home prices are declining (-3.0%/yr); year-one equity from $310 of loan paydown is wiped out by about $1k of value loss. Plan a longer hold.
- Butler County population projected to shrink 6% by 2050 — rents likely to lag national; underwrite the cash flow, not the appreciation.
- At projected returns (-3.0% appreciation + 3.0% rent growth), your $13k cash investment doubles in ~2 years — after that, you're playing with house money.
Negotiation context
- It's been on market 24 days — a 2% lower offer ($44k) is reasonable based on typical stale-listing flexibility.
- 2 sale attempts since 8y ago with the ask held roughly flat each time — persistent listings suggest the price (not the market) is what's stuck; bring a comps-based counter.
Risks & watch-outs
- Climate carrying-cost: extreme-heat days projected 7→20/yr by 2055 (HVAC capex compounding) — expect insurance premiums to compound above CPI over the hold.
Questions for the listing agent
- Built in 1970 — when were the roof, HVAC, electrical panel, plumbing, and water heater last replaced?
- Is there a deadline driving the sale (1031 exchange, divorce, estate, relocation)? That informs how much negotiation room exists.
- What's the average days-on-market for RENTAL listings here right now (not sales)? A rising rental-DOM trend means longer vacancies and softer asking-rent achievability than the comps imply.
- What's the recent tenant-quality profile in this submarket — average credit score on applications, eviction rate, late-payment / NSF rate, and stable-employment percentage? A property-management company in the area should have these aggregated.
- How much new for-sale + rental construction is in the pipeline within 1–3 miles? Heavy new supply typically softens prices + rents 12–24 months out; constrained supply supports both.
Investment metrics
- 1% rule
- 2.68% ✓
- Cap rate
- 23.91%
- Cash-on-cash
- 62.91%
- DSCR
- 3.80
- GRM
- 3.1
CMA / ARV
No comps found within radius.
Projected returns pro-forma
-3.0% appreciation · 3.0% rent growth · sell at horizon
- IRR
- 61.9%
- Equity multiple
- 3.76×
- Total profit
- $34,704
- Equity at exit
- $6,695
- IRR
- 66.4%
- Equity multiple
- 7.70×
- Total profit
- $84,292
- Equity at exit
- $3,882
Cash invested: $12,572 (down + closing). Projections, not guarantees.
Landlord ↔ Tenant lean methodology
- Overall (STATE)
- 81 Strongly Landlord-Friendly
- State Missouri
- 81 Strongly Landlord-Friendly · R+10
- County
- — inherits STATE
- City
- — inherits STATE
ZIP-level market 63901
- Home prices YoY
- -22.4%
- Active inventory
- 277
- Price-to-rent
- 3.1×
Monthly cashflow live
- Estimated rent
- $1,201 medium interval (Pro) →
- Mortgage (P&I)
- −$235
- Tax from tax record
- −$36 /mo · $431/yr
- Insurance
- −$19
- HOA
- −$0
- Vacancy / Maint / Mgmt
- −$252
- Net cashflow
- $659
Break-even live
Sensitivity live
| Price | -10% $684 | -5% $672 | +0% $659 | +5% $646 | +10% $634 |
|---|---|---|---|---|---|
| Rent | -10% $564 | -5% $612 | +0% $659 | +5% $706 | +10% $754 |
| Rate | -1.0pp $682 | -0.5pp $670 | base $659 | +0.5pp $647 | +1.0pp $636 |
UW: 25.0% down · 7.5% · 30yr · 1.5% tax · 5.0% vac · 8.0% maint · 8.0% mgmt
Financing live
Cash to close
- Down payment
- $11,225
- Closing costs
- $1,347
- Reserves months
- —
- Total cash needed
- —
Loan-product check · same deal, 3 products live
Conventional
25% down · 7.5% · 30yr
- Down + closing
- —
- Monthly P&I
- —
- Monthly cashflow
- —
- DSCR
- —
- Eligible?
- —
Personal DTI + credit; lowest rate.
DSCR
20% down · 8.5% · 30yr
- Down + closing
- —
- Monthly P&I
- —
- Monthly cashflow
- —
- DSCR
- —
- Eligible?
- —
No personal income docs; deal must DSCR.
Hard money
10% down · 12.0% · 12mo
- Down + closing
- —
- Monthly P&I
- —
- Monthly cashflow
- —
- DSCR
- —
- Eligible?
- —
Short-term bridge; refi at stabilization.
Listing history 14 events
-
2026-06-21days on market $44,900 Active 24 DOM
-
2026-06-18days on market $44,900 Active 22 DOM
-
2026-06-17days on market $44,900 Active 21 DOM
-
2026-06-16days on market $44,900 Active 20 DOM
-
2026-06-15days on market $44,900 Active 19 DOM
-
2026-06-13days on market $44,900 Active 17 DOM
-
2026-06-12days on market $44,900 Active 16 DOM
-
2026-06-09days on market $44,900 Active 13 DOM
-
2026-06-08days on market $44,900 Active 12 DOM
-
2026-06-07days on market $44,900 Active 11 DOM
-
2026-06-04days on market $44,900 Active 7 DOM
-
2026-06-02days on market $44,900 Active 6 DOM
-
2026-06-01days on market $44,900 Active 5 DOM
-
2026-05-31days on market $44,900 Active 4 DOM
ⓘ Source: listings_history table (triggers on properties + properties_extension) + one-shot
backfill from property_details.listing_events for pre-trigger history.
Tax reassessment forecast MO · Resets to sale price
- Current annual tax
- $431 · $36/mo
- Projected year-2 tax
- $436 · $36/mo
- Expected delta
- +$4/yr ($0/mo · 1.0%)
ⓘ Screening estimate from a state-policy table — verify with the county assessor before closing.
Climate risk First Street
- Flood 1/10 Low FEMA zone X (unshaded) · 0% chance over 30 yrs
- Wildfire 2/10 Low
- Heat 5/10 Major 7 d/yr ≥108°F today · 20 d/yr by 30 yrs out
- Wind 3/10 Moderate 6% chance of damaging wind over 30 yrs
- Air quality 2/10 Low 0 unhealthy d/yr today · 2 by 30 yrs out
Nearby sold comps map
Loading sold comps map…
Walkable amenities ~0.75 mi
Loading nearby amenities…
Taxation est. · year 1
- Rental income
- $14,417
- − Mortgage interest
- −$2,515
- − Property taxes
- −$431
- − Insurance
- −$224
- − Repairs & maintenance
- −$1,153
- − Management
- −$1,153
- − Depreciation
- −$1,306
- Taxable income
- $7,634
- Est. tax owed @ 24.0%
- −$1,832
- After-tax cash flow
- $6,076/yr
For passive investors: Depreciation is non-cash, so a rental often shows a tax loss while cash-flowing — sheltering income. Rental losses are passive: they offset passive income freely, and up to $25,000/yr can offset ordinary (W-2) income if you actively participate and your MAGI is under $100k (phasing out to $0 by $150k); unused losses carry forward. On sale, claimed depreciation is recaptured at up to 25%, and gains may owe capital-gains tax (a 1031 exchange can defer both). Figures are a year-1 estimate at your 24.0% rate — not tax advice; consult a CPA.
Schools (NCES district)
- District
- Poplar Bluff R-I
- NCES district ID
- 2925450
- Math proficiency
- 38% ▼ -4.00%
- Reading proficiency
- 47% ▼ -3.00%
- Median HH income
- $35,761
- Composite
- 35.17/100
- National rank
- #5001
- State rank
- #127 of 324 in MO
Livability — Poplar Bluff
- Score
- 70/100
- State rank
- #143
- US rank
- #8135
Category grades
Schools grade is shown separately in the Schools card above.
Census & demographics
- Census place
- Poplar Bluff, MO
- City population
- 34,920
- Population (ZIP)
- 34,920
Population outlook (Butler County) Hauer SSP2
- Today (2025)
- 42,648 people
- By 2030
- 42,329 · -0.7%
- By 2040
- 41,498 · -2.7%
- By 2050
- 40,308 · -5.5%
- By 2075
- 36,168 · -15.2%
- By 2100
- 28,893 · -32.3%
Race, ethnicity, and origin ACS 2023
- Neighborhood character
- Predominantly White (85%)
- Race & ethnicity
- White 85% Two or more races 6% Black 5% Hispanic / Latino 2%
- Common ancestry
- Slovak 2% Lithuanian 1% Romanian 1%
- Foreign-born
- 1% · Canada
- Languages at home
- 98% English-only · Spanish 1%
Political lean MEDSL · Butler
- 2024 margin
- Solid R (+63.8) · D 17.7% · R 81.5%
- 2008→2024 swing
- -26.4pp toward R · 2008: -37.4pp · 2024: -63.8pp
- All cycles
- 2024: R+63.8 2020: R+62.3 2016: R+61.6 2012: R+46.7 2008: R+37.4
Not yet ingested
- Civics
- —
Market trends
- HPI YoY
- ▼ -50.64%
- Current HPI
- 175.3008
- Rent YoY
- —
- Metro
- —
- State GDP YoY
- ▲ 1.84%
- F500 in state
- 20
Industry mix (Fortune 500 HQ in MO)
| Industry | F500 HQs | Revenue |
|---|---|---|
| Healthcare | 1 | $163B |
|
||
| Insurance | 1 | $21B |
|
||
| Industrial Technology | 1 | $17B |
|
||
| Retail | 1 | $16B |
|
||
| Industrial Distribution | 1 | $10B |
|
||
| Utilities | 1 | $9B |
|
||
Price history
-18.7% since first listed5 events — show timeline
- 2026-05-27 Listed $44,900 MARIS as Distributed by MLS Grid
- 2018-10-01 Sold (Public Records) — Public Records
- 2018-09-28 Sold (MLS) — MARIS as Distributed by MLS Grid
- 2018-08-23 Listed $55,200 MARIS as Distributed by MLS Grid
- 1992-06-01 Sold (Public Records) — Public Records
Property tax history
+2.0%/yrLatest (2025): $431 · +5.1% YoY. Source: county tax records.
Cash-flow waterfall
monthlySold comps — $/sqft
last 12 mo · ≤1 miLoading sold comps…