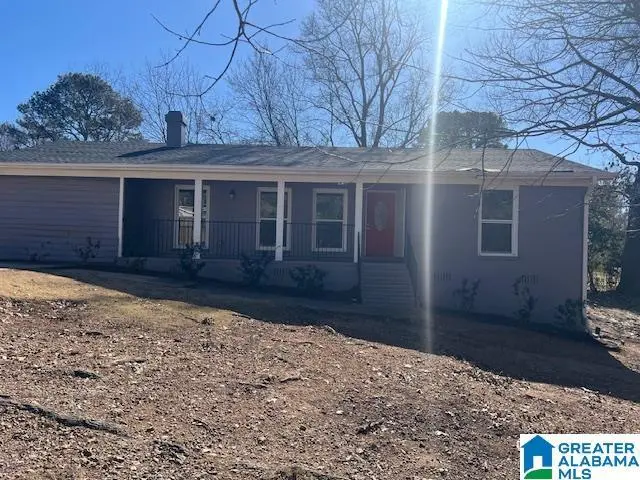
401 20th Ave NE · Center Point, AL
Flood risk 1/10 · Minimal
- FEMA flood zone
- X (unshaded)
- Chance of flooding over 30 yrs
- 0.0%
- Est. flood insurance / yr
- $507 – $1,088
Fire risk 2/10 · Minimal
- Est. fire insurance / yr
- $916 – $1,700
Heat risk 5/10 · Moderate
- Hot days now (above 105°F)
- 7 days/yr
- Hot days in 30 yrs
- 17 days/yr
Wind risk 6/10 · Moderate
- Chance of severe wind over 30 yrs
- 27.0%
Air-quality risk 5/10 · Moderate
- Unhealthy air days now
- 7 days/yr
- Unhealthy air days in 30 yrs
- 9 days/yr
Risk factors via First Street. Map © Google.
Why this score? — see what drove the C+ grade
The composite is a weighted blend of 9 inputs, each scored 0–100. Each bar is that input's sub-score; the figure is the points it added to the 100-point composite (weight × sub-score).
- Cash flow +23.1/30.0
- ARV discount +15.0/15.0
- DSCR +7.4/10.0
- 1% rule +6.2/10.0
- Rent growth +3.3/5.0
- Livability +3.2/5.0
- Condition / age +2.5/5.0
- Schools +1.8/10.0
- Appreciation +0.0/10.0
$122,900
🖨 Deal sheet (PDF) 📄 Offer letter ✓ Due diligence
Listing remarks MLS
Nice corner lot with 3br, 2ba brick home. Home has new windows. Living room has rock fireplace. Formal dining room and kitchen. Home has had some updates done. Needs some work like stove, oven, bathroom sink. No HVAC. Large storage building.
Key facts
- Formal dining room
- Rock fireplace
- Corner lot
Tags
Neighborhood map
What this means for you Summary
Snapshot
- This is a 3-bed/1.0-bath single-family listed at $123k.
Deal economics
- At list price, monthly cash flow is $221 ($3k/yr) — positive.
- The deal already cash-flows at list — no discount required.
- Meets the 1% rule at list price ($1k rent vs $123k).
- Recommended offer: $108k (12.0% below list) — sets the bar for market timing.
Location & tenants
- Location reads 63/100 on livability (#193 in AL) — a middle-class / working-renter tenant base. Strengths: cost of living A+, commute A, housing A; Watch: crime D, schools F, amenities F.
- Jefferson County (suburban): math 9% / reading 32% proficiency, ranked #104 of 129 in AL (top 81%) — low school quality limits family demand, transient renter base, plan for 1-2y turnover.
- Market conditions: Rents rising (+3.0%/yr); 334 active listings in the ZIP; 40 comparable units currently listed for rent nearby; rentals at typical pace (median 25d on market — plan ~3-4 weeks tenant-placement turnaround); 48% of comp listings sitting > 30 days — soft ceiling on asking rent; 2,114 units permitted in Jefferson County in 2024 (556 in 5+ unit buildings).
- This rent runs 31% of the median local income ($53k/yr) — at the standard rent-burdened threshold; future hikes will face affordability resistance.
Forward outlook
- Local home prices are declining (-3.0%/yr); year-one equity from $850 of loan paydown is wiped out by about $4k of value loss. Plan a longer hold.
- Jefferson County population projected to shrink 4% by 2050 — rents likely to lag national; underwrite the cash flow, not the appreciation.
Negotiation context
- It's been on market 127 days — a 12% lower offer ($108k) is reasonable based on typical stale-listing flexibility.
- 2 sale attempts since 15y ago; this cycle's ask has dropped $22k (15%) from the opening price — seller is motivated, your offer sets the floor, not the list.
- Current owner paid $28k; list at $123k implies a 339% gain — meaningful room to come down on a strong offer.
Risks & watch-outs
- Climate carrying-cost: major wind risk, 27% chance of damaging wind over 30y; extreme-heat days projected 7→17/yr by 2055 (HVAC capex compounding) — expect insurance premiums to compound above CPI over the hold.
Questions for the listing agent
- It's been on market 127 days. Have you received any prior offers? Is the seller open to a 12% concession, seller financing, or rate buy-down credit?
- Built in 1960 — when were the roof, HVAC, electrical panel, plumbing, and water heater last replaced?
- Why hasn't it sold? Are there any deal-killer items the seller is aware of (foundation, flood, title, zoning, code violations)?
- Is there a deadline driving the sale (1031 exchange, divorce, estate, relocation)? That informs how much negotiation room exists.
- Schools are F-rated, which usually means shorter tenancies and higher turnover. Who's the typical renter profile here, and what's been the actual vacancy rate?
- Crime grade is D in this area — have there been break-ins, vandalism, or insurance claims at this property in the last 3 years? What carrier currently insures it and at what premium?
- What's the average days-on-market for RENTAL listings here right now (not sales)? A rising rental-DOM trend means longer vacancies and softer asking-rent achievability than the comps imply.
- What's the recent tenant-quality profile in this submarket — average credit score on applications, eviction rate, late-payment / NSF rate, and stable-employment percentage? A property-management company in the area should have these aggregated.
- How much new for-sale + rental construction is in the pipeline within 1–3 miles? Heavy new supply typically softens prices + rents 12–24 months out; constrained supply supports both.
Investment metrics
- 1% rule
- 1.12% ✓
- Cap rate
- 8.45%
- Cash-on-cash
- 7.71%
- DSCR
- 1.34
- GRM
- 7.4
CMA / ARV
- ARV (median comp)
- $165,320
- List price
- $122,900
- Delta
- -25.66%
- Verdict
- UNDERPRICED
- Comps
- 20 within 1.0 mi
Show comp detail 12 sales within ~0.75 mi
| Address | Dist | Beds/Ba | Sqft | Sold | Price | $/sf | Match |
|---|---|---|---|---|---|---|---|
| 550 Samantha Cir | 0.28mi | 3/2.0 | 1,455 (-4%) | 1mo | $215,000 | $148 | 75 |
| 401 20th Ct NE | 0.07mi | 3/2.0 | 1,655 (+9%) | 8mo | $45,000 | $27 | 71 |
| 2212 Shirley Dr | 0.45mi | 3/2.0 | 1,518 (+0%) | 5mo | $199,900 | $132 | 70 |
| 1736 Reed Rd NE | 0.51mi | 3/2.0 | 1,469 (-3%) | 1mo | $190,000 | $129 | 66 |
| 2236 2nd Pl NE | 0.50mi | 3/2.0 | 1,392 (-8%) | 3mo | $195,000 | $140 | 57 |
| 2240 6th St NE | 0.37mi | 3/1.0 | 1,702 (+12%) | 8mo | $110,000 | $65 | 55 |
| 504 Lakeside Cir | 0.71mi | 2/2.0 (-1) | 1,555 (+3%) | 2mo | $210,000 | $135 | 52 |
| 550 Lakeside Cir | 0.69mi | 2/2.0 (-1) | 1,526 (+1%) | 7mo | $209,900 | $138 | 52 |
| 2316 3rd Way NE | 0.54mi | 3/2.0 | 1,665 (+10%) | 5mo | $182,000 | $109 | 50 |
| 217 22nd Ave NE | 0.39mi | 4/2.0 (+1) | 1,327 (-12%) | 7mo | $138,000 | $104 | 46 |
| 668 20th Ct NE | 0.41mi | 4/3.0 (+1) | 1,675 (+11%) | 5mo | $230,000 | $137 | 46 |
| 613 25th Ave NE | 0.70mi | 3/2.0 | 1,400 (-8%) | 8mo | $93,000 | $66 | 44 |
Match score weights: distance 35% · size 25% · config 20% · recency 20%. Top-matched comps best support the ARV.
Projected returns pro-forma
-3.0% appreciation · 3.04% rent growth · sell at horizon
- IRR
- -4.5%
- Equity multiple
- 0.83×
- Total profit
- $-5,746
- Equity at exit
- $18,325
- IRR
- 5.3%
- Equity multiple
- 1.39×
- Total profit
- $13,481
- Equity at exit
- $10,626
Cash invested: $34,412 (down + closing). Projections, not guarantees.
Landlord ↔ Tenant lean methodology
- Overall (STATE)
- 90 Strongly Landlord-Friendly
- State Alabama
- 90 Strongly Landlord-Friendly · R+15
- County
- — inherits STATE
- City
- — inherits STATE
ZIP-level market 35215
- Home prices YoY
- -34.4%
- Rents YoY
- 3.0%
- Active inventory
- 334
- Price-to-rent
- 7.4×
Monthly cashflow live
- Estimated rent
- $1,375 high interval (Pro) →
- Mortgage (P&I)
- −$645
- Tax from tax record
- −$169 /mo · $2,031/yr
- Insurance
- −$51
- HOA
- −$0
- Vacancy / Maint / Mgmt
- −$289
- Net cashflow
- $221
Break-even live
Sensitivity live
| Price | -10% $291 | -5% $256 | +0% $221 | +5% $186 | +10% $152 |
|---|---|---|---|---|---|
| Rent | -10% $113 | -5% $167 | +0% $221 | +5% $275 | +10% $330 |
| Rate | -1.0pp $283 | -0.5pp $252 | base $221 | +0.5pp $189 | +1.0pp $157 |
UW: 25.0% down · 7.5% · 30yr · 1.5% tax · 5.0% vac · 8.0% maint · 8.0% mgmt
Financing live
Cash to close
- Down payment
- $30,725
- Closing costs
- $3,687
- Reserves months
- —
- Total cash needed
- —
Loan-product check · same deal, 3 products live
Conventional
25% down · 7.5% · 30yr
- Down + closing
- —
- Monthly P&I
- —
- Monthly cashflow
- —
- DSCR
- —
- Eligible?
- —
Personal DTI + credit; lowest rate.
DSCR
20% down · 8.5% · 30yr
- Down + closing
- —
- Monthly P&I
- —
- Monthly cashflow
- —
- DSCR
- —
- Eligible?
- —
No personal income docs; deal must DSCR.
Hard money
10% down · 12.0% · 12mo
- Down + closing
- —
- Monthly P&I
- —
- Monthly cashflow
- —
- DSCR
- —
- Eligible?
- —
Short-term bridge; refi at stabilization.
Rent comps 40 comps
| Address | Beds | Baths | Sqft | Rent | $/sqft | DOM | Units | Dist |
|---|---|---|---|---|---|---|---|---|
| 413 20th Ct NE Center Point, AL | 3.0 | 1.5 | 1540 | $1,375 | $0.89 | 44d | 1 | 0.09mi |
| 2249 4th Place Cir NE Center Point, AL | 3.0 | 1.5 | 1400 | $1,400 | $1.00 | 44d | 1 | 0.34mi |
| 2232 6th St NE Center Point, AL | 3.0 | 1.0 | 1550 | $1,150 | $0.74 | 44d | 1 | 0.34mi |
| 600 20th Ct NE Center Point, AL | 3.0 | 2.0 | 1878 | $1,650 | $0.88 | 24d | 1 | 0.37mi |
| 2229 3rd St NE Center Point, AL | 3.0 | 1.0 | 1215 | $1,125 | $0.93 | 24d | 1 | 0.38mi |
| 332 23rd Ave NE Center Point, AL | 3.0 | 1.0 | 1100 | $1,350 | $1.23 | 3d | 1 | 0.43mi |
| 2245 3rd St NE Center Point, AL | 3.0 | 1.0 | 1150 | $1,100 | $0.96 | 24d | 1 | 0.45mi |
| 856 Parkbrook Trl Birmingham, AL | 1.0–3.0 | 1.0–2.0 | 925 | $1,180 | $1.28 | 3d | 10 | 0.46mi |
| 1845 Stonehenge Dr Birmingham, AL | 3.0 | 2.0 | 1358 | $1,323 | $0.97 | 15d | 1 | 0.55mi |
| 2324 3rd St NE Center Point, AL | 3.0 | 2.0 | 1329 | $1,300 | $0.98 | 24d | 1 | 0.62mi |
| 1935 Springlake Ct Unit 1 Birmingham, AL | 2.0 | 1.5 | 1152 | $1,095 | $0.95 | 44d | 1 | 0.64mi |
| 1720 2nd St NE Center Point, AL | 3.0 | 2.0 | 1100 | $1,400 | $1.27 | 44d | 1 | 0.69mi |
| 107 Sterling Ct NW Center Point, AL | 2.0 | 1.5–2.0 | 1026 | $1,062 | $1.04 | 3d | 4 | 0.81mi |
| 113 19th Ave NW Center Point, AL | 3.0 | 2.0 | 1407 | $1,250 | $0.89 | 12d | 1 | 0.86mi |
| 1700 Serene Dr Birmingham, AL | 4.0 | 1.5 | 1543 | $1,630 | $1.06 | 3d | 1 | 0.86mi |
| 1761 Big Mountain Dr Birmingham, AL | 4.0 | 2.0 | 1632 | $1,575 | $0.97 | 45d | 1 | 0.87mi |
| 1905 2nd St NW Center Point, AL | 3.0 | 1.0 | 1258 | $1,395 | $1.11 | 44d | 1 | 0.90mi |
| 213 Meadwood Dr NE Center Point, AL | 3.0 | 1.0 | 1194 | $995 | $0.83 | 44d | 1 | 0.97mi |
| 2708 7th St NE Center Point, AL | 3.0 | 1.0 | 1451 | $1,150 | $0.79 | 44d | 1 | 0.98mi |
| 2415 Ormond Dr Center Point, AL | 3.0 | 1.5 | 1194 | $1,295 | $1.08 | 44d | 1 | 1.01mi |
| 1628 1st St NW Center Point, AL | 3.0 | 1.0 | 1124 | $1,150 | $1.02 | 44d | 1 | 1.03mi |
| 1819 Valley Run Cir Birmingham, AL | 4.0 | 2.5 | 1694 | $1,761 | $1.04 | 44d | 1 | 1.04mi |
| 305 18th Ct NW Center Point, AL | 3.0 | 1.5 | 1270 | $1,100 | $0.87 | 44d | 1 | 1.04mi |
| 2629 Wood Dr NE Center Point, AL | 3.0 | 1.0 | 1203 | $1,250 | $1.04 | 44d | 1 | 1.06mi |
| 2245 3rd St NW Center Point, AL | 3.0 | 1.0 | 1156 | $1,100 | $0.95 | 24d | 1 | 1.13mi |
| 1817 Lyle Dr Birmingham, AL | 4.0 | 2.0 | 1361 | $1,605 | $1.18 | 24d | 1 | 1.13mi |
| 241 Lake Drive Cir NE Birmingham, AL | 2.0 | 1.0 | 1358 | $1,025 | $0.75 | 3d | 1 | 1.14mi |
| 239 Lake Drive Cir NE Birmingham, AL | 3.0 | 1.0 | 1159 | $1,125 | $0.97 | 4d | 1 | 1.16mi |
| 2655 6th St NE Center Point, AL | 3.0 | 2.0 | 1600 | $1,390 | $0.87 | 3d | 1 | 1.18mi |
| 605 Country View Dr Birmingham, AL | 3.0 | 2.0 | 1698 | $1,560 | $0.92 | 44d | 1 | 1.18mi |
| 607 Country View Dr Birmingham, AL | 4.0 | 2.0 | 1568 | $1,550 | $0.99 | 24d | 1 | 1.18mi |
| 236 E Haven Dr Birmingham, AL | 3.0 | 1.5 | 1926 | $1,495 | $0.78 | 12d | 1 | 1.19mi |
| 319 23rd Ave NW Center Point, AL | 3.0 | 2.0 | 1284 | $1,395 | $1.09 | 44d | 1 | 1.19mi |
| 405 18th Ave NW Center Point, AL | 3.0 | 2.0 | 1162 | $1,299 | $1.12 | 44d | 1 | 1.19mi |
| 424 Tupelo Way Center Point, AL | 4.0 | 2.0 | 1233 | $1,300 | $1.05 | 44d | 1 | 1.21mi |
| 1830 Christian St Birmingham, AL | 3.0 | 2.0 | 1468 | $1,375 | $0.94 | 3d | 1 | 1.25mi |
| 127 Fox Hill Ct Center Point, AL | 3.0 | 2.0 | 1418 | $1,545 | $1.09 | 44d | 1 | 1.27mi |
| 457 Tupelo Way Center Point, AL | 3.0 | 1.0 | 1658 | $995 | $0.60 | 22d | 1 | 1.32mi |
| 1617 3rd Pl NW Center Point, AL | 3.0 | 2.0 | 1404 | $1,150 | $0.82 | 24d | 1 | 1.32mi |
| 1317 Hatfield Ln Birmingham, AL | 3.0 | 1.5 | 2028 | $1,300 | $0.64 | 24d | 1 | 1.35mi |
Listing history 19 events
-
2026-06-18days on market $122,900 Active 127 DOM
-
2026-06-17days on market $122,900 Active 126 DOM
-
2026-06-16days on market $122,900 Active 125 DOM
-
2026-06-15days on market $122,900 Active 124 DOM
-
2026-06-13days on market $122,900 Active 122 DOM
-
2026-06-10days on market $122,900 Active 119 DOM
-
2026-06-09days on market $122,900 Active 118 DOM
-
2026-06-08days on market $122,900 Active 117 DOM
-
2026-06-07days on market $122,900 Active 116 DOM
-
2026-06-03days on market $122,900 Active 112 DOM
-
2026-06-02days on market $122,900 Active 111 DOM
-
2026-06-01days on market $122,900 Active 110 DOM
-
2026-05-31days on market $122,900 Active 109 DOM
-
2026-04-25price $122,900 241-char remark
Show marketing remark (241 chars)
Nice corner lot with 3br, 2ba brick home. Home has new windows. Living room has rock fireplace. Formal dining room and kitchen. Home has had some updates done. Needs some work like stove, oven, bathroom sink. No HVAC. Large storage building.
-
2026-03-18price $134,000 241-char remark
Show marketing remark (241 chars)
Nice corner lot with 3br, 2ba brick home. Home has new windows. Living room has rock fireplace. Formal dining room and kitchen. Home has had some updates done. Needs some work like stove, oven, bathroom sink. No HVAC. Large storage building.
-
2026-02-10$144,900 Active 241-char remark
Show marketing remark (241 chars)
Nice corner lot with 3br, 2ba brick home. Home has new windows. Living room has rock fireplace. Formal dining room and kitchen. Home has had some updates done. Needs some work like stove, oven, bathroom sink. No HVAC. Large storage building.
-
2012-04-09soldstatus $28,000 305-char remark
Show marketing remark (305 chars)
REDUCED! Investors or cash buyers - this is a must see. Home does not need much work AT ALL. Great split bedroom layout 3 bedroom 2 full bath. Separate living room with fireplace and dining room. Nice sized kitchen with some updates. Screened in back porch with patio area. House sits on large corner lot.
-
2011-11-01$28,000 305-char remark
Show marketing remark (305 chars)
REDUCED! Investors or cash buyers - this is a must see. Home does not need much work AT ALL. Great split bedroom layout 3 bedroom 2 full bath. Separate living room with fireplace and dining room. Nice sized kitchen with some updates. Screened in back porch with patio area. House sits on large corner lot.
-
2005-01-26soldstatus $60,000
ⓘ Source: listings_history table (triggers on properties + properties_extension) + one-shot
backfill from property_details.listing_events for pre-trigger history.
Tax reassessment forecast AL · Resets to sale price
- Current annual tax
- $2,031 · $169/mo
- Projected year-2 tax
- $2,031 · $169/mo
- Expected delta
- $0/yr ($0/mo · 0.0%)
ⓘ Screening estimate from a state-policy table — verify with the county assessor before closing.
Climate risk First Street
- Flood 1/10 Low FEMA zone X (unshaded) · 0% chance over 30 yrs
- Wildfire 2/10 Low
- Heat 5/10 Major 7 d/yr ≥105°F today · 17 d/yr by 30 yrs out
- Wind 6/10 Major 27% chance of damaging wind over 30 yrs
- Air quality 5/10 Major 7 unhealthy d/yr today · 9 by 30 yrs out
Nearby sold comps map
Loading sold comps map…
Walkable amenities ~0.75 mi
Loading nearby amenities…
Taxation est. · year 1
- Rental income
- $16,497
- − Mortgage interest
- −$6,884
- − Property taxes
- −$2,031
- − Insurance
- −$614
- − Repairs & maintenance
- −$1,320
- − Management
- −$1,320
- − Depreciation
- −$3,575
- Taxable income
- $753
- Est. tax owed @ 24.0%
- −$181
- After-tax cash flow
- $2,473/yr
For passive investors: Depreciation is non-cash, so a rental often shows a tax loss while cash-flowing — sheltering income. Rental losses are passive: they offset passive income freely, and up to $25,000/yr can offset ordinary (W-2) income if you actively participate and your MAGI is under $100k (phasing out to $0 by $150k); unused losses carry forward. On sale, claimed depreciation is recaptured at up to 25%, and gains may owe capital-gains tax (a 1031 exchange can defer both). Figures are a year-1 estimate at your 24.0% rate — not tax advice; consult a CPA.
Schools (NCES district)
- District
- Jefferson County
- NCES district ID
- 0101920
- Math proficiency
- 9% ▼ -24.00%
- Reading proficiency
- 32% ▼ -5.00%
- Median HH income
- $51,712
- Composite
- 18.4/100
- National rank
- #8937
- State rank
- #104 of 129 in AL
Livability — Center Point
- Score
- 63/100
- State rank
- #193
- US rank
- #15671
Category grades
Schools grade is shown separately in the Schools card above.
Census & demographics
- Census place
- Center Point, AL
- County
- Jefferson County · 527,445 people
- City population
- 43,903
- Metro
- Birmingham-Hoover, AL
- Population (ZIP)
- 43,903
- Household income
- $52,793
- Rent vs Own
- Severe rent burden
- 1729.0
Population outlook (Jefferson County) Hauer SSP2
- Today (2025)
- 669,185 people
- By 2030
- 669,694 · +0.1%
- By 2040
- 661,388 · -1.2%
- By 2050
- 643,086 · -3.9%
- By 2075
- 577,267 · -13.7%
- By 2100
- 474,758 · -29.1%
Race, ethnicity, and origin ACS 2023
- Neighborhood character
- Predominantly Black (75%)
- Race & ethnicity
- Black 75% White 15% Hispanic / Latino 7% Two or more races 3%
- Hispanic origin (detail)
- Mexican 4%
- Common ancestry
- Lithuanian 1% Italian 1% Slovak 1%
- Foreign-born
- 4% · Canada
- Languages at home
- 92% English-only · Spanish 7%
Political lean MEDSL · Jefferson
- 2024 margin
- D (+10.4) · D 54.6% · R 44.2% · Other 1.2%
- 2008→2024 swing
- +5.4pp toward D · 2008: 5.1pp · 2024: 10.4pp
- All cycles
- 2024: D+10.4 2020: D+13.2 2016: D+7.2 2012: D+6.0 2008: D+5.1
Not yet ingested
- Civics
- —
Market trends
- HPI YoY
- ▼ -112.97%
- Current HPI
- 215.0607
- Rent YoY
- ▲ 3.04%
- Metro
- Birmingham-Hoover, AL
- State GDP YoY
- ▲ 2.94%
- F500 in state
- 4
Industry mix (Fortune 500 HQ in AL)
| Industry | F500 HQs | Revenue |
|---|---|---|
| Financial Services | 1 | $8B |
|
||
| Healthcare | 1 | $5B |
|
||
Price history
+104.8% since first listed6 events — show timeline
- 2026-04-25 Price Changed $122,900 Greater Alabama MLS
- 2026-03-18 Price Changed $134,000 Greater Alabama MLS
- 2026-02-10 Listed $144,900 Greater Alabama MLS
- 2012-04-09 Sold (MLS) $28,000 Greater Alabama MLS
- 2011-11-01 Listed $28,000 Greater Alabama MLS
- 2005-01-26 Sold (Public Records) $60,000 Public Records
Property tax history
+9.9%/yrLatest (2025): $2,031 · +15.6% YoY. Source: county tax records.
Cash-flow waterfall
monthlySold comps — $/sqft
last 12 mo · ≤1 miLoading sold comps…