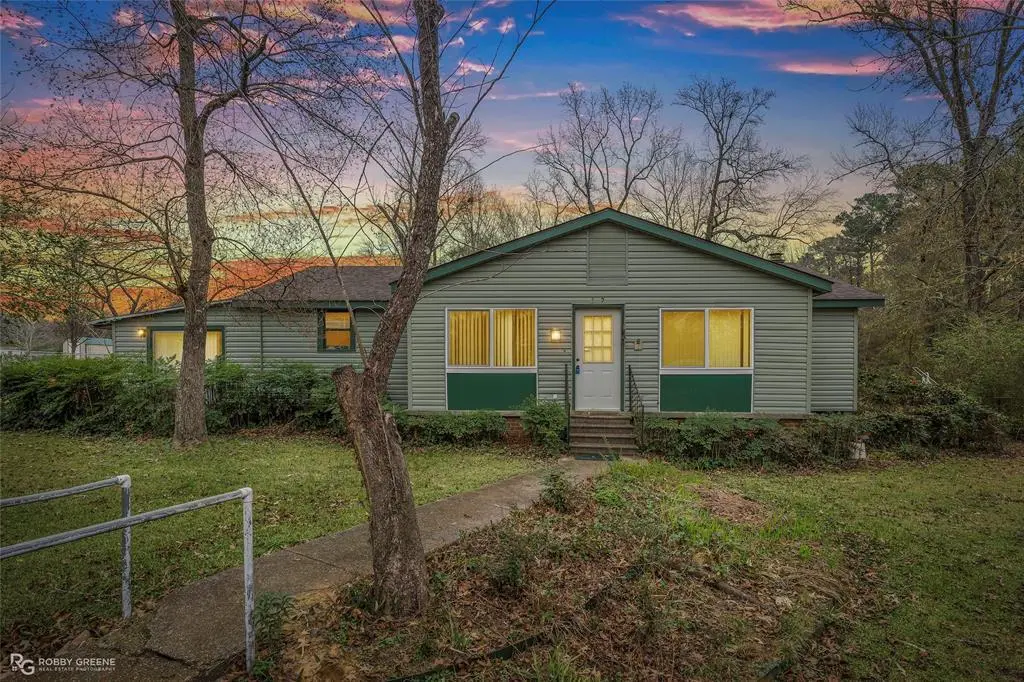
302 Princeton Rd · Eastwood, LA
Flood risk 1/10 · Minimal
- FEMA flood zone
- X (unshaded)
- Chance of flooding over 30 yrs
- 0.0%
- Est. flood insurance / yr
- $507 – $1,088
Fire risk 4/10 · Minor
- Est. fire insurance / yr
- $1,269 – $2,357
Heat risk 7/10 · Major
- Hot days now (above 110°F)
- 7 days/yr
- Hot days in 30 yrs
- 22 days/yr
Wind risk 6/10 · Moderate
- Chance of severe wind over 30 yrs
- 62.0%
Air-quality risk 2/10 · Minimal
- Unhealthy air days now
- 0 days/yr
- Unhealthy air days in 30 yrs
- 1 days/yr
Risk factors via First Street. Map © Google.
Why this score? — see what drove the D grade
The composite is a weighted blend of 9 inputs, each scored 0–100. Each bar is that input's sub-score; the figure is the points it added to the 100-point composite (weight × sub-score).
- ARV discount +15.0/15.0
- Appreciation +6.9/10.0
- Cash flow +6.7/30.0
- Schools +3.8/10.0
- Livability +3.1/5.0
- Rent growth +2.5/5.0
- Condition / age +2.5/5.0
- 1% rule +1.0/10.0
- DSCR +1.0/10.0
$198,000
🖨 Deal sheet 📄 Offer letter ✓ Due diligence
Listing remarks MLS
PRICE IMPROVEMENT Set on 5 peaceful acres, property offers space and privacy. Recent improvements include a new roof, new HVAC system, and new front porch windows. Inside, the home features 3 bedrooms and 2 full baths, a spacious living area, and both a fireplace . Storage throughout the home. Outside, the property truly shines with a large shop garage featuring two bay doors, ideal for vehicles, equipment, hobbies, or a workshop setup. The expansive yard offers plenty of room to play, explore, or simply enjoy the natural surroundings. Conveniently located just minutes from Highway 80 and I20, this property combines country living with easy access to town.
Key facts
- Gas log option
- 5 acres
- New roof
Tags
Neighborhood map
What this means for you Summary
Snapshot
- This is a 3-bed/2.0-bath single-family listed at $198k.
Deal economics
- At list price, monthly cash flow is $-315 ($-4k/yr) — negative.
- To cash-flow at today's rent, offer at most $142k (28.1% below list).
- To meet the 1% rule (rent ≥ 1% of price), the offer needs to be $119k (40.0% below list).
- Recommended offer: $119k (40.0% below list) — sets the bar for 1% rule.
- Cap rate 4.4% vs local median 2.4% in Eastwood — top-decile yield for the area; either an underpriced asset or a hidden risk that comps aren't pricing in. Stress-test before assuming the spread holds.
Location & tenants
- Location reads 61/100 on livability (#241 in LA) — a middle-class / working-renter tenant base. Strengths: cost of living A, crime A-, housing A-; Watch: schools D+, employment D, amenities F.
- Bossier Parish (urban): math 40% / reading 47% proficiency, ranked #17 of 98 in LA (top 17%) — families likely to look elsewhere, expect single-tenant / working-renter base with shorter leases.
- Market conditions: 101 active listings in the ZIP; 716 units permitted in Bossier Parish in 2024 (0 in 5+ unit buildings).
Forward outlook
- In year one you build about $9k of equity ($1k loan paydown + $7k appreciation (3.7% local appreciation)).
- Bossier County population projected at +28% by 2050 — long-run rental-demand tailwind backs the buy-and-hold thesis.
- By year 5, paydown + projected appreciation supports a ~$38k cash-out refi (75% LTV) — recoverable capital for the next deal without selling this one.
Negotiation context
- It's been on market 157 days — a 12% lower offer ($174k) is reasonable based on typical stale-listing flexibility.
Risks & watch-outs
- Watch-outs: built in 1955 — expect roof / HVAC / electrical / plumbing capex.
- Climate carrying-cost: major wind risk, 62% chance of damaging wind over 30y; extreme-heat days projected 7→22/yr by 2055 (HVAC capex compounding) — expect insurance premiums to compound above CPI over the hold.
Questions for the listing agent
- What do current leases actually rent for vs. the listed asking? Can we see a recent rent roll and the last 12 months of T-12 income?
- It's been on market 157 days. Have you received any prior offers? Is the seller open to a 40% concession, seller financing, or rate buy-down credit?
- Built in 1955 — when were the roof, HVAC, electrical panel, plumbing, and water heater last replaced?
- Why hasn't it sold? Are there any deal-killer items the seller is aware of (foundation, flood, title, zoning, code violations)?
- Is there a deadline driving the sale (1031 exchange, divorce, estate, relocation)? That informs how much negotiation room exists.
- Schools are D-rated, which usually means shorter tenancies and higher turnover. Who's the typical renter profile here, and what's been the actual vacancy rate?
- The area grade is low — what's the realistic commute time and amenity access for the typical tenant pool here? Any planned neighborhood developments (good or bad) we should know about?
- What's the average days-on-market for RENTAL listings here right now (not sales)? A rising rental-DOM trend means longer vacancies and softer asking-rent achievability than the comps imply.
- What's the recent tenant-quality profile in this submarket — average credit score on applications, eviction rate, late-payment / NSF rate, and stable-employment percentage? A property-management company in the area should have these aggregated.
- How much new for-sale + rental construction is in the pipeline within 1–3 miles? Heavy new supply typically softens prices + rents 12–24 months out; constrained supply supports both.
Investment metrics
- 1% rule
- 0.60% ✗
- Cap rate
- 4.38%
- Cash-on-cash
- -6.82%
- DSCR
- 0.70
- GRM
- 13.9
CMA / ARV
- ARV (median comp)
- $294,704
- List price
- $198,000
- Delta
- -32.81%
- Verdict
- UNDERPRICED
- Comps
- 20 within 1.0 mi
Show comp detail 12 sales within ~0.75 mi
| Address | Dist | Beds/Ba | Sqft | Sold | Price | $/sf | Match |
|---|---|---|---|---|---|---|---|
| 412 Hummingbird Ln | 0.47mi | 4/2.0 (+1) | 2,204 (-1%) | 3mo | $294,573 | $134 | 68 |
| 406 Hummingbird Ln | 0.47mi | 4/2.0 (+1) | 2,204 (-1%) | 6mo | $297,710 | $135 | 66 |
| 419 Hummingbird Ln | 0.45mi | 4/2.0 (+1) | 2,204 (-1%) | 10mo | $304,275 | $138 | 64 |
| 6810 Jennifer Ln | 0.45mi | 3/2.0 | 2,432 (+9%) | 2mo | $220,000 | $90 | 62 |
| 343 Hummingbird Ln | 0.56mi | 4/2.0 (+1) | 2,204 (-1%) | 12mo | $292,765 | $133 | 57 |
| 365 Hummingbird Ln | 0.52mi | 3/2.0 | 1,953 (-12%) | 3mo | $281,467 | $144 | 52 |
| 416 Hummingbird Ln | 0.66mi | 4/2.0 (+1) | 2,204 (-1%) | 13mo | $304,460 | $138 | 51 |
| 364 Hummingbird Ln | 0.67mi | 4/2.0 (+1) | 2,204 (-1%) | 13mo | $296,355 | $134 | 51 |
| 402 Hummingbird Ln | 0.66mi | 4/2.0 (+1) | 2,204 (-1%) | 14mo | $294,155 | $133 | 51 |
| 355 Hummingbird Ln | 0.53mi | 3/2.0 | 1,925 (-14%) | 7mo | $281,135 | $146 | 46 |
| 349 Hummingbird Ln | 0.54mi | 3/2.0 | 1,953 (-12%) | 10mo | $278,480 | $143 | 45 |
| 409 Hummingbird Ln | 0.66mi | 4/2.0 (+1) | 1,961 (-12%) | 6mo | $283,130 | $144 | 38 |
Match score weights: distance 35% · size 25% · config 20% · recency 20%. Top-matched comps best support the ARV.
Projected returns pro-forma
3.72% appreciation · 3.0% rent growth · sell at horizon
- IRR
- 3.4%
- Equity multiple
- 1.21×
- Total profit
- $11,374
- Equity at exit
- $97,155
- IRR
- 6.5%
- Equity multiple
- 2.07×
- Total profit
- $59,399
- Equity at exit
- $156,377
Cash invested: $55,440 (down + closing). Projections, not guarantees.
Landlord ↔ Tenant lean methodology
- Overall (STATE)
- 90 Strongly Landlord-Friendly
- State Louisiana
- 90 Strongly Landlord-Friendly · R+12
- County
- — inherits STATE
- City
- — inherits STATE
ZIP-level market 71067
- Home prices YoY
- 2.4%
- Active inventory
- 101
- Price-to-rent
- 13.9×
Monthly cashflow live
- Estimated rent
- $1,188 medium interval (Pro) →
- Mortgage (P&I)
- −$1,038
- Tax from tax record
- −$132 /mo · $1,590/yr
- Insurance
- −$82
- HOA
- −$0
- Vacancy / Maint / Mgmt
- −$249
- Net cashflow
- $-315
Break-even live
UW: 25.0% down · 7.5% · 30yr · 1.5% tax · 5.0% vac · 8.0% maint · 8.0% mgmt
Financing live
Cash to close
- Down payment
- $49,500
- Closing costs
- $5,940
- Reserves months
- —
- Total cash needed
- —
Loan-product check · same deal, 3 products live
Conventional
25% down · 7.5% · 30yr
- Down + closing
- —
- Monthly P&I
- —
- Monthly cashflow
- —
- DSCR
- —
- Eligible?
- —
Personal DTI + credit; lowest rate.
DSCR
20% down · 8.5% · 30yr
- Down + closing
- —
- Monthly P&I
- —
- Monthly cashflow
- —
- DSCR
- —
- Eligible?
- —
No personal income docs; deal must DSCR.
Hard money
10% down · 12.0% · 12mo
- Down + closing
- —
- Monthly P&I
- —
- Monthly cashflow
- —
- DSCR
- —
- Eligible?
- —
Short-term bridge; refi at stabilization.
Listing history 17 events
-
2026-06-18days on market $198,000 Active 157 DOM
-
2026-06-17days on market $198,000 Active 156 DOM
-
2026-06-16days on market $198,000 Active 155 DOM
-
2026-06-15days on market $198,000 Active 154 DOM
-
2026-06-14days on market $198,000 Active 152 DOM
-
2026-06-13days on market $198,000 Active 151 DOM
-
2026-06-10days on market $198,000 Active 149 DOM
-
2026-06-09days on market $198,000 Active 148 DOM
-
2026-06-08days on market $198,000 Active 147 DOM
-
2026-06-07days on market $198,000 Active 146 DOM
-
2026-06-02days on market $198,000 Active 141 DOM
-
2026-06-01days on market $198,000 Active 140 DOM
-
2026-05-31days on market $198,000 Active 139 DOM
-
2026-05-30days on market $198,000 Active 138 DOM
-
2026-04-30price $198,000 671-char remark
Show marketing remark (671 chars)
PRICE IMPROVEMENT Set on 5 peaceful acres, property offers space and privacy. Recent improvements include a new roof, new HVAC system, and new front porch windows. Inside, the home features 3 bedrooms and 2 full baths, a spacious living area, and both a fireplace . Storage throughout the home. Outside, the property truly shines with a large shop garage featuring two bay doors, ideal for vehicles, equipment, hobbies, or a workshop setup. The expansive yard offers plenty of room to play, explore, or simply enjoy the natural surroundings. Conveniently located just minutes from Highway 80 and I20, this property combines country living with easy access to town.
-
2026-03-02price $205,000 671-char remark
Show marketing remark (671 chars)
PRICE IMPROVEMENT Set on 5 peaceful acres, property offers space and privacy. Recent improvements include a new roof, new HVAC system, and new front porch windows. Inside, the home features 3 bedrooms and 2 full baths, a spacious living area, and both a fireplace . Storage throughout the home. Outside, the property truly shines with a large shop garage featuring two bay doors, ideal for vehicles, equipment, hobbies, or a workshop setup. The expansive yard offers plenty of room to play, explore, or simply enjoy the natural surroundings. Conveniently located just minutes from Highway 80 and I20, this property combines country living with easy access to town.
-
2026-01-12$210,000 Active 671-char remark
Show marketing remark (671 chars)
PRICE IMPROVEMENT Set on 5 peaceful acres, property offers space and privacy. Recent improvements include a new roof, new HVAC system, and new front porch windows. Inside, the home features 3 bedrooms and 2 full baths, a spacious living area, and both a fireplace . Storage throughout the home. Outside, the property truly shines with a large shop garage featuring two bay doors, ideal for vehicles, equipment, hobbies, or a workshop setup. The expansive yard offers plenty of room to play, explore, or simply enjoy the natural surroundings. Conveniently located just minutes from Highway 80 and I20, this property combines country living with easy access to town.
ⓘ Source: listings_history table (triggers on properties + properties_extension) + one-shot
backfill from property_details.listing_events for pre-trigger history.
Tax reassessment forecast LA · Resets to sale price
- Current annual tax
- $1,590 · $132/mo
- Projected year-2 tax
- $1,590 · $132/mo
- Expected delta
- $0/yr ($0/mo · 0.0%)
ⓘ Screening estimate from a state-policy table — verify with the county assessor before closing.
Climate risk First Street
- Flood 1/10 Low FEMA zone X (unshaded) · 0% chance over 30 yrs
- Wildfire 4/10 Moderate
- Heat 7/10 Severe 7 d/yr ≥110°F today · 22 d/yr by 30 yrs out
- Wind 6/10 Major 62% chance of damaging wind over 30 yrs
- Air quality 2/10 Low 0 unhealthy d/yr today · 1 by 30 yrs out
Nearby sold comps map
Loading sold comps map…
Walkable amenities ~0.75 mi
Loading nearby amenities…
Taxation est. · year 1
- Rental income
- $14,253
- − Mortgage interest
- −$11,091
- − Property taxes
- −$1,590
- − Insurance
- −$990
- − Repairs & maintenance
- −$1,140
- − Management
- −$1,140
- − Depreciation
- −$5,760
- Taxable loss
- −$7,458
- Est. tax savings @ 24.0%
- +$1,790
- After-tax cash flow
- $-1,990/yr
For passive investors: Depreciation is non-cash, so a rental often shows a tax loss while cash-flowing — sheltering income. Rental losses are passive: they offset passive income freely, and up to $25,000/yr can offset ordinary (W-2) income if you actively participate and your MAGI is under $100k (phasing out to $0 by $150k); unused losses carry forward. On sale, claimed depreciation is recaptured at up to 25%, and gains may owe capital-gains tax (a 1031 exchange can defer both). Figures are a year-1 estimate at your 24.0% rate — not tax advice; consult a CPA.
Schools (NCES district)
- District
- Bossier Parish
- NCES district ID
- 2200270
- Math proficiency
- 40% ▼ -32.00%
- Reading proficiency
- 47% ▼ -28.00%
- Median HH income
- $51,326
- Composite
- 37.5/100
- National rank
- #4402
- State rank
- #17 of 98 in LA
Livability — Eastwood
- Score
- 61/100
- State rank
- #241
- US rank
- #18386
Category grades
Schools grade is shown separately in the Schools card above.
Census & demographics
- Population (ZIP)
- 3,245
Population outlook (Bossier County) Hauer SSP2
- Today (2025)
- 143,247 people
- By 2030
- 151,802 · +6.0%
- By 2040
- 168,194 · +17.4%
- By 2050
- 183,533 · +28.1%
- By 2075
- 217,009 · +51.5%
- By 2100
- 230,091 · +60.6%
Race, ethnicity, and origin ACS 2023
- Neighborhood character
- Majority White (58%)
- Race & ethnicity
- White 58% Black 34% Hispanic / Latino 7% Two or more races 3% Native American 1%
- Hispanic origin (detail)
- Mexican 7%
- Common ancestry
- Slovak 3% Iranian 1%
- Foreign-born
- 1% · Canada
- Languages at home
- 94% English-only · Spanish 6%
Political lean MEDSL · Bossier
- 2024 margin
- Solid R (+43.3) · D 27.7% · R 71.0% · Other 1.3%
- 2008→2024 swing
- +0.3pp no change · 2008: -43.7pp · 2024: -43.3pp
- All cycles
- 2024: R+43.3 2020: R+41.0 2016: R+45.8 2012: R+45.4 2008: R+43.7
Not yet ingested
- Civics
- —
Market trends
- HPI YoY
- ▲ 3.72%
- Current HPI
- 160.0526
- Rent YoY
- —
- Metro
- —
- State GDP YoY
- ▲ 3.29%
- F500 in state
- 10
Industry mix (Fortune 500 HQ in LA)
| Industry | F500 HQs | Revenue |
|---|---|---|
| Telecommunications | 2 | $23B |
|
||
| Utilities | 1 | $12B |
|
||
| Wholesale / Distribution | 1 | $5B |
|
||
| Advertising | 1 | $2B |
|
||
Price history
-5.7% since first listed3 events — show timeline
- 2026-04-30 Price Changed $198,000 NTREIS
- 2026-03-02 Price Changed $205,000 NTREIS
- 2026-01-12 Listed $210,000 NTREIS
Property tax history
+13.3%/yrLatest (2025): $1,590 · +0.4% YoY. Source: county tax records.
Cash-flow waterfall
monthlySold comps — $/sqft
last 12 mo · ≤1 miLoading sold comps…