3523 Santiago Way · Naples, FL
Flood risk 8/10 · Major
- FEMA flood zone
- AE
- Chance of flooding over 30 yrs
- 0.99%
- Est. flood insurance / yr
- $1,737 – $8,500
Fire risk 1/10 · Minimal
- Est. fire insurance / yr
- $947 – $1,759
Heat risk 10/10 · Severe
- Hot days now (above 107°F)
- 7 days/yr
- Hot days in 30 yrs
- 29 days/yr
Wind risk 10/10 · Severe
- Chance of severe wind over 30 yrs
- 99.0%
Air-quality risk 2/10 · Minimal
- Unhealthy air days now
- 2 days/yr
- Unhealthy air days in 30 yrs
- 2 days/yr
Risk factors via First Street. Map © Google.
Why this score? — see what drove the B- grade
The composite is a weighted blend of 9 inputs, each scored 0–100. Each bar is that input's sub-score; the figure is the points it added to the 100-point composite (weight × sub-score).
- Cash flow +29.5/30.0
- DSCR +10.0/10.0
- ARV discount +7.5/15.0
- 1% rule +6.9/10.0
- Schools +5.0/10.0
- Livability +4.0/5.0
- Rent growth +2.7/5.0
- Condition / age +2.5/5.0
- Appreciation +0.0/10.0
$499,900
🖨 Deal sheet 📄 Offer letter ✓ Due diligence
Listing remarks MLS
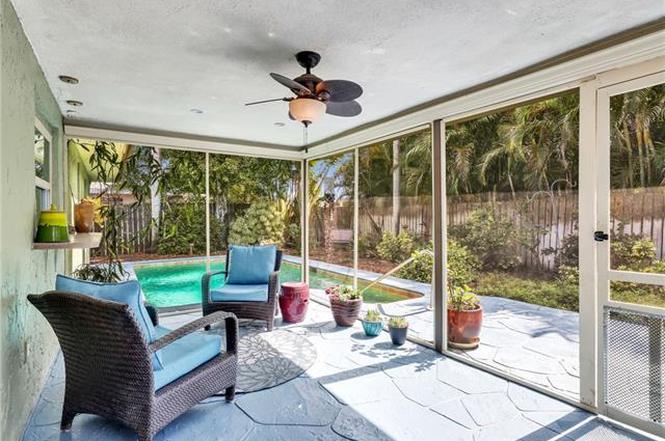
Fantastic 3/2 pool home located in the back of the community.
Key facts
- Quartz countertops
- Mature fruit trees
- Central naples
Tags
Property features AI
Finance
- Other: Development: Poinciana Village; Lot is regular-shaped, approximately 0.17 acres; Lot dimensions (approx): 75 front, 100 left, 100 right, 75 back
- HOA & community: Community amenities include basketball, pickleball, play area, sidewalks and tennis court; Non-gated community; HOA maintenance: None
Exterior
- Parking: Attached 2-car garage; Auto garage door
- Utilities: Central water; Central sewer; Cable available; Electric power (central)
- Home design: Residential single-family home; 1 story / ranch; Rear exposure SE; Stucco exterior
- Construction: Concrete block construction; Shingle roof; Single hung windows; Built in 1973
- Exterior features: Fenced yard; Fruit trees; Automatic sprinkler system; Screened lanai/porch; Landscaped view; Private pool (below-ground, concrete)
Interior
- Kitchen: Range; Microwave; Dishwasher; Disposal; Refrigerator
- Bedrooms: 3 bedrooms; Split bedrooms layout
- Flooring: Tile; Vinyl; Wood
- Bathrooms: 2 full bathrooms; Master bath with shower only
- Heating & cooling: Central electric heat; Central electric cooling
- Interior features: Bar; Built-in cabinets; Cable prewire; Laundry tub; Walk-in closet; Window coverings; Eat-in kitchen; Laundry in garage; Screened lanai/porch; Great room floor plan; Split bedroom floor plan
- Laundry & utility: Washer; Dryer; Laundry tub; Laundry located in garage
Neighborhood map
What this means for you Summary
Snapshot
- This is a 3-bed/2.0-bath single-family listed at $500k.
Deal economics
- At list price, monthly cash flow is $1k ($16k/yr) — positive.
- The deal already cash-flows at list — no discount required.
- Meets the 1% rule at list price ($6k rent vs $500k).
- Recommended offer: $470k (6.0% below list) — sets the bar for market timing.
Location & tenants
- Location reads 80/100 on livability (#126 in FL, #1,903 nationally) — a professional / high-income tenant draw. Strengths: crime A+, amenities A+, employment A+; Watch: commute D+, cost of living F.
- Collier (suburban): math 60% / reading 56% proficiency, ranked #16 of 73 in FL (top 22%) — acceptable for families but not a draw, mixed tenant base, ~2y average lease.
- Market conditions: Rents flat; 329 active listings in the ZIP; 25 comparable units currently listed for rent nearby; rentals leasing fast (median 14d on market — plan ~1-2 weeks tenant-placement turnaround); solid renter incomes; 3,520 units permitted in Collier County in 2024 (959 in 5+ unit buildings).
- At $5,970/mo this rent would consume 78% of the median local household income ($92k/yr) (locally 780% of renters already pay >50% of income on rent) — very limited rent-growth headroom before tenants either downsize or default.
Forward outlook
- Local home prices are declining (-3.0%/yr); year-one equity from $3k of loan paydown is wiped out by about $15k of value loss. Plan a longer hold.
- Collier County population projected at +30% by 2050 — long-run rental-demand tailwind backs the buy-and-hold thesis.
Negotiation context
- It's been on market 67 days — a 6% lower offer ($470k) is reasonable based on typical stale-listing flexibility.
- 4 sale attempts since 17y ago; this cycle's ask has dropped $39k (7%) from the opening price — seller is motivated, your offer sets the floor, not the list.
- Current owner paid $150k; list at $500k implies a 233% gain — meaningful room to come down on a strong offer.
Risks & watch-outs
- Watch-outs: flood insurance adds $427/mo.
- Climate carrying-cost: in FEMA flood zone AE (mandatory federal flood insurance); severe wind risk, 99% chance of damaging wind over 30y; extreme-heat days projected 7→29/yr by 2055 (HVAC capex compounding) — expect insurance premiums to compound above CPI over the hold.
Questions for the listing agent
- It's been on market 67 days. Have you received any prior offers? Is the seller open to a 6% concession, seller financing, or rate buy-down credit?
- Built in 1973 — when were the roof, HVAC, electrical panel, plumbing, and water heater last replaced?
- What's the actual annual flood-insurance premium (NFIP or private), and is the property in a SFHA with mandatory coverage?
- Why hasn't it sold? Are there any deal-killer items the seller is aware of (foundation, flood, title, zoning, code violations)?
- Is there a deadline driving the sale (1031 exchange, divorce, estate, relocation)? That informs how much negotiation room exists.
- Schools are B-rated — typically a magnet for longer-tenancy family renters. What's the average tenant stay here, and is there a school-zone premium baked into asking?
- What's the average days-on-market for RENTAL listings here right now (not sales)? A rising rental-DOM trend means longer vacancies and softer asking-rent achievability than the comps imply.
- What's the recent tenant-quality profile in this submarket — average credit score on applications, eviction rate, late-payment / NSF rate, and stable-employment percentage? A property-management company in the area should have these aggregated.
- How much new for-sale + rental construction is in the pipeline within 1–3 miles? Heavy new supply typically softens prices + rents 12–24 months out; constrained supply supports both.
Investment metrics
- 1% rule
- 1.19% ✓
- Cap rate
- 10.57%
- Cash-on-cash
- 15.28%
- DSCR
- 1.68
- GRM
- 7.0
CMA / ARV
No comps found within radius.
Projected returns pro-forma
-3.0% appreciation · 0.85% rent growth · sell at horizon
- IRR
- -1.4%
- Equity multiple
- 0.95×
- Total profit
- $-7,239
- Equity at exit
- $74,537
- IRR
- 5.9%
- Equity multiple
- 1.40×
- Total profit
- $55,360
- Equity at exit
- $43,222
Cash invested: $139,972 (down + closing). Projections, not guarantees.
Landlord ↔ Tenant lean methodology
- Overall (STATE)
- 87 Strongly Landlord-Friendly
- State Florida
- 87 Strongly Landlord-Friendly · R+3
- County
- — inherits STATE
- City
- — inherits STATE
ZIP-level market 34105
- Home prices YoY
- -30.5%
- Rents YoY
- 0.8%
- Active inventory
- 329
- Price-to-rent
- 7.0×
Monthly cashflow live
- Estimated rent
- $5,970 high interval (Pro) →
- Mortgage (P&I)
- −$2,622
- Tax from tax record
- −$104 /mo · $1,244/yr
- Insurance
- −$208
- Flood insurance flood zone
- −$427 /mo · $5,118/yr
- HOA
- −$0
- Vacancy / Maint / Mgmt
- −$1,254
- Net cashflow
- $1,356
Break-even live
UW: 25.0% down · 7.5% · 30yr · 1.5% tax · 5.0% vac · 8.0% maint · 8.0% mgmt
Financing live
Cash to close
- Down payment
- $124,975
- Closing costs
- $14,997
- Reserves months
- —
- Total cash needed
- —
Loan-product check · same deal, 3 products live
Conventional
25% down · 7.5% · 30yr
- Down + closing
- —
- Monthly P&I
- —
- Monthly cashflow
- —
- DSCR
- —
- Eligible?
- —
Personal DTI + credit; lowest rate.
DSCR
20% down · 8.5% · 30yr
- Down + closing
- —
- Monthly P&I
- —
- Monthly cashflow
- —
- DSCR
- —
- Eligible?
- —
No personal income docs; deal must DSCR.
Hard money
10% down · 12.0% · 12mo
- Down + closing
- —
- Monthly P&I
- —
- Monthly cashflow
- —
- DSCR
- —
- Eligible?
- —
Short-term bridge; refi at stabilization.
Rent comps 25 comps
| Address | Beds | Baths | Sqft | Rent | $/sqft | DOM | Units | Dist |
|---|---|---|---|---|---|---|---|---|
| 3511 Santiago Way Naples, FL | 4.0 | 2.0 | 1800 | $6,500 | $3.61 | 23d | 1 | 0.06mi |
| 2581 Poinciana St Naples, FL | 3.0 | 2.0 | 1255 | $9,000 | $7.17 | 23d | 1 | 0.17mi |
| 3520 Bolero Way Unit 1325569P Naples, FL | 3.0 | 2.0 | 1399 | $5,021 | $3.59 | 13d | 1 | 0.25mi |
| 500 Misty Pines Cir #206 Naples, FL | 2.0 | 2.0 | 1260 | $6,000 | $4.76 | 13d | 1 | 0.93mi |
| 500 Misty Pines Cir Unit 2-204 Naples, FL | 2.0 | 2.0 | 1260 | $5,750 | $4.56 | 13d | 1 | 0.93mi |
| 1350 Misty Pines Cir Unit E-204 Naples, FL | 2.0 | 2.0 | 1200 | $7,500 | $6.25 | 13d | 1 | 1.00mi |
| 3308 Europa Dr #30 Naples, FL | 2.0 | 2.0 | 1205 | $5,500 | $4.56 | 23d | 1 | 1.02mi |
| 1044 Woodshire Ln Unit B212 Naples, FL | 3.0 | 2.0 | 1250 | $8,000 | $6.40 | 23d | 1 | 1.13mi |
| 522 Wildwood Ln #522 Naples, FL | 2.0 | 2.0 | 1656 | $8,000 | $4.83 | 23d | 1 | 1.15mi |
| 45 High Point Cir S #303 Naples, FL | 2.0 | 2.0 | 1015 | $5,500 | $5.42 | 23d | 1 | 1.24mi |
| 2400 14th St N Naples, FL | 3.0 | 2.0 | 1464 | $5,890 | $4.02 | 13d | 1 | 1.30mi |
| 202 Bears Paw Trl #97 Naples, FL | 2.0 | 2.0 | 1665 | $10,000 | $6.01 | 23d | 1 | 1.33mi |
| 1860 Bald Eagle Dr Unit 403B Naples, FL | 2.0 | 2.0 | 1325 | $3,000 | $2.26 | 13d | 1 | 1.35mi |
| 1545 Oyster Catcher Pt Unit A Naples, FL | 2.0 | 2.0 | 1124 | $2,200 | $1.96 | 13d | 1 | 1.38mi |
| 287 Quail Forest Blvd #117 Naples, FL | 2.0 | 2.0 | 993 | $1,695 | $1.71 | 13d | 1 | 1.38mi |
| 287 Quail Forest Blvd #117 Naples, FL | 2.0 | 2.0 | 993 | $1,995 | $2.01 | 21d | 1 | 1.38mi |
| 1097 Frank Whiteman Blvd Naples, FL | 4.0 | 3.0 | 1590 | $10,900 | $6.86 | 23d | 1 | 1.40mi |
| 1629 Spoonbill Ln Unit 1629-A Naples, FL | 2.0 | 2.0 | 1250 | $2,000 | $1.60 | 13d | 1 | 1.41mi |
| 2680 Longboat Dr Naples, FL | 3.0 | 2.0 | 1528 | $11,000 | $7.20 | 23d | 1 | 1.41mi |
| 1085 Forest Lakes Dr Unit 8106 Naples, FL | 2.0 | 2.0 | 1000 | $1,900 | $1.90 | 13d | 1 | 1.41mi |
| 1085 Forest Lakes Dr Unit 8202 Naples, FL | 2.0 | 2.0 | 1086 | $2,800 | $2.58 | 13d | 1 | 1.41mi |
| 1554 Oyster Catcher Pt Unit C Naples, FL | 2.0 | 2.0 | 1124 | $2,900 | $2.58 | 23d | 1 | 1.42mi |
| 260 Quail Forest Blvd Naples, FL | 1.0–2.0 | 1.0–2.0 | 875 | $2,533 | $2.89 | 13d | 22 | 1.44mi |
| 2328 Clipper Way Naples, FL | 2.0 | 2.0 | 1469 | $10,000 | $6.81 | 23d | 1 | 1.44mi |
| 1086 Forest Lakes Dr Unit 9303 Naples, FL | 2.0 | 2.0 | 1000 | $2,395 | $2.40 | 13d | 1 | 1.49mi |
Listing history 20 events
-
2026-05-06status Pending
-
2026-04-25price $499,900
-
2026-04-25price $514,900
-
2026-03-21price $524,900
-
2026-02-28$539,000 Active
-
2026-02-18historical
-
2026-02-14price $550,000
-
2026-02-08price $563,000
-
2026-01-19price $570,000
-
2026-01-08price $580,000
-
2025-12-26price $585,000
-
2025-11-21price $588,000
-
2025-09-22$593,000 Active
-
2010-10-06soldstatus $150,000
-
2010-09-30soldstatus $150,000 61-char remark
Show marketing remark (61 chars)
Fantastic 3/2 pool home located in the back of the community.
-
2010-03-17$170,000 61-char remark
Show marketing remark (61 chars)
Fantastic 3/2 pool home located in the back of the community.
-
2009-06-15$310,000
-
2006-05-05soldstatus $343,000
-
2000-10-02soldstatus $146,200
-
1992-02-01soldstatus $91,000
ⓘ Source: listings_history table (triggers on properties + properties_extension) + one-shot
backfill from property_details.listing_events for pre-trigger history.
Tax reassessment forecast FL · Resets to sale price
- Current annual tax
- $1,244 · $104/mo
- Projected year-2 tax
- $4,149 · $346/mo
- Expected delta
- +$2,906/yr (+$242/mo · 233.7%)
ⓘ Screening estimate from a state-policy table — verify with the county assessor before closing.
Climate risk First Street
- Flood 8/10 Severe FEMA zone AE · 99% chance over 30 yrs
- Wildfire 1/10 Low
- Heat 10/10 Extreme 7 d/yr ≥107°F today · 29 d/yr by 30 yrs out
- Wind 10/10 Extreme 99% chance of damaging wind over 30 yrs
- Air quality 2/10 Low 2 unhealthy d/yr today · 2 by 30 yrs out
Nearby sold comps map
Loading sold comps map…
Walkable amenities ~0.75 mi
Loading nearby amenities…
Taxation est. · year 1
- Rental income
- $71,639
- − Mortgage interest
- −$28,002
- − Property taxes
- −$1,244
- − Insurance
- −$7,618
- − Repairs & maintenance
- −$5,731
- − Management
- −$5,731
- − Depreciation
- −$14,543
- Taxable income
- $8,770
- Est. tax owed @ 24.0%
- −$2,105
- After-tax cash flow
- $14,170/yr
For passive investors: Depreciation is non-cash, so a rental often shows a tax loss while cash-flowing — sheltering income. Rental losses are passive: they offset passive income freely, and up to $25,000/yr can offset ordinary (W-2) income if you actively participate and your MAGI is under $100k (phasing out to $0 by $150k); unused losses carry forward. On sale, claimed depreciation is recaptured at up to 25%, and gains may owe capital-gains tax (a 1031 exchange can defer both). Figures are a year-1 estimate at your 24.0% rate — not tax advice; consult a CPA.
Schools (NCES district)
- District
- Collier
- NCES district ID
- 1200330
- Math proficiency
- 60% ▼ -4.00%
- Reading proficiency
- 56% ▼ -2.00%
- Median HH income
- $58,275
- Composite
- 50.23/100
- National rank
- #1892
- State rank
- #16 of 73 in FL
Livability — Naples
- Score
- 80/100
- State rank
- #126
- US rank
- #1903
Category grades
Schools grade is shown separately in the Schools card above.
Census & demographics
- County
- Collier County · 396,295 people
- City population
- 344,941
- Metro
- Naples-Marco Island, FL
- Population (ZIP)
- 15,441
- Household income
- $92,214
- Rent vs Own
- Severe rent burden
- 780.0
Population outlook (Collier County) Hauer SSP2
- Today (2025)
- 420,858 people
- By 2030
- 450,054 · +6.9%
- By 2040
- 502,232 · +19.3%
- By 2050
- 544,932 · +29.5%
- By 2075
- 627,203 · +49.0%
- By 2100
- 659,015 · +56.6%
Race, ethnicity, and origin ACS 2023
- Neighborhood character
- Predominantly White (79%)
- Race & ethnicity
- White 79% Hispanic / Latino 14% Two or more races 7% Asian 5%
- Hispanic origin (detail)
- Mexican 3% Puerto Rican 1% Cuban 3% Salvadoran 1%
- Common ancestry
- Romanian 3% Lithuanian 3% Italian 3%
- Foreign-born
- 22% · Canada, China, Jamaica
- Languages at home
- 77% English-only · Spanish 11% Other Indo-European 3% Russian/Polish/Slavic 3%
Political lean MEDSL · Collier
- 2024 margin
- Solid R (+33.1) · D 33.1% · R 66.2%
- 2008→2024 swing
- -10.6pp toward R · 2008: -22.5pp · 2024: -33.1pp
- All cycles
- 2024: R+33.1 2020: R+24.7 2016: R+26.0 2012: R+30.1 2008: R+22.5
Not yet ingested
- Civics
- —
Market trends
- HPI YoY
- ▼ -124.65%
- Current HPI
- 283.9084
- Rent YoY
- ▲ 0.85%
- Metro
- Naples-Marco Island, FL
- State GDP YoY
- ▲ 3.28%
- F500 in state
- 36
Industry mix (Fortune 500 HQ in FL)
| Industry | F500 HQs | Revenue |
|---|---|---|
| Industrial Technology | 2 | $29B |
|
||
| Insurance | 2 | $17B |
|
||
| Retail | 1 | $60B |
|
||
| Technology Distribution | 1 | $58B |
|
||
| Homebuilding | 1 | $35B |
|
||
| Technology Manufacturing | 1 | $35B |
|
||
Price history
+449.3% since first listed20 events — show timeline
- 2026-05-06 Pending — NAPLESMLS
- 2026-04-25 Price Changed $499,900 NAPLESMLS
- 2026-04-25 Price Changed $514,900 NAPLESMLS
- 2026-03-21 Price Changed $524,900 NAPLESMLS
- 2026-02-28 Listed $539,000 NAPLESMLS
- 2026-02-18 Listing Removed — FORTMLS
- 2026-02-14 Price Changed $550,000 FORTMLS
- 2026-02-08 Price Changed $563,000 FORTMLS
- 2026-01-19 Price Changed $570,000 FORTMLS
- 2026-01-08 Price Changed $580,000 FORTMLS
- 2025-12-26 Price Changed $585,000 FORTMLS
- 2025-11-21 Price Changed $588,000 FORTMLS
- 2025-09-22 Listed $593,000 FORTMLS
- 2010-10-06 Sold (Public Records) $150,000 Public Records
- 2010-09-30 Sold (MLS) $150,000 NAPLESMLS
- 2010-03-17 Listed $170,000 NAPLESMLS
- 2009-06-15 Listed $310,000 NAPLESMLS
- 2006-05-05 Sold (Public Records) $343,000 Public Records
- 2000-10-02 Sold (Public Records) $146,200 Public Records
- 1992-02-01 Sold (Public Records) $91,000 Public Records
Property tax history
+3.5%/yrLatest (2025): $1,244 · +2.8% YoY. Source: county tax records.
Cash-flow waterfall
monthlySold comps — $/sqft
last 12 mo · ≤1 miLoading sold comps…