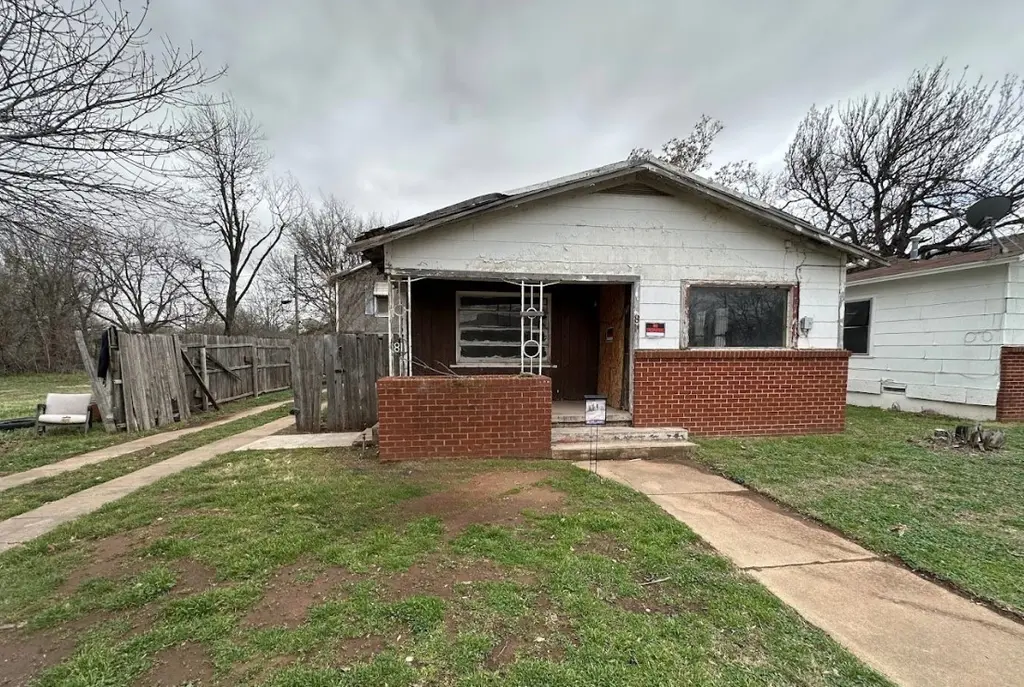
811 Tulsa St · Wichita Falls, TX
Flood risk 4/10 · Minor
- FEMA flood zone
- X (unshaded)
- Chance of flooding over 30 yrs
- 0.2%
- Est. flood insurance / yr
- $507 – $1,088
Fire risk 8/10 · Major
- Est. fire insurance / yr
- $1,222 – $2,270
Heat risk 7/10 · Major
- Hot days now (above 109°F)
- 7 days/yr
- Hot days in 30 yrs
- 20 days/yr
Wind risk 4/10 · Minor
- Chance of severe wind over 30 yrs
- 9.0%
Air-quality risk 1/10 · Minimal
- Unhealthy air days now
- 0 days/yr
- Unhealthy air days in 30 yrs
- 0 days/yr
Risk factors via First Street. Map © Google.
Why this score? — see what drove the B+ grade
The composite is a weighted blend of 9 inputs, each scored 0–100. Each bar is that input's sub-score; the figure is the points it added to the 100-point composite (weight × sub-score).
- Cash flow +30.0/30.0
- ARV discount +13.7/15.0
- 1% rule +10.0/10.0
- DSCR +10.0/10.0
- Rent growth +3.8/5.0
- Livability +3.5/5.0
- Schools +2.7/10.0
- Condition / age +2.5/5.0
- Appreciation +0.0/10.0
$31,349
🖨 Deal sheet (PDF) 📄 Offer letter ✓ Due diligence
Listing remarks MLS
NEAR WILLIAMS PARK! The property at 811 Tulsa St in Wichita Falls, TX, is perfectly situated for those looking to embrace the city's vibrant life, featuring a mix of cultural, recreational, and community offerings. Near downtown, it provides easy access to dining, shopping, and entertainment, along with outdoor adventures around the Wichita River and falls. Ideal for families, thanks to nearby schools and community centers, this property offers urban convenience within a close-knit community setting. It's an excellent choice for anyone seeking a dynamic yet community-focused lifestyle in Wichita Falls. This property features 2 bedrooms and 1 bath. It needs some TLC, but has lots of potential. WE MAKE IT EASY TO OWN. This is a great opportunity! Don't wait call us today to get more information on the owner's easy terms and smooth process that may be able to put the deed in your name and make this your dream property. When you call ask about the WICHITA FALLS INVESTOR PACKAGE.
Key facts
- Near williams park
- Community centers
- Nearby schools
Tags
Neighborhood map
What this means for you Summary
Snapshot
- This is a 3-bed/2.0-bath single-family listed at $31k.
Deal economics
- At list price, monthly cash flow is $657 ($8k/yr) — positive.
- The deal already cash-flows at list — no discount required.
- Meets the 1% rule at list price ($1k rent vs $31k).
- Recommended offer: $28k (12.0% below list) — sets the bar for market timing.
- Cap rate 31.4% vs local median 4.7% in Wichita Falls — top-decile yield for the area; either an underpriced asset or a hidden risk that comps aren't pricing in. Stress-test before assuming the spread holds.
Location & tenants
- Location reads 69/100 on livability (#437 in TX) — a middle-class / working-renter tenant base. Strengths: cost of living A+, housing A+; Watch: health & safety C-, employment D+, schools D.
- Wichita Falls ISD (urban): math 31% / reading 33% proficiency, ranked #585 of 826 in TX (top 71%) — families likely to look elsewhere, expect single-tenant / working-renter base with shorter leases.
- Market conditions: Rents rising fast (+5.3%/yr); 133 active listings in the ZIP; 8 comparable units currently listed for rent nearby; rentals lingering (median 45d on market — plan ~5-8 weeks vacancy on turnover, expect pricing pressure); 100% of comp listings sitting > 30 days — soft ceiling on asking rent; lower-income renter base — watch delinquency; 231 units permitted in Wichita County in 2024 (10 in 5+ unit buildings).
- This rent runs 31% of the median local income ($42k/yr) — at the standard rent-burdened threshold; future hikes will face affordability resistance.
Forward outlook
- Local home prices are declining (-3.0%/yr); year-one equity from $217 of loan paydown is wiped out by about $940 of value loss. Plan a longer hold.
- Wichita County population projected to shrink 7% by 2050 — rents likely to lag national; underwrite the cash flow, not the appreciation.
- At projected returns (-3.0% appreciation + 5.3% rent growth), your $9k cash investment doubles in ~2 years — after that, you're playing with house money.
Negotiation context
- It's been on market 459 days — a 12% lower offer ($28k) is reasonable based on typical stale-listing flexibility.
Risks & watch-outs
- Watch-outs: built in 1935 — expect roof / HVAC / electrical / plumbing capex.
- Climate carrying-cost: severe wildfire risk; extreme-heat days projected 7→20/yr by 2055 (HVAC capex compounding) — expect insurance premiums to compound above CPI over the hold.
Questions for the listing agent
- It's been on market 459 days. Have you received any prior offers? Is the seller open to a 12% concession, seller financing, or rate buy-down credit?
- Built in 1935 — when were the roof, HVAC, electrical panel, plumbing, and water heater last replaced?
- Why hasn't it sold? Are there any deal-killer items the seller is aware of (foundation, flood, title, zoning, code violations)?
- Is there a deadline driving the sale (1031 exchange, divorce, estate, relocation)? That informs how much negotiation room exists.
- Schools are D-rated, which usually means shorter tenancies and higher turnover. Who's the typical renter profile here, and what's been the actual vacancy rate?
- Crime grade is D in this area — have there been break-ins, vandalism, or insurance claims at this property in the last 3 years? What carrier currently insures it and at what premium?
- What's the average days-on-market for RENTAL listings here right now (not sales)? A rising rental-DOM trend means longer vacancies and softer asking-rent achievability than the comps imply.
- What's the recent tenant-quality profile in this submarket — average credit score on applications, eviction rate, late-payment / NSF rate, and stable-employment percentage? A property-management company in the area should have these aggregated.
- How much new for-sale + rental construction is in the pipeline within 1–3 miles? Heavy new supply typically softens prices + rents 12–24 months out; constrained supply supports both.
Investment metrics
- 1% rule
- 3.41% ✓
- Cap rate
- 31.45%
- Cash-on-cash
- 89.84%
- DSCR
- 5.00
- GRM
- 2.4
CMA / ARV
- ARV (median comp)
- $36,386
- List price
- $31,349
- Delta
- -13.84%
- Verdict
- UNDERPRICED
- Comps
- 3 within 1.0 mi
Projected returns pro-forma
-3.0% appreciation · 5.27% rent growth · sell at horizon
- IRR
- 93.0%
- Equity multiple
- 5.47×
- Total profit
- $39,270
- Equity at exit
- $4,674
- IRR
- 96.2%
- Equity multiple
- 12.26×
- Total profit
- $98,821
- Equity at exit
- $2,710
Cash invested: $8,778 (down + closing). Projections, not guarantees.
Landlord ↔ Tenant lean methodology
- Overall (STATE)
- 87 Strongly Landlord-Friendly
- State Texas
- 87 Strongly Landlord-Friendly · R+5
- County
- — inherits STATE
- City
- — inherits STATE
ZIP-level market 76301
- Home prices YoY
- -34.1%
- Rents YoY
- 5.3%
- Active inventory
- 133
- Price-to-rent
- 2.4×
Monthly cashflow live
- Estimated rent
- $1,070 high interval (Pro) →
- Mortgage (P&I)
- −$164
- Tax from tax record
- −$10 /mo · $125/yr
- Insurance
- −$13
- HOA
- −$0
- Vacancy / Maint / Mgmt
- −$225
- Net cashflow
- $657
Break-even live
Sensitivity live
| Price | -10% $675 | -5% $666 | +0% $657 | +5% $648 | +10% $639 |
|---|---|---|---|---|---|
| Rent | -10% $573 | -5% $615 | +0% $657 | +5% $699 | +10% $742 |
| Rate | -1.0pp $673 | -0.5pp $665 | base $657 | +0.5pp $649 | +1.0pp $641 |
UW: 25.0% down · 7.5% · 30yr · 1.5% tax · 5.0% vac · 8.0% maint · 8.0% mgmt
Financing live
Cash to close
- Down payment
- $7,837
- Closing costs
- $940
- Reserves months
- —
- Total cash needed
- —
Loan-product check · same deal, 3 products live
Conventional
25% down · 7.5% · 30yr
- Down + closing
- —
- Monthly P&I
- —
- Monthly cashflow
- —
- DSCR
- —
- Eligible?
- —
Personal DTI + credit; lowest rate.
DSCR
20% down · 8.5% · 30yr
- Down + closing
- —
- Monthly P&I
- —
- Monthly cashflow
- —
- DSCR
- —
- Eligible?
- —
No personal income docs; deal must DSCR.
Hard money
10% down · 12.0% · 12mo
- Down + closing
- —
- Monthly P&I
- —
- Monthly cashflow
- —
- DSCR
- —
- Eligible?
- —
Short-term bridge; refi at stabilization.
Rent comps 8 comps
| Address | Beds | Baths | Sqft | Rent | $/sqft | DOM | Units | Dist |
|---|---|---|---|---|---|---|---|---|
| 1001 Redwood Ave Wichita Falls, TX | 1.0–3.0 | 1.0–2.0 | 928 | $993 | $1.07 | 45d | 2 | 0.17mi |
| 1209 Gladiolus St Wichita Falls, TX | 3.0 | 1.0 | 1214 | $900 | $0.74 | 45d | 1 | 0.22mi |
| 1208 Williams Ave Wichita Falls, TX | 3.0 | 2.0 | 909 | $1,199 | $1.32 | 45d | 1 | 0.29mi |
| 33 Grant Gill Ln Wichita Falls, TX | 2.0 | 1.0 | 952 | $1,000 | $1.05 | 45d | 1 | 0.47mi |
| 1620 Andrews Dr Wichita Falls, TX | 3.0 | 1.5 | 1130 | $1,095 | $0.97 | 45d | 1 | 0.63mi |
| 1200 Thompson Rd Wichita Falls, TX | 1.0–3.0 | 1.0–2.0 | 925 | $1,020 | $1.10 | 45d | 7 | 0.78mi |
| 9 Shiver Cir Unit 1 Wichita Falls, TX | 2.0 | 2.0 | 1056 | $850 | $0.80 | 45d | 1 | 1.47mi |
| 1618 Orchard Ave Wichita Falls, TX | 2.0 | 1.0 | 920 | $700 | $0.76 | 45d | 1 | 1.48mi |
Listing history 18 events
-
2026-06-19days on market $31,349 Active 459 DOM
-
2026-06-18days on market $31,349 Active 458 DOM
-
2026-06-17days on market $31,349 Active 457 DOM
-
2026-06-16days on market $31,349 Active 456 DOM
-
2026-06-15days on market $31,349 Active 455 DOM
-
2026-06-14days on market $31,349 Active 453 DOM
-
2026-06-13days on market $31,349 Active 452 DOM
-
2026-06-10days on market $31,349 Active 450 DOM
-
2026-06-09days on market $31,349 Active 449 DOM
-
2026-06-08days on market $31,349 Active 448 DOM
-
2026-06-07days on market $31,349 Active 447 DOM
-
2026-06-05days on market $31,349 Active 444 DOM
-
2026-06-02days on market $31,349 Active 442 DOM
-
2026-06-01days on market $31,349 Active 441 DOM
-
2026-05-31days on market $31,349 Active 440 DOM
-
2026-05-30days on market $31,349 Active 439 DOM
-
2025-03-17$31,349 Active 989-char remark
Show marketing remark (989 chars)
NEAR WILLIAMS PARK! The property at 811 Tulsa St in Wichita Falls, TX, is perfectly situated for those looking to embrace the city's vibrant life, featuring a mix of cultural, recreational, and community offerings. Near downtown, it provides easy access to dining, shopping, and entertainment, along with outdoor adventures around the Wichita River and falls. Ideal for families, thanks to nearby schools and community centers, this property offers urban convenience within a close-knit community setting. It's an excellent choice for anyone seeking a dynamic yet community-focused lifestyle in Wichita Falls. This property features 2 bedrooms and 1 bath. It needs some TLC, but has lots of potential. WE MAKE IT EASY TO OWN. This is a great opportunity! Don't wait call us today to get more information on the owner's easy terms and smooth process that may be able to put the deed in your name and make this your dream property. When you call ask about the WICHITA FALLS INVESTOR PACKAGE.
-
2023-08-28soldstatus
ⓘ Source: listings_history table (triggers on properties + properties_extension) + one-shot
backfill from property_details.listing_events for pre-trigger history.
Tax reassessment forecast TX · Resets to sale price
- Current annual tax
- $125 · $10/mo
- Projected year-2 tax
- $574 · $48/mo
- Expected delta
- +$448/yr (+$37/mo · 357.7%)
ⓘ Screening estimate from a state-policy table — verify with the county assessor before closing.
Climate risk First Street
- Flood 4/10 Moderate FEMA zone X (unshaded) · 20% chance over 30 yrs
- Wildfire 8/10 Severe
- Heat 7/10 Severe 7 d/yr ≥109°F today · 20 d/yr by 30 yrs out
- Wind 4/10 Moderate 9% chance of damaging wind over 30 yrs
- Air quality 1/10 Low 0 unhealthy d/yr today · 0 by 30 yrs out
Nearby sold comps map
Loading sold comps map…
Walkable amenities ~0.75 mi
Loading nearby amenities…
Taxation est. · year 1
- Rental income
- $12,836
- − Mortgage interest
- −$1,756
- − Property taxes
- −$125
- − Insurance
- −$157
- − Repairs & maintenance
- −$1,027
- − Management
- −$1,027
- − Depreciation
- −$912
- Taxable income
- $7,832
- Est. tax owed @ 24.0%
- −$1,880
- After-tax cash flow
- $6,006/yr
For passive investors: Depreciation is non-cash, so a rental often shows a tax loss while cash-flowing — sheltering income. Rental losses are passive: they offset passive income freely, and up to $25,000/yr can offset ordinary (W-2) income if you actively participate and your MAGI is under $100k (phasing out to $0 by $150k); unused losses carry forward. On sale, claimed depreciation is recaptured at up to 25%, and gains may owe capital-gains tax (a 1031 exchange can defer both). Figures are a year-1 estimate at your 24.0% rate — not tax advice; consult a CPA.
Schools (NCES district)
- District
- Wichita Falls ISD
- NCES district ID
- 4845780
- Math proficiency
- 31% ▼ -10.00%
- Reading proficiency
- 33% ▼ -7.00%
- Median HH income
- $41,604
- Composite
- 27.06/100
- National rank
- #7051
- State rank
- #585 of 826 in TX
Livability — Wichita Falls
- Score
- 69/100
- State rank
- #437
- US rank
- #8940
Category grades
Schools grade is shown separately in the Schools card above.
Census & demographics
- Census place
- Wichita Falls, TX
- County
- Wichita County · 95,694 people
- City population
- 95,694
- Metro
- Wichita Falls, TX
- Population (ZIP)
- 15,479
- Household income
- $41,947
- Rent vs Own
- Severe rent burden
- 577.0
Population outlook (Wichita County) Hauer SSP2
- Today (2025)
- 129,638 people
- By 2030
- 128,366 · -1.0%
- By 2040
- 124,466 · -4.0%
- By 2050
- 120,499 · -7.0%
- By 2075
- 113,884 · -12.2%
- By 2100
- 101,818 · -21.5%
Race, ethnicity, and origin ACS 2023
- Neighborhood character
- Diverse neighborhood (Simpson 0.67)
- Race & ethnicity
- White 40% Hispanic / Latino 38% Black 18% Two or more races 15% Asian 1%
- Hispanic origin (detail)
- Mexican 36%
- Common ancestry
- Slovak 3% Lithuanian 2% Italian 1%
- Foreign-born
- 11% · Canada, Vietnam
- Languages at home
- 76% English-only · Spanish 22%
Political lean MEDSL · Wichita
- 2024 margin
- Solid R (+44.0) · D 27.5% · R 71.5%
- 2008→2024 swing
- -5.2pp toward R · 2008: -38.9pp · 2024: -44.0pp
- All cycles
- 2024: R+44.0 2020: R+41.1 2016: R+49.7 2012: R+47.1 2008: R+38.9
Not yet ingested
- Civics
- —
Market trends
- HPI YoY
- ▼ -69.89%
- Current HPI
- 135.1511
- Rent YoY
- ▲ 5.27%
- Metro
- Wichita Falls, TX
- State GDP YoY
- ▲ 3.95%
- F500 in state
- 110
Industry mix (Fortune 500 HQ in TX)
| Industry | F500 HQs | Revenue |
|---|---|---|
| Energy | 16 | $1,198B |
|
||
| Technology | 5 | $198B |
|
||
| Engineering / Construction | 4 | $72B |
|
||
| Energy Services | 3 | $60B |
|
||
| Utilities | 3 | $41B |
|
||
| Healthcare | 2 | $330B |
|
||
Price history
2 events — show timeline
- 2025-03-17 Listed $31,349 HARMLS
- 2023-08-28 Sold (Public Records) — Public Records
Property tax history
-9.1%/yrLatest (2025): $125 · -78.6% YoY. Source: county tax records.
Cash-flow waterfall
monthlySold comps — $/sqft
last 12 mo · ≤1 miLoading sold comps…