 Duplex
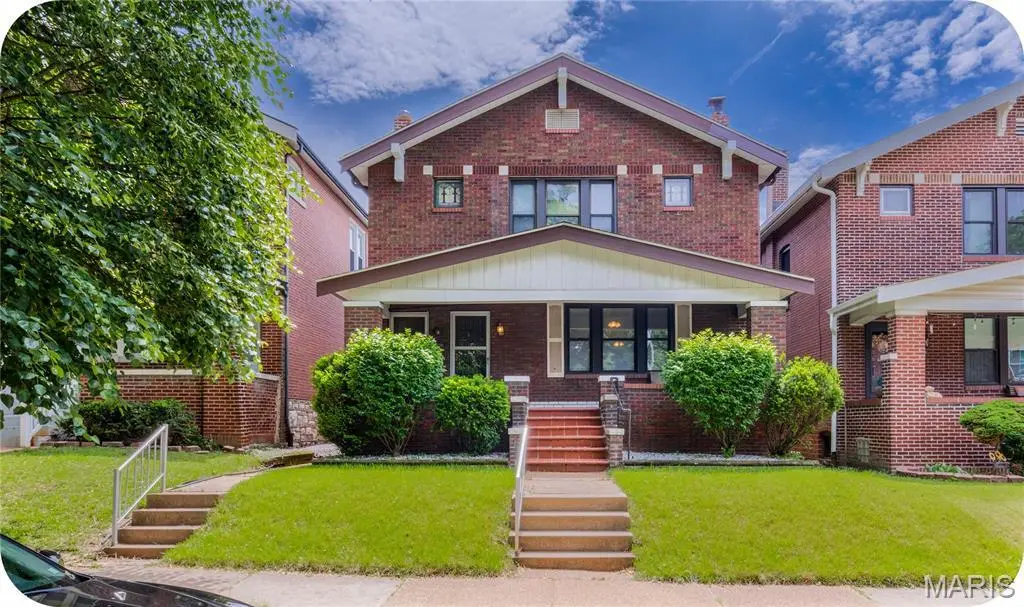
3626 Bowen St · St. Louis, MO
Flood risk 1/10 · Minimal
- FEMA flood zone
- X (unshaded)
- Chance of flooding over 30 yrs
- 0.0%
- Est. flood insurance / yr
- $473 – $860
Fire risk 1/10 · Minimal
- Est. fire insurance / yr
- $1,054 – $1,958
Heat risk 6/10 · Moderate
- Hot days now (above 109°F)
- 7 days/yr
- Hot days in 30 yrs
- 21 days/yr
Wind risk 2/10 · Minimal
- Chance of severe wind over 30 yrs
- 1.0%
Air-quality risk 3/10 · Minor
- Unhealthy air days now
- 3 days/yr
- Unhealthy air days in 30 yrs
- 4 days/yr
Risk factors via First Street. Map © Google.
Why this score? — see what drove the C grade
The composite is a weighted blend of 9 inputs, each scored 0–100. Each bar is that input's sub-score; the figure is the points it added to the 100-point composite (weight × sub-score).
- Cash flow +20.4/30.0
- ARV discount +15.0/15.0
- DSCR +6.5/10.0
- 1% rule +5.2/10.0
- Rent growth +3.2/5.0
- Livability +2.5/5.0
- Condition / age +2.5/5.0
- Schools +1.2/10.0
- Appreciation +0.0/10.0
$240,000
🖨 Deal sheet 📄 Offer letter ✓ Due diligence
Multi-family units
County records classify this as Multi-Family (2-4 Unit). Listing-text estimate: 2 units. confirmed
Listing remarks
Looking for an affordable investment but feel priced out of the market? 3626 Bowen will check all your boxes! Located in picturesque Holly Hills, this large duplex offers just shy of 2700 square feet and is spruced and ready to rent! Pass through the spacious front porch that this area is known for to the first floor unit. There is a very roomy living room with fresh carpet which leads into a large dining room. The dining room can easily be closed to make this a two bedroom unit as well. In the back, notice the spacious bedroom across from the kitchen, bathroom with original tile and a sunroom in the rear which would make a perfect office! The second floor has the same layout except for the
Key facts
- Large dining room
- Sunroom in the rear
- Spacious bedroom
Tags
Property features AI
Finance
- Financial info: Income property (multifamily) with 2 units
Exterior
- Parking: Detached covered garage; 2 garage spaces
- Utilities: Public water; Electric service by Ameren
- Home design: Residential income property (2–4 units)
- Construction: Brick construction
- Exterior features: Brick exterior; Alley access
Interior
- Kitchen: Kitchen appliances include washer and dryer (shared/common area laundry in basement)
- Bedrooms: Two-unit building: one 1-bedroom unit and one 2-bedroom unit
- Bathrooms: Each unit has 1 bathroom
- Heating & cooling: Forced air heating (natural gas); Central air conditioning
- Interior features: Unfinished basement; Basement present; Fireplace; Washer and Dryer included
- Laundry & utility: Laundry located in basement - common area
Neighborhood map
What this means for you Summary
Snapshot
- This is a 2 × 3-bed/2.0-bath units multifamily listed at $240k.
Deal economics
- At list price, monthly cash flow is $312 ($4k/yr) — positive. Per door: $156/mo.
- The deal already cash-flows at list — no discount required.
- Meets the 1% rule at list price ($2k rent vs $240k).
- Cap rate 7.9% vs local median 5.0% in St. Louis — top-decile yield for the area; either an underpriced asset or a hidden risk that comps aren't pricing in. Stress-test before assuming the spread holds.
Location & tenants
- Location reads: area grade C — affects rentability + tenant quality, not the cash-flow math above.
- St. Louis City (urban): math 10% / reading 18% proficiency, ranked #312 of 324 in MO (top 96%) — low school quality limits family demand, transient renter base, plan for 1-2y turnover; 80% free/reduced lunch — lower-income household profile, screen leases tightly.
- Zoned schools: Woerner Elem. (math 8% / reading 17%, grade F, #1,007 of 1,115 statewide, top 91%, 362 students, 99% FRL); Roosevelt High (math 2% / reading 8%, grade F, #517 of 521 statewide, top 100%, 460 students, 99% FRL) — zoned schools average 99% FRL vs 80% district-wide (19 pts higher); higher-poverty schools than district average — tighter screening recommended.
- Market conditions: Rents rising (+2.6%/yr); 255 active listings in the ZIP; 294 units permitted in St. Louis city in 2024 (227 in 5+ unit buildings).
- At $2,455/mo this rent would consume 48% of the median local household income ($61k/yr) (locally 1923% of renters already pay >50% of income on rent) — very limited rent-growth headroom before tenants either downsize or default.
Forward outlook
- Local home prices are declining (-3.0%/yr); year-one equity from $2k of loan paydown is wiped out by about $7k of value loss. Plan a longer hold.
- St. Louis County population projected to shrink 6% by 2050 — rents likely to lag national; underwrite the cash flow, not the appreciation.
Negotiation context
- Only 5 days on market — expect competitive offers; lowballing is unlikely to land.
- Current owner paid $115k; list at $240k implies a 109% gain — meaningful room to come down on a strong offer.
Risks & watch-outs
- Watch-outs: built in 1928 — expect roof / HVAC / electrical / plumbing capex.
- Climate carrying-cost: extreme-heat days projected 7→21/yr by 2055 (HVAC capex compounding) — expect insurance premiums to compound above CPI over the hold.
Questions for the listing agent
- Can we see the unit-by-unit rent roll, current vacancy, and any below-market leases? What's the average tenancy length?
- What capital expenditures (roof, boiler, parking lot, exteriors) have been made in the last 5 years, and what's planned in the next 2?
- Built in 1928 — when were the roof, HVAC, electrical panel, plumbing, and water heater last replaced?
- Is there a deadline driving the sale (1031 exchange, divorce, estate, relocation)? That informs how much negotiation room exists.
- What's the average days-on-market for RENTAL listings here right now (not sales)? A rising rental-DOM trend means longer vacancies and softer asking-rent achievability than the comps imply.
- What's the recent tenant-quality profile in this submarket — average credit score on applications, eviction rate, late-payment / NSF rate, and stable-employment percentage? A property-management company in the area should have these aggregated.
- How much new apartment / multifamily construction is in the pipeline within 1–3 miles? Heavy new supply (>2% of stock underway) typically softens rents 12–24 months out; light construction supports rent growth.
Investment metrics
- 1% rule
- 1.02% ✓
- Cap rate
- 7.85%
- Cash-on-cash
- 5.57%
- DSCR
- 1.25
- GRM
- 8.1
CMA / ARV
- ARV (median comp)
- $289,309
- List price
- $240,000
- Delta
- -17.04%
- Verdict
- UNDERPRICED
- Comps
- 20 within 1.0 mi
Show comp detail 5 sales within ~0.75 mi
| Address | Dist | Beds/Ba | Sqft | Sold | Price | $/sf | Match |
|---|---|---|---|---|---|---|---|
| 3676 Dover Pl | 0.21mi | 6/3.0 | 2,484 (-0%) | 11mo | $245,000 | $99 | 76 |
| 3627 Fillmore | 0.09mi | 6/2.0 | 2,604 (+4%) | 17mo | $232,000 | $89 | 74 |
| 5401 Idaho Ave | 0.60mi | 6/2.0 | 2,496 (+0%) | 4mo | $250,000 | $100 | 69 |
| 6018 Virginia Ave | 0.58mi | 6/3.0 | 2,322 (-7%) | 1mo | $239,999 | $103 | 56 |
| 5504 Tennessee Ave | 0.47mi | 6/2.0 | 2,352 (-6%) | 23mo | $185,000 | $79 | 49 |
Match score weights: distance 35% · size 25% · config 20% · recency 20%. Top-matched comps best support the ARV.
Projected returns pro-forma
-3.0% appreciation · 2.62% rent growth · sell at horizon
- IRR
- -8.1%
- Equity multiple
- 0.70×
- Total profit
- $-19,954
- Equity at exit
- $35,785
- IRR
- 1.0%
- Equity multiple
- 1.07×
- Total profit
- $4,455
- Equity at exit
- $20,751
Cash invested: $67,200 (down + closing). Projections, not guarantees.
Landlord ↔ Tenant lean methodology
- Overall (STATE)
- 81 Strongly Landlord-Friendly
- State Missouri
- 81 Strongly Landlord-Friendly · R+10
- County
- — inherits STATE
- City
- — inherits STATE
ZIP-level market 63116
- Rents YoY
- 2.6%
- Active inventory
- 255
- Price-to-rent
- 16.3×
Monthly cashflow live
- Estimated rent
- $2,455 high interval (Pro) →
- Mortgage (P&I)
- −$1,259
- Tax from tax record
- −$269 /mo · $3,230/yr
- Insurance
- −$100
- HOA
- −$0
- Vacancy / Maint / Mgmt
- −$516
- Net cashflow
- $312
Break-even live
2-unit breakdown (identical units grouped — click to expand)
| Units | Beds | Baths | Est. rent |
|---|---|---|---|
| 2× units | 3 | 2 | $2,456 |
| #1 | 3 | 2 | $1,228 |
| #2 | 3 | 2 | $1,228 |
| Total (2 units) | $2,455 | ||
UW: 25.0% down · 7.5% · 30yr · 1.5% tax · 5.0% vac · 8.0% maint · 8.0% mgmt
Financing live
Cash to close
- Down payment
- $60,000
- Closing costs
- $7,200
- Reserves months
- —
- Total cash needed
- —
Loan-product check · same deal, 3 products live
Conventional
25% down · 7.5% · 30yr
- Down + closing
- —
- Monthly P&I
- —
- Monthly cashflow
- —
- DSCR
- —
- Eligible?
- —
Personal DTI + credit; lowest rate.
DSCR
20% down · 8.5% · 30yr
- Down + closing
- —
- Monthly P&I
- —
- Monthly cashflow
- —
- DSCR
- —
- Eligible?
- —
No personal income docs; deal must DSCR.
Hard money
10% down · 12.0% · 12mo
- Down + closing
- —
- Monthly P&I
- —
- Monthly cashflow
- —
- DSCR
- —
- Eligible?
- —
Short-term bridge; refi at stabilization.
Listing history 3 events
-
2026-05-18status Pending 1637-char remark
-
2026-05-12$240,000 Active 1637-char remark
-
2002-07-03soldstatus $114,900
ⓘ Source: listings_history table (triggers on properties + properties_extension) + one-shot
backfill from property_details.listing_events for pre-trigger history.
Tax reassessment forecast MO · Resets to sale price
- Current annual tax
- $3,230 · $269/mo
- Projected year-2 tax
- $3,230 · $269/mo
- Expected delta
- $0/yr ($0/mo · 0.0%)
ⓘ Screening estimate from a state-policy table — verify with the county assessor before closing.
Climate risk First Street
- Flood 1/10 Low FEMA zone X (unshaded) · 0% chance over 30 yrs
- Wildfire 1/10 Low
- Heat 6/10 Major 7 d/yr ≥109°F today · 21 d/yr by 30 yrs out
- Wind 2/10 Low 100% chance of damaging wind over 30 yrs
- Air quality 3/10 Moderate 3 unhealthy d/yr today · 4 by 30 yrs out
Nearby sold comps map
Loading sold comps map…
Walkable amenities ~0.75 mi
Loading nearby amenities…
Taxation est. · year 1
- Rental income
- $29,460
- − Mortgage interest
- −$13,444
- − Property taxes
- −$3,230
- − Insurance
- −$1,200
- − Repairs & maintenance
- −$2,357
- − Management
- −$2,357
- − Depreciation
- −$6,982
- Taxable loss
- −$109
- Est. tax savings @ 24.0%
- +$26
- After-tax cash flow
- $3,767/yr
For passive investors: Depreciation is non-cash, so a rental often shows a tax loss while cash-flowing — sheltering income. Rental losses are passive: they offset passive income freely, and up to $25,000/yr can offset ordinary (W-2) income if you actively participate and your MAGI is under $100k (phasing out to $0 by $150k); unused losses carry forward. On sale, claimed depreciation is recaptured at up to 25%, and gains may owe capital-gains tax (a 1031 exchange can defer both). Figures are a year-1 estimate at your 24.0% rate — not tax advice; consult a CPA.
Schools (NCES district)
- District
- St. Louis City
- NCES district ID
- 2929280
- Math proficiency
- 10% ▼ -6.00%
- Reading proficiency
- 18% ▼ -3.00%
- Median HH income
- $35,685
- Composite
- 11.54/100
- National rank
- #9699
- State rank
- #312 of 324 in MO
Livability — St. Louis
No livability data for this city. (Only ~50 U.S. cities are tracked.)
Census & demographics
- Census place
- St. Louis, MO
- County
- Saint Louis City · 254,015 people
- City population
- 283,259
- Metro
- St. Louis, MO-IL
- Population (ZIP)
- 42,170
- Household income
- $61,433
- Rent vs Own
- Severe rent burden
- 1923.0
Population outlook (St. Louis County) Hauer SSP2
- Today (2025)
- 315,737 people
- By 2030
- 313,865 · -0.6%
- By 2040
- 305,439 · -3.3%
- By 2050
- 296,529 · -6.1%
- By 2075
- 271,028 · -14.2%
- By 2100
- 255,359 · -19.1%
Race, ethnicity, and origin ACS 2023
- Neighborhood character
- Diverse neighborhood (Simpson 0.63)
- Race & ethnicity
- White 54% Black 27% Hispanic / Latino 10% Two or more races 8% Asian 5%
- Hispanic origin (detail)
- Mexican 7%
- Common ancestry
- Lithuanian 4% Romanian 2% Italian 2%
- Foreign-born
- 11% · Canada, Vietnam, Philippines
- Languages at home
- 85% English-only · Spanish 6% Vietnamese 2% Arabic 2%
Political lean MEDSL · St. Louis
- 2024 margin
- Solid D (+64.7) · D 81.4% · R 16.7% · Other 2.0%
- 2008→2024 swing
- -3.5pp toward R · 2008: 68.2pp · 2024: 64.7pp
- All cycles
- 2024: D+64.7 2020: D+66.2 2016: D+63.7 2012: D+66.6 2008: D+68.2
Not yet ingested
- Civics
- —
Market trends
- HPI YoY
- ▼ -271.19%
- Current HPI
- 215.7108
- Rent YoY
- ▲ 2.62%
- Metro
- St. Louis, MO-IL
- State GDP YoY
- ▲ 1.84%
- F500 in state
- 20
Industry mix (Fortune 500 HQ in MO)
| Industry | F500 HQs | Revenue |
|---|---|---|
| Healthcare | 1 | $163B |
|
||
| Insurance | 1 | $21B |
|
||
| Industrial Technology | 1 | $17B |
|
||
| Retail | 1 | $16B |
|
||
| Industrial Distribution | 1 | $10B |
|
||
| Utilities | 1 | $9B |
|
||
Price history
+108.9% since first listed4 events — show timeline
- 2026-06-04 Sold (MLS) — MARIS as Distributed by MLS Grid
- 2026-05-18 Pending — MARIS as Distributed by MLS Grid
- 2026-05-12 Listed $240,000 MARIS as Distributed by MLS Grid
- 2002-07-03 Sold (Public Records) $114,900 Public Records
Property tax history
+5.9%/yrLatest (2024): $3,230 · +4.8% YoY. Source: county tax records.
Cash-flow waterfall
monthlySold comps — $/sqft
last 12 mo · ≤1 miLoading sold comps…