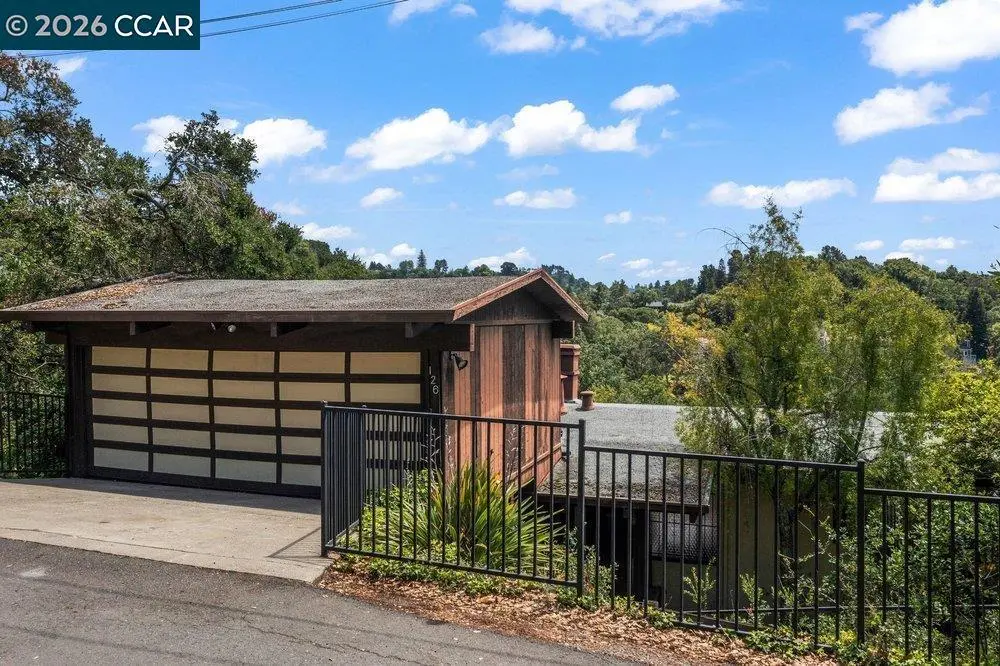
126 La Espiral · Orinda, CA
Flood risk 1/10 · Minimal
- FEMA flood zone
- X (unshaded)
- Chance of flooding over 30 yrs
- 0.0%
- Est. flood insurance / yr
- $473 – $860
Fire risk 4/10 · Minor
- Est. fire insurance / yr
- $659 – $1,223
Heat risk 2/10 · Minimal
- Hot days now (above 90°F)
- 7 days/yr
- Hot days in 30 yrs
- 16 days/yr
Wind risk 1/10 · Minimal
- Chance of severe wind over 30 yrs
- —
Air-quality risk 8/10 · Major
- Unhealthy air days now
- 14 days/yr
- Unhealthy air days in 30 yrs
- 15 days/yr
Risk factors via First Street. Map © Google.
Why this score? — see what drove the B- grade
The composite is a weighted blend of 9 inputs, each scored 0–100. Each bar is that input's sub-score; the figure is the points it added to the 100-point composite (weight × sub-score).
- Cash flow +24.2/30.0
- ARV discount +15.0/15.0
- DSCR +7.8/10.0
- Schools +7.3/10.0
- 1% rule +5.2/10.0
- Livability +3.8/5.0
- Rent growth +2.5/5.0
- Condition / age +2.5/5.0
- Appreciation +0.0/10.0
$995,000
🖨 Deal sheet (PDF) 📄 Offer letter ✓ Due diligence
Listing remarks
This Orinda Country Club Mid Century is ready for a new owner to give it some tender loving care. The lot is approximately . 76 of an acre and the current house fronts on La Espiral with a downhill slope to potential street access on Las Cascadas. Apparently the kids used the slope as a short cut between the two streets. Possible potential for a lot split. The home has lovely views from all the South facing windows with sun streaming through the home in the afternoon. The detached garage has stairs that lead from the pedestrian garage door down to the house. There is a small level garden or play area below the home. Two of the three bedrooms are en suite. The family room backs up to the kit
Key facts
- Play area
- Street access
- Kitchen
Tags
Property features AI
Finance
- Other: Lot approximately 0.76 acres
- HOA & community: HOA present (Roads of Hacienda Home); Annual association fee
Exterior
- Parking: Detached garage (2 garage spaces); 2 covered parking spaces; Garage faces front; Side yard access and additional parking lot
- Utilities: Public water; Public sewer
- Home design: Single family residence; Residential property; Built in 1957; Faces southwest; Mid-century model
- Construction: Stucco and wood siding exterior; Composition roof; Raised foundation
- Exterior features: Back yard with garden and play area; Private entrance; Yard space; Secluded, private and wooded setting; Sloped-down lot
Interior
- Kitchen: Eat-in kitchen with laminate counters; Double oven; Gas range / cooktop; Dishwasher; Built-in grill; Wet bar
- Bedrooms: 2 bedrooms on the street level
- Flooring: Hardwood; Carpet; Linoleum; Vinyl
- Bathrooms: 3 full bathrooms; Primary bath with shower over tub, tub and window; Other baths with shower over tub
- Heating & cooling: Central heating
- Interior features: Family room; Formal dining room; Wet bar; Two fireplaces (family room and living room, metal, wood burning); Main entry at street level; 10 total rooms
- Laundry & utility: Laundry room with hookups, cabinets and sink; Gas water heater
Neighborhood map
What this means for you Summary
Snapshot
- This is a 3-bed/3.0-bath single-family listed at $995k.
Deal economics
- At list price, monthly cash flow is $2k ($24k/yr) — positive.
- The deal already cash-flows at list — no discount required.
- Meets the 1% rule at list price ($10k rent vs $995k).
- Cap rate 8.7% vs local median 2.0% in Orinda — top-decile yield for the area; either an underpriced asset or a hidden risk that comps aren't pricing in. Stress-test before assuming the spread holds.
Location & tenants
- Location reads 76/100 on livability (#107 in CA, #3,728 nationally) — a middle-class / working-renter tenant base. Strengths: crime A+, commute A+, employment A+; Watch: amenities F, cost of living F.
- Acalanes Union High (suburban): math 73% / reading 85% proficiency, ranked #21 of 517 in CA (top 4%) — strong family-tenant draw, lease renewals of 3-5y typical.
- Zoned schools: Sleepy Hollow Elementary (350 students, 3% FRL); Orinda Intermediate (832 students, 3% FRL); Miramonte High (math 79% / reading 84%, grade A, #38 of 1,170 statewide, top 3%, 1,169 students, 5% FRL).
- Market conditions: 95 active listings in the ZIP; 2 comparable units currently listed for rent nearby; 2,169 units permitted in Contra Costa County in 2024 (896 in 5+ unit buildings).
Forward outlook
- Local home prices are declining (-3.0%/yr); year-one equity from $7k of loan paydown is wiped out by about $30k of value loss. Plan a longer hold.
- Contra Costa County population projected at +26% by 2050 — long-run rental-demand tailwind backs the buy-and-hold thesis.
Negotiation context
- Only 11 days on market — expect competitive offers; lowballing is unlikely to land.
Risks & watch-outs
- Watch-outs: built in 1957 — expect roof / HVAC / electrical / plumbing capex.
Questions for the listing agent
- Built in 1957 — when were the roof, HVAC, electrical panel, plumbing, and water heater last replaced?
- What does the HOA fee cover, when was the last increase, and are there any pending special assessments or reserve-fund shortfalls?
- Is there a deadline driving the sale (1031 exchange, divorce, estate, relocation)? That informs how much negotiation room exists.
- Schools are A-rated — typically a magnet for longer-tenancy family renters. What's the average tenant stay here, and is there a school-zone premium baked into asking?
- What's the average days-on-market for RENTAL listings here right now (not sales)? A rising rental-DOM trend means longer vacancies and softer asking-rent achievability than the comps imply.
- What's the recent tenant-quality profile in this submarket — average credit score on applications, eviction rate, late-payment / NSF rate, and stable-employment percentage? A property-management company in the area should have these aggregated.
- How much new for-sale + rental construction is in the pipeline within 1–3 miles? Heavy new supply typically softens prices + rents 12–24 months out; constrained supply supports both.
Investment metrics
- 1% rule
- 1.02% ✓
- Cap rate
- 8.68%
- Cash-on-cash
- 8.52%
- DSCR
- 1.38
- GRM
- 8.2
CMA / ARV
- ARV (on-the-fly)
- $1,579,402
- Comps found
- 12
Show comp detail 12 sales within ~0.75 mi
| Address | Dist | Beds/Ba | Sqft | Sold | Price | $/sf | Match |
|---|---|---|---|---|---|---|---|
| 126 La Espiral | 0.00mi | 3/3.0 | 2,266 (0%) | 0mo | $1,025,000 | $452 | 100 |
| 22 Las Palomas | 0.28mi | 3/3.0 | 2,087 (-8%) | 4mo | $1,550,000 | $743 | 71 |
| 40 Las Palomas | 0.33mi | 4/3.5 (+1) | 2,354 (+4%) | 4mo | $1,435,000 | $610 | 68 |
| 19 Via Floreado | 0.21mi | 3/2.0 | 1,990 (-12%) | 6mo | $925,000 | $465 | 61 |
| 4 El Verano | 0.28mi | 4/3.5 (+1) | 2,456 (+8%) | 9mo | $1,900,000 | $774 | 58 |
| 32 Las Vegas Rd | 0.37mi | 4/2.0 (+1) | 2,058 (-9%) | 0mo | $2,050,000 | $996 | 58 |
| 700 Miner | 0.66mi | 3/2.0 | 2,365 (+4%) | 4mo | $1,649,000 | $697 | 55 |
| 388 Camino Sobrante | 0.53mi | 4/3.0 (+1) | 2,412 (+6%) | 8mo | $1,608,750 | $667 | 53 |
| 404 Ridge Gate Rd | 0.73mi | 3/2.0 | 2,212 (-2%) | 7mo | $1,498,000 | $677 | 53 |
| 316 Village View Ct | 0.67mi | 3/2.0 | 2,080 (-8%) | 5mo | $2,250,000 | $1,082 | 47 |
| 4 Wanda Ln | 0.58mi | 4/2.5 (+1) | 2,461 (+9%) | 6mo | $1,590,000 | $646 | 47 |
| 47 Charles Hill Cir | 0.69mi | 3/2.0 | 2,043 (-10%) | 5mo | $2,300,000 | $1,126 | 43 |
Match score weights: distance 35% · size 25% · config 20% · recency 20%. Top-matched comps best support the ARV.
Projected returns pro-forma
-3.0% appreciation · 3.0% rent growth · sell at horizon
- IRR
- -3.4%
- Equity multiple
- 0.87×
- Total profit
- $-35,606
- Equity at exit
- $148,358
- IRR
- 6.3%
- Equity multiple
- 1.47×
- Total profit
- $129,744
- Equity at exit
- $86,029
Cash invested: $278,600 (down + closing). Projections, not guarantees.
Landlord ↔ Tenant lean methodology
- Overall (STATE)
- 18 Strongly Tenant-Friendly
- State California
- 18 Strongly Tenant-Friendly · D+13
- County
- — inherits STATE
- City
- — inherits STATE
ZIP-level market 94563
- Active inventory
- 95
- Price-to-rent
- 8.2×
Monthly cashflow live
- Estimated rent
- $10,139 medium interval (Pro) →
- Mortgage (P&I)
- −$5,218
- Tax from tax record
- −$302 /mo · $3,624/yr
- Insurance
- −$415
- HOA
- −$97
- Vacancy / Maint / Mgmt
- −$2,129
- Net cashflow
- $1,978
Break-even live
Sensitivity live
| Price | -10% $2,541 | -5% $2,260 | +0% $1,978 | +5% $1,697 | +10% $1,415 |
|---|---|---|---|---|---|
| Rent | -10% $1,177 | -5% $1,578 | +0% $1,978 | +5% $2,379 | +10% $2,779 |
| Rate | -1.0pp $2,479 | -0.5pp $2,231 | base $1,978 | +0.5pp $1,720 | +1.0pp $1,458 |
UW: 25.0% down · 7.5% · 30yr · 1.5% tax · 5.0% vac · 8.0% maint · 8.0% mgmt
Financing live
Cash to close
- Down payment
- $248,750
- Closing costs
- $29,850
- Reserves months
- —
- Total cash needed
- —
Loan-product check · same deal, 3 products live
Conventional
25% down · 7.5% · 30yr
- Down + closing
- —
- Monthly P&I
- —
- Monthly cashflow
- —
- DSCR
- —
- Eligible?
- —
Personal DTI + credit; lowest rate.
DSCR
20% down · 8.5% · 30yr
- Down + closing
- —
- Monthly P&I
- —
- Monthly cashflow
- —
- DSCR
- —
- Eligible?
- —
No personal income docs; deal must DSCR.
Hard money
10% down · 12.0% · 12mo
- Down + closing
- —
- Monthly P&I
- —
- Monthly cashflow
- —
- DSCR
- —
- Eligible?
- —
Short-term bridge; refi at stabilization.
Rent comps 2 comps
| Address | Beds | Baths | Sqft | Rent | $/sqft | DOM | Units | Dist |
|---|---|---|---|---|---|---|---|---|
| 671 Ironbark Cir Orinda, CA | 4.0 | 3.0 | 3312 | $10,870 | $3.28 | 4d | 1 | 0.21mi |
| 87 Tara Rd Orinda, CA | 4.0 | 2.5 | 2437 | $6,800 | $2.79 | 0d | 1 | 1.31mi |
HOA detail
- Monthly dues
- $97 · $1,164/yr
Listing history 2 events
-
2026-05-20status Pending
-
2026-05-09$995,000 Active
ⓘ Source: listings_history table (triggers on properties + properties_extension) + one-shot
backfill from property_details.listing_events for pre-trigger history.
Tax reassessment forecast CA · Resets to sale price
- Current annual tax
- $3,624 · $302/mo
- Projected year-2 tax
- $7,562 · $630/mo
- Expected delta
- +$3,938/yr (+$328/mo · 108.7%)
ⓘ Screening estimate from a state-policy table — verify with the county assessor before closing.
Climate risk First Street
- Flood 1/10 Low FEMA zone X (unshaded) · 0% chance over 30 yrs
- Wildfire 4/10 Moderate
- Heat 2/10 Low 7 d/yr ≥90°F today · 16 d/yr by 30 yrs out
- Wind 1/10 Low
- Air quality 8/10 Severe 14 unhealthy d/yr today · 15 by 30 yrs out
Nearby sold comps map
Loading sold comps map…
Walkable amenities ~0.75 mi
Loading nearby amenities…
Taxation est. · year 1
- Rental income
- $121,666
- − Mortgage interest
- −$55,735
- − Property taxes
- −$3,624
- − Insurance
- −$4,975
- − Repairs & maintenance
- −$9,733
- − Management
- −$9,733
- − HOA
- −$1,164
- − Depreciation
- −$28,945
- Taxable income
- $7,756
- Est. tax owed @ 24.0%
- −$1,861
- After-tax cash flow
- $21,877/yr
For passive investors: Depreciation is non-cash, so a rental often shows a tax loss while cash-flowing — sheltering income. Rental losses are passive: they offset passive income freely, and up to $25,000/yr can offset ordinary (W-2) income if you actively participate and your MAGI is under $100k (phasing out to $0 by $150k); unused losses carry forward. On sale, claimed depreciation is recaptured at up to 25%, and gains may owe capital-gains tax (a 1031 exchange can defer both). Figures are a year-1 estimate at your 24.0% rate — not tax advice; consult a CPA.
Schools (NCES district)
- District
- Acalanes Union High
- NCES district ID
- 0601650
- Math proficiency
- 73% ▲ 1.00%
- Reading proficiency
- 85% ▼ -4.00%
- Median HH income
- $120,138
- Composite
- 73.49/100
- National rank
- #179
- State rank
- #21 of 517 in CA
Livability — Orinda
- Score
- 76/100
- State rank
- #107
- US rank
- #3728
Category grades
Schools grade is shown separately in the Schools card above.
Census & demographics
- Census place
- Orinda, CA
- Population (ZIP)
- 19,409
Population outlook (Contra Costa County) Hauer SSP2
- Today (2025)
- 1,287,720 people
- By 2030
- 1,364,937 · +6.0%
- By 2040
- 1,506,209 · +17.0%
- By 2050
- 1,624,373 · +26.1%
- By 2075
- 1,853,193 · +43.9%
- By 2100
- 1,901,231 · +47.6%
Race, ethnicity, and origin ACS 2023
- Neighborhood character
- Predominantly White (68%)
- Race & ethnicity
- White 68% Asian 16% Two or more races 15% Hispanic / Latino 6%
- Hispanic origin (detail)
- Mexican 3%
- Common ancestry
- Romanian 5% Lithuanian 4% Italian 4%
- Foreign-born
- 20% · China, Canada, Vietnam
- Languages at home
- 80% English-only · Chinese 6% Other Indo-European 4% Spanish 3%
Political lean MEDSL · Contra Costa
- 2024 margin
- Solid D (+38.0) · D 67.3% · R 29.4% · Other 3.3%
- 2008→2024 swing
- +0.2pp no change · 2008: 37.8pp · 2024: 38.0pp
- All cycles
- 2024: D+38.0 2020: D+45.3 2016: D+43.5 2012: D+33.7 2008: D+37.8
Not yet ingested
- Civics
- —
Market trends
- HPI YoY
- ▼ -977.89%
- Current HPI
- 142.3285
- Rent YoY
- —
- Metro
- —
- State GDP YoY
- ▲ 3.21%
- F500 in state
- 116
Industry mix (Fortune 500 HQ in CA)
| Industry | F500 HQs | Revenue |
|---|---|---|
| Technology | 27 | $1,492B |
|
||
| Financial Services | 3 | $174B |
|
||
| Retail | 3 | $44B |
|
||
| Insurance | 3 | $26B |
|
||
| Media / Entertainment | 2 | $115B |
|
||
| Pharmaceuticals / Biotech | 2 | $62B |
|
||
Price history
2 events — show timeline
- 2026-05-20 Pending — bridgeMLS, Bay East AOR, or Contra Costa AOR
- 2026-05-09 Listed $995,000 bridgeMLS, Bay East AOR, or Contra Costa AOR
Property tax history
+3.8%/yrLatest (2025): $3,624 · +1.5% YoY. Source: county tax records.
Cash-flow waterfall
monthlySold comps — $/sqft
last 12 mo · ≤1 miLoading sold comps…