 🏗️ New Construction
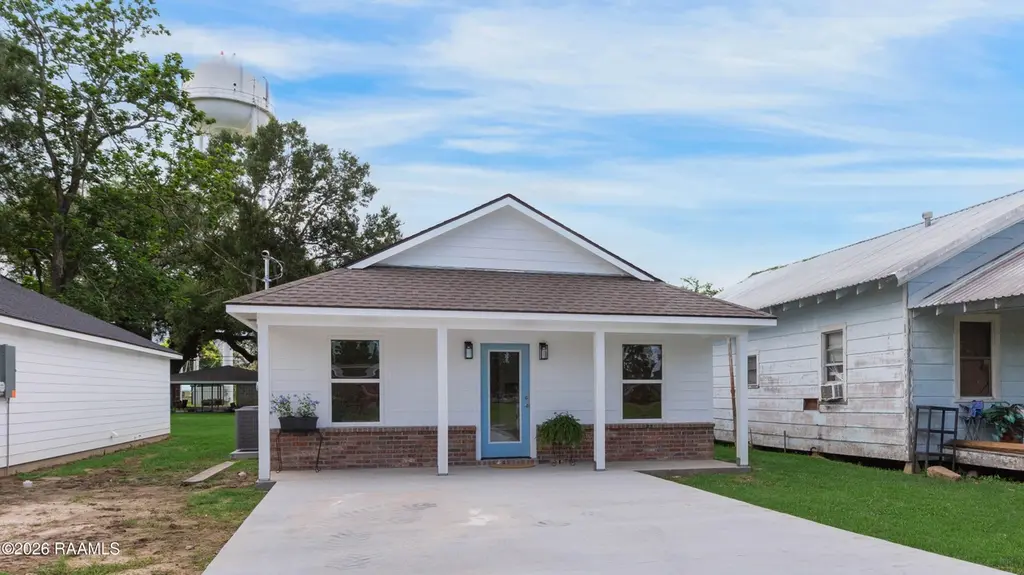
204 2nd St · Duson, LA
Flood risk 1/10 · Minimal
- FEMA flood zone
- X (unshaded)
- Chance of flooding over 30 yrs
- 0.0%
- Est. flood insurance / yr
- $507 – $1,088
Fire risk 1/10 · Minimal
- Est. fire insurance / yr
- $1,269 – $2,357
Heat risk 9/10 · Severe
- Hot days now (above 108°F)
- 7 days/yr
- Hot days in 30 yrs
- 20 days/yr
Wind risk 9/10 · Severe
- Chance of severe wind over 30 yrs
- 99.0%
Air-quality risk 1/10 · Minimal
- Unhealthy air days now
- 0 days/yr
- Unhealthy air days in 30 yrs
- 0 days/yr
Risk factors via First Street. Map © Google.
Why this score? — see what drove the C+ grade
The composite is a weighted blend of 9 inputs, each scored 0–100. Each bar is that input's sub-score; the figure is the points it added to the 100-point composite (weight × sub-score).
- Cash flow +25.8/30.0
- DSCR +8.7/10.0
- ARV discount +7.5/15.0
- 1% rule +6.8/10.0
- Condition / age +4.0/5.0
- Schools +3.6/10.0
- Livability +3.3/5.0
- Rent growth +2.5/5.0
- Appreciation +0.0/10.0
$149,000
🖨 Deal sheet (PDF) 📄 Offer letter ✓ Due diligence
Listing remarks
Brand new construction priced to sell!This newly constructed starter home is located in the heart of Duson just minutes away from Lafayette. This three bed, two full bathroom home is NOT in a flood zone.
Key facts
- 4,791 sq ft lot
- Parking
- Built 2026
Property features AI
Exterior
- Parking: Open parking
- Utilities: Public sewer; Electric service by Entergy
- Home design: Single family residence; New construction; City street frontage
- Construction: HardiPlank and frame construction; Composition roof
- Exterior features: Covered porch; Exterior lighting
Interior
- Kitchen: Refrigerator; Electric stove/oven
- Flooring: Concrete
- Bathrooms: 2 full bathrooms
- Heating & cooling: Central heating (electric); Central air conditioning
- Interior features: Quartz counters; Double pane and storm windows
- Laundry & utility: Washer hookup; Electric dryer hookup
Neighborhood map
What this means for you Summary
Snapshot
- This is a 3-bed/2.0-bath single-family listed at $149k. Condition is rated good.
Deal economics
- At list price, monthly cash flow is $392 ($5k/yr) — positive.
- The deal already cash-flows at list — no discount required.
- Meets the 1% rule at list price ($2k rent vs $149k).
- Cap rate 9.2% vs local median 5.7% in Duson — top-decile yield for the area; either an underpriced asset or a hidden risk that comps aren't pricing in. Stress-test before assuming the spread holds.
Location & tenants
- Location reads 66/100 on livability (#134 in LA) — a middle-class / working-renter tenant base. Strengths: cost of living A+, housing A+, health & safety B+; Watch: amenities F, commute F, employment F.
- Lafayette Parish (urban): math 38% / reading 46% proficiency, ranked #19 of 98 in LA (top 19%) — families likely to look elsewhere, expect single-tenant / working-renter base with shorter leases.
- Zoned schools: Duson Elementary School (math 37% / reading 32%, grade F, #284 of 646 statewide, top 46%, 242 students, 74% FRL); Scott Middle School (math 20% / reading 28%, grade F, #143 of 218 statewide, top 65%, 559 students, 65% FRL); Acadiana High School (math 31% / reading 29%, grade F, #125 of 265 statewide, top 47%, 1,813 students, 56% FRL).
- Zoned-school proficiency averages 30% at this address vs 42% district-wide (-12 pts) — the specific schools serving this property underperform the Lafayette Parish average; the district grade overstates school quality for this exact location.
- Market conditions: 196 active listings in the ZIP; 1 comparable units currently listed for rent nearby; 1,585 units permitted in Lafayette Parish in 2024 (10 in 5+ unit buildings).
Forward outlook
- Local home prices are declining (-3.0%/yr); year-one equity from $1k of loan paydown is wiped out by about $5k of value loss. Plan a longer hold.
- Lafayette County population projected at +34% by 2050 — long-run rental-demand tailwind backs the buy-and-hold thesis.
Negotiation context
- Only 13 days on market — expect competitive offers; lowballing is unlikely to land.
Risks & watch-outs
- Climate carrying-cost: severe wind risk, 99% chance of damaging wind over 30y; extreme-heat days projected 7→20/yr by 2055 (HVAC capex compounding) — expect insurance premiums to compound above CPI over the hold.
Questions for the listing agent
- Is there a deadline driving the sale (1031 exchange, divorce, estate, relocation)? That informs how much negotiation room exists.
- What's the average days-on-market for RENTAL listings here right now (not sales)? A rising rental-DOM trend means longer vacancies and softer asking-rent achievability than the comps imply.
- What's the recent tenant-quality profile in this submarket — average credit score on applications, eviction rate, late-payment / NSF rate, and stable-employment percentage? A property-management company in the area should have these aggregated.
- How much new for-sale + rental construction is in the pipeline within 1–3 miles? Heavy new supply typically softens prices + rents 12–24 months out; constrained supply supports both.
Investment metrics
- 1% rule
- 1.18% ✓
- Cap rate
- 9.22%
- Cash-on-cash
- 10.46%
- DSCR
- 1.47
- GRM
- 7.0
CMA / ARV
- ARV (on-the-fly)
- $160,524
- Comps found
- 9
Show comp detail 9 sales within ~0.75 mi
| Address | Dist | Beds/Ba | Sqft | Sold | Price | $/sf | Match |
|---|---|---|---|---|---|---|---|
| 109 Ember Ridge Ln | 0.29mi | 3/2.0 | 1,104 (+1%) | 6mo | $187,990 | $170 | 79 |
| 105 Ember Ridge Ln | 0.28mi | 3/2.0 | 1,104 (+1%) | 9mo | $189,775 | $172 | 77 |
| 823 2nd St | 0.41mi | 3/1.0 | 1,100 (+1%) | 3mo | $98,600 | $90 | 73 |
| 409 Second St | 0.13mi | 3/1.0 | 1,032 (-6%) | 21mo | $35,000 | $34 | 63 |
| 209 G St | 0.31mi | 3/2.0 | 1,119 (+2%) | 23mo | $55,000 | $49 | 62 |
| 317 Meadow Ridge Ln | 0.20mi | 3/2.0 | 1,192 (+9%) | 23mo | $195,655 | $164 | 56 |
| 305 5th St | 0.20mi | 3/2.0 | 1,253 (+15%) | 13mo | $143,000 | $114 | 55 |
| 108 Ember Ridge Ln | 0.32mi | 3/2.0 | 1,192 (+9%) | 19mo | $195,835 | $164 | 54 |
| 122 B Robin Rd | 0.72mi | 3/2.0 | 1,119 (+2%) | 11mo | $165,000 | $147 | 53 |
Match score weights: distance 35% · size 25% · config 20% · recency 20%. Top-matched comps best support the ARV.
Projected returns pro-forma
-3.0% appreciation · 3.0% rent growth · sell at horizon
- IRR
- -0.6%
- Equity multiple
- 0.98×
- Total profit
- $-1,038
- Equity at exit
- $23,935
- IRR
- 9.1%
- Equity multiple
- 1.70×
- Total profit
- $31,333
- Equity at exit
- $13,879
Cash invested: $44,947 (down + closing). Projections, not guarantees.
Landlord ↔ Tenant lean methodology
- Overall (STATE)
- 90 Strongly Landlord-Friendly
- State Louisiana
- 90 Strongly Landlord-Friendly · R+12
- County
- — inherits STATE
- City
- — inherits STATE
ZIP-level market 70529
- Home prices YoY
- -11.1%
- Active inventory
- 196
- Price-to-rent
- 6.5×
Monthly cashflow live
- Estimated rent
- $1,900 medium interval (Pro) →
- Mortgage (P&I)
- −$842
- Tax est. 1.5%
- −$201 /mo · $2,408/yr
- Insurance
- −$67
- HOA
- −$0
- Vacancy / Maint / Mgmt
- −$399
- Net cashflow
- $392
Break-even live
Sensitivity live
| Price | -10% $503 | -5% $447 | +0% $392 | +5% $336 | +10% $281 |
|---|---|---|---|---|---|
| Rent | -10% $242 | -5% $317 | +0% $392 | +5% $467 | +10% $542 |
| Rate | -1.0pp $472 | -0.5pp $432 | base $392 | +0.5pp $350 | +1.0pp $308 |
UW: 25.0% down · 7.5% · 30yr · 1.5% tax · 5.0% vac · 8.0% maint · 8.0% mgmt
Financing live
Cash to close
- Down payment
- $40,131
- Closing costs
- $4,816
- Reserves months
- —
- Total cash needed
- —
Loan-product check · same deal, 3 products live
Conventional
25% down · 7.5% · 30yr
- Down + closing
- —
- Monthly P&I
- —
- Monthly cashflow
- —
- DSCR
- —
- Eligible?
- —
Personal DTI + credit; lowest rate.
DSCR
20% down · 8.5% · 30yr
- Down + closing
- —
- Monthly P&I
- —
- Monthly cashflow
- —
- DSCR
- —
- Eligible?
- —
No personal income docs; deal must DSCR.
Hard money
10% down · 12.0% · 12mo
- Down + closing
- —
- Monthly P&I
- —
- Monthly cashflow
- —
- DSCR
- —
- Eligible?
- —
Short-term bridge; refi at stabilization.
Rent comps 1 comps
| Address | Beds | Baths | Sqft | Rent | $/sqft | DOM | Units | Dist |
|---|---|---|---|---|---|---|---|---|
| 211 Winter Park PL Duson, LA | 2.0–3.0 | 2.0 | 1275 | $1,900 | $1.49 | 14d | 1 | 0.14mi |
Listing history 12 events
-
2026-06-18days on market $149,000 Active 13 DOM
-
2026-06-18price $149,000 Active 12 DOM
-
2026-06-17days on market $156,000 Active 12 DOM
-
2026-06-16days on market $156,000 Active 11 DOM
-
2026-06-15days on market $156,000 Active 10 DOM
-
2026-06-14days on market $156,000 Active 8 DOM
-
2026-06-13days on market $156,000 Active 7 DOM
-
2026-06-10days on market $156,000 Active 5 DOM
-
2026-06-09days on market $156,000 Active 4 DOM
-
2026-06-08days on market $156,000 Active 3 DOM
-
2026-06-07remarks 203-char remark
-
2026-06-07$156,000 Active 2 DOM
ⓘ Source: listings_history table (triggers on properties + properties_extension) + one-shot
backfill from property_details.listing_events for pre-trigger history.
Climate risk First Street
- Flood 1/10 Low FEMA zone X (unshaded) · 0% chance over 30 yrs
- Wildfire 1/10 Low
- Heat 9/10 Extreme 7 d/yr ≥108°F today · 20 d/yr by 30 yrs out
- Wind 9/10 Extreme 99% chance of damaging wind over 30 yrs
- Air quality 1/10 Low 0 unhealthy d/yr today · 0 by 30 yrs out
Nearby sold comps map
Loading sold comps map…
Walkable amenities ~0.75 mi
Loading nearby amenities…
Taxation est. · year 1
- Rental income
- $22,800
- − Mortgage interest
- −$8,992
- − Property taxes
- −$2,408
- − Insurance
- −$803
- − Repairs & maintenance
- −$1,824
- − Management
- −$1,824
- − Depreciation
- −$4,670
- Taxable income
- $2,280
- Est. tax owed @ 24.0%
- −$547
- After-tax cash flow
- $4,153/yr
For passive investors: Depreciation is non-cash, so a rental often shows a tax loss while cash-flowing — sheltering income. Rental losses are passive: they offset passive income freely, and up to $25,000/yr can offset ordinary (W-2) income if you actively participate and your MAGI is under $100k (phasing out to $0 by $150k); unused losses carry forward. On sale, claimed depreciation is recaptured at up to 25%, and gains may owe capital-gains tax (a 1031 exchange can defer both). Figures are a year-1 estimate at your 24.0% rate — not tax advice; consult a CPA.
Condition & rehab AI · 10 photos
This newly constructed home is in excellent condition with new finishes and systems, making it a great investment opportunity.
Value-add opportunities
- Both Painting the exterior and interior — Enhances curb appeal and interior finish
- Both Landscaping and adding curb appeal features — Improves the home's aesthetic and value
Renovation cost estimate screening
Value-add ROI direction
- Both Painting the exterior and interior — Enhances curb appeal and interior finish ↑
- Both Landscaping and adding curb appeal features — Improves the home's aesthetic and value ↑
ⓘ Cost ranges are severity-bucket heuristics (US national rule-of-thumb). Get contractor quotes + a written scope before underwriting a rehab budget.
Schools (NCES district)
- District
- Lafayette Parish
- NCES district ID
- 2200870
- Math proficiency
- 38% ▼ -32.00%
- Reading proficiency
- 46% ▼ -24.00%
- Median HH income
- $50,238
- Composite
- 36.15/100
- National rank
- #4741
- State rank
- #19 of 98 in LA
Livability — Duson
- Score
- 66/100
- State rank
- #134
- US rank
- #12322
Category grades
Schools grade is shown separately in the Schools card above.
Census & demographics
- Census place
- Duson, LA
- Population (ZIP)
- 13,557
Population outlook (Lafayette County) Hauer SSP2
- Today (2025)
- 280,930 people
- By 2030
- 301,092 · +7.2%
- By 2040
- 339,456 · +20.8%
- By 2050
- 375,156 · +33.5%
- By 2075
- 451,672 · +60.8%
- By 2100
- 497,203 · +77.0%
Race, ethnicity, and origin ACS 2023
- Neighborhood character
- Diverse neighborhood (Simpson 0.55)
- Race & ethnicity
- White 62% Black 25% Hispanic / Latino 6% Two or more races 6%
- Hispanic origin (detail)
- Common ancestry
- Lithuanian 16% English 1% Iranian 1%
- Foreign-born
- 6% · Canada
- Languages at home
- 90% English-only · Spanish 5% French/Haitian/Cajun 4%
Political lean MEDSL · Lafayette
- 2024 margin
- Solid R (+31.4) · D 33.5% · R 64.8% · Other 1.7%
- 2008→2024 swing
- -0.1pp no change · 2008: -31.3pp · 2024: -31.4pp
- All cycles
- 2024: R+31.4 2020: R+28.7 2016: R+33.6 2012: R+33.7 2008: R+31.3
Not yet ingested
- Civics
- —
Market trends
- HPI YoY
- ▼ -23.96%
- Current HPI
- 192.2639
- Rent YoY
- —
- Metro
- —
- State GDP YoY
- ▲ 3.29%
- F500 in state
- 10
Industry mix (Fortune 500 HQ in LA)
| Industry | F500 HQs | Revenue |
|---|---|---|
| Telecommunications | 2 | $23B |
|
||
| Utilities | 1 | $12B |
|
||
| Wholesale / Distribution | 1 | $5B |
|
||
| Advertising | 1 | $2B |
|
||
Price history
1 event — show timeline
- 2026-06-05 Listed $156,000 AcadianaMLS
Cash-flow waterfall
monthlySold comps — $/sqft
last 12 mo · ≤1 miLoading sold comps…