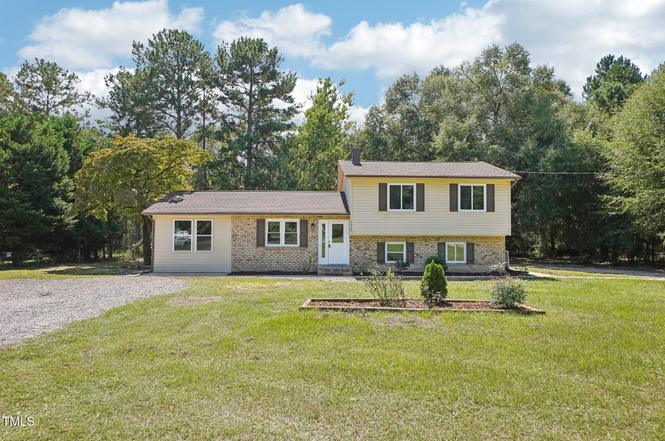
1379 Juniper Lake Rd · Taylortown, NC
Flood risk 1/10 · Minimal
- FEMA flood zone
- X (unshaded)
- Chance of flooding over 30 yrs
- 0.0%
- Est. flood insurance / yr
- $473 – $860
Fire risk 5/10 · Moderate
- Est. fire insurance / yr
- $906 – $1,684
Heat risk 6/10 · Moderate
- Hot days now (above 105°F)
- 7 days/yr
- Hot days in 30 yrs
- 16 days/yr
Wind risk 6/10 · Moderate
- Chance of severe wind over 30 yrs
- 59.0%
Air-quality risk 1/10 · Minimal
- Unhealthy air days now
- 0 days/yr
- Unhealthy air days in 30 yrs
- 0 days/yr
Risk factors via First Street. Map © Google.
Why this score? — see what drove the C+ grade
The composite is a weighted blend of 9 inputs, each scored 0–100. Each bar is that input's sub-score; the figure is the points it added to the 100-point composite (weight × sub-score).
- Cash flow +23.2/30.0
- ARV discount +15.0/15.0
- DSCR +7.4/10.0
- 1% rule +5.1/10.0
- Schools +4.4/10.0
- Livability +3.2/5.0
- Rent growth +2.5/5.0
- Condition / age +2.5/5.0
- Appreciation +0.0/10.0
$279,900
🖨 Deal sheet (PDF) 📄 Offer letter ✓ Due diligence
Listing remarks
Welcome home to a peaceful way of life! This home is situated on an acre of land with no HOA. This charming 3 bedroom 2 bath home is certain to meet your needs for living, entertaining, and relaxation. The kitchen has all new granite, cabinets, and appliances! The home is equipped with new light fixtures, as well. Both bathrooms have new vanities, new fixtures, and are stylishly appointed. Don't miss out, make a showing appointment today!
Key facts
- Built 1982
- Listed 364 days
Neighborhood map
What this means for you Summary
Snapshot
- This is a 3-bed/2.0-bath single-family listed at $280k.
Deal economics
- At list price, monthly cash flow is $506 ($6k/yr) — positive.
- The deal already cash-flows at list — no discount required.
- Meets the 1% rule at list price ($3k rent vs $280k).
- Recommended offer: $246k (12.0% below list) — sets the bar for market timing.
Location & tenants
- Location reads 64/100 on livability (#356 in NC) — a middle-class / working-renter tenant base. Strengths: crime A+, cost of living A+, housing A+; Watch: health & safety C-, employment D, schools F.
- Moore County Schools (rural): math 48% / reading 54% proficiency, ranked #58 of 178 in NC (top 33%) — acceptable for families but not a draw, mixed tenant base, ~2y average lease.
- Market conditions: 180 active listings in the ZIP; 941 units permitted in Moore County in 2024 (0 in 5+ unit buildings).
Forward outlook
- Local home prices are declining (-3.0%/yr); year-one equity from $2k of loan paydown is wiped out by about $8k of value loss. Plan a longer hold.
- Moore County population projected at +29% by 2050 — long-run rental-demand tailwind backs the buy-and-hold thesis.
Negotiation context
- It's been on market 364 days — a 12% lower offer ($246k) is reasonable based on typical stale-listing flexibility.
- 4 sale attempts since 2y ago; this cycle's ask has dropped $120k (30%) from the opening price — seller is motivated, your offer sets the floor, not the list.
Risks & watch-outs
- Climate carrying-cost: major wind risk, 59% chance of damaging wind over 30y; moderate wildfire risk; extreme-heat days projected 7→16/yr by 2055 (HVAC capex compounding) — expect insurance premiums to compound above CPI over the hold.
Questions for the listing agent
- It's been on market 364 days. Have you received any prior offers? Is the seller open to a 12% concession, seller financing, or rate buy-down credit?
- Why hasn't it sold? Are there any deal-killer items the seller is aware of (foundation, flood, title, zoning, code violations)?
- Is there a deadline driving the sale (1031 exchange, divorce, estate, relocation)? That informs how much negotiation room exists.
- Schools are F-rated, which usually means shorter tenancies and higher turnover. Who's the typical renter profile here, and what's been the actual vacancy rate?
- What's the average days-on-market for RENTAL listings here right now (not sales)? A rising rental-DOM trend means longer vacancies and softer asking-rent achievability than the comps imply.
- What's the recent tenant-quality profile in this submarket — average credit score on applications, eviction rate, late-payment / NSF rate, and stable-employment percentage? A property-management company in the area should have these aggregated.
- How much new for-sale + rental construction is in the pipeline within 1–3 miles? Heavy new supply typically softens prices + rents 12–24 months out; constrained supply supports both.
Investment metrics
- 1% rule
- 1.01% ✓
- Cap rate
- 8.46%
- Cash-on-cash
- 7.75%
- DSCR
- 1.34
- GRM
- 8.3
CMA / ARV
- ARV (on-the-fly)
- $456,280
- Comps found
- 2
Show comp detail 2 sales within ~0.75 mi
| Address | Dist | Beds/Ba | Sqft | Sold | Price | $/sf | Match |
|---|---|---|---|---|---|---|---|
| 3749 Murdocksville Rd | 0.72mi | 3/2.0 | 1,773 (-5%) | 2mo | $390,000 | $220 | 56 |
| 144 Birdnest Ct | 0.61mi | 3/2.0 | 1,662 (-11%) | 15mo | $405,000 | $244 | 41 |
Match score weights: distance 35% · size 25% · config 20% · recency 20%. Top-matched comps best support the ARV.
Projected returns pro-forma
-3.0% appreciation · 3.0% rent growth · sell at horizon
- IRR
- -4.5%
- Equity multiple
- 0.83×
- Total profit
- $-13,221
- Equity at exit
- $41,734
- IRR
- 5.1%
- Equity multiple
- 1.38×
- Total profit
- $29,618
- Equity at exit
- $24,201
Cash invested: $78,372 (down + closing). Projections, not guarantees.
Landlord ↔ Tenant lean methodology
- Overall (STATE)
- 85 Strongly Landlord-Friendly
- State North Carolina
- 85 Strongly Landlord-Friendly · R+3
- County
- — inherits STATE
- City
- — inherits STATE
ZIP-level market 27376
- Home prices YoY
- -30.2%
- Active inventory
- 180
- Price-to-rent
- 8.3×
Monthly cashflow live
- Estimated rent
- $2,816 medium interval (Pro) →
- Mortgage (P&I)
- −$1,468
- Tax from tax record
- −$135 /mo · $1,615/yr
- Insurance
- −$117
- HOA
- −$0
- Vacancy / Maint / Mgmt
- −$591
- Net cashflow
- $506
Break-even live
Sensitivity live
| Price | -10% $664 | -5% $585 | +0% $506 | +5% $427 | +10% $348 |
|---|---|---|---|---|---|
| Rent | -10% $283 | -5% $395 | +0% $506 | +5% $617 | +10% $728 |
| Rate | -1.0pp $647 | -0.5pp $577 | base $506 | +0.5pp $433 | +1.0pp $360 |
UW: 25.0% down · 7.5% · 30yr · 1.5% tax · 5.0% vac · 8.0% maint · 8.0% mgmt
Financing live
Cash to close
- Down payment
- $69,975
- Closing costs
- $8,397
- Reserves months
- —
- Total cash needed
- —
Loan-product check · same deal, 3 products live
Conventional
25% down · 7.5% · 30yr
- Down + closing
- —
- Monthly P&I
- —
- Monthly cashflow
- —
- DSCR
- —
- Eligible?
- —
Personal DTI + credit; lowest rate.
DSCR
20% down · 8.5% · 30yr
- Down + closing
- —
- Monthly P&I
- —
- Monthly cashflow
- —
- DSCR
- —
- Eligible?
- —
No personal income docs; deal must DSCR.
Hard money
10% down · 12.0% · 12mo
- Down + closing
- —
- Monthly P&I
- —
- Monthly cashflow
- —
- DSCR
- —
- Eligible?
- —
Short-term bridge; refi at stabilization.
Listing history 30 events
-
2025-12-18soldstatus $280,000
-
2025-11-12status Pending
-
2025-11-03price $279,900
-
2025-09-12price $295,900
-
2025-07-11price $299,900
-
2025-07-01status Active
-
2025-06-30historical
-
2025-06-30historical
-
2025-06-16price $319,900
-
2025-06-16price $319,900
-
2025-04-03price $339,900
-
2025-04-03price $339,900
-
2025-03-21price $349,900
-
2025-03-21price $349,900
-
2025-03-11price $359,900
-
2025-03-11price $359,900
-
2024-12-20price $369,900
-
2024-12-20price $369,900
-
2024-12-20price $369,900
-
2024-11-23price $374,900
-
2024-11-23price $374,900
-
2024-11-23price $374,900
-
2024-11-12price $379,900
-
2024-11-12price $379,900
-
2024-10-16price $389,900
-
2024-10-16price $389,900
-
2024-09-13$399,900 Active
-
2024-09-13$399,900 Active
-
2024-09-13$379,900 Active
-
2021-04-05soldstatus $125,000
ⓘ Source: listings_history table (triggers on properties + properties_extension) + one-shot
backfill from property_details.listing_events for pre-trigger history.
Tax reassessment forecast NC · Resets to sale price
- Current annual tax
- $1,615 · $135/mo
- Projected year-2 tax
- $2,295 · $191/mo
- Expected delta
- +$680/yr (+$57/mo · 42.1%)
ⓘ Screening estimate from a state-policy table — verify with the county assessor before closing.
Climate risk First Street
- Flood 1/10 Low FEMA zone X (unshaded) · 0% chance over 30 yrs
- Wildfire 5/10 Major
- Heat 6/10 Major 7 d/yr ≥105°F today · 16 d/yr by 30 yrs out
- Wind 6/10 Major 59% chance of damaging wind over 30 yrs
- Air quality 1/10 Low 0 unhealthy d/yr today · 0 by 30 yrs out
Nearby sold comps map
Loading sold comps map…
Walkable amenities ~0.75 mi
Loading nearby amenities…
Taxation est. · year 1
- Rental income
- $33,797
- − Mortgage interest
- −$15,679
- − Property taxes
- −$1,615
- − Insurance
- −$1,400
- − Repairs & maintenance
- −$2,704
- − Management
- −$2,704
- − Depreciation
- −$8,143
- Taxable income
- $1,554
- Est. tax owed @ 24.0%
- −$373
- After-tax cash flow
- $5,699/yr
For passive investors: Depreciation is non-cash, so a rental often shows a tax loss while cash-flowing — sheltering income. Rental losses are passive: they offset passive income freely, and up to $25,000/yr can offset ordinary (W-2) income if you actively participate and your MAGI is under $100k (phasing out to $0 by $150k); unused losses carry forward. On sale, claimed depreciation is recaptured at up to 25%, and gains may owe capital-gains tax (a 1031 exchange can defer both). Figures are a year-1 estimate at your 24.0% rate — not tax advice; consult a CPA.
Schools (NCES district)
- District
- Moore County Schools
- NCES district ID
- 3703090
- Math proficiency
- 48% ▲ 5.00%
- Reading proficiency
- 54% ▲ 5.00%
- Median HH income
- $50,333
- Composite
- 43.63/100
- National rank
- #2967
- State rank
- #58 of 178 in NC
Livability — Taylortown
- Score
- 64/100
- State rank
- #356
- US rank
- #14123
Category grades
Schools grade is shown separately in the Schools card above.
Census & demographics
- Census place
- Taylortown, NC
- Population (ZIP)
- 9,693
Population outlook (Moore County) Hauer SSP2
- Today (2025)
- 106,902 people
- By 2030
- 113,134 · +5.8%
- By 2040
- 125,682 · +17.6%
- By 2050
- 137,811 · +28.9%
- By 2075
- 164,387 · +53.8%
- By 2100
- 175,595 · +64.3%
Race, ethnicity, and origin ACS 2023
- Neighborhood character
- Predominantly White (75%)
- Race & ethnicity
- White 75% Black 13% Two or more races 9% Hispanic / Latino 2%
- Common ancestry
- Slovak 5% Lithuanian 4% Serbian 2%
- Foreign-born
- 1% · Canada
- Languages at home
- 97% English-only · Spanish 2% Chinese 1%
Political lean MEDSL · Moore
- 2024 margin
- Strong R (+29.5) · D 34.8% · R 64.3%
- 2008→2024 swing
- -8.1pp toward R · 2008: -21.4pp · 2024: -29.5pp
- All cycles
- 2024: R+29.5 2020: R+27.4 2016: R+29.6 2012: R+28.1 2008: R+21.4
Not yet ingested
- Civics
- —
Market trends
- HPI YoY
- ▼ -76.65%
- Current HPI
- 177.4703
- Rent YoY
- —
- Metro
- —
- State GDP YoY
- ▲ 3.28%
- F500 in state
- 26
Industry mix (Fortune 500 HQ in NC)
| Industry | F500 HQs | Revenue |
|---|---|---|
| Financial Services | 2 | $213B |
|
||
| Retail | 2 | $95B |
|
||
| Industrial Conglomerate | 1 | $38B |
|
||
| Metals / Steel | 1 | $35B |
|
||
| Utilities | 1 | $30B |
|
||
| Industrial Machinery | 1 | $19B |
|
||
Price history
+124.0% since first listed30 events — show timeline
- 2025-12-18 Sold (Public Records) $280,000 Public Records
- 2025-11-12 Pending — TMLS
- 2025-11-03 Price Changed $279,900 TMLS
- 2025-09-12 Price Changed $295,900 TMLS
- 2025-07-11 Price Changed $299,900 TMLS
- 2025-07-01 Relisted — TMLS
- 2025-06-30 Listing Removed — TMLS
- 2025-06-30 Listing Removed — Hive MLS
- 2025-06-16 Price Changed $319,900 Hive MLS
- 2025-06-16 Price Changed $319,900 TMLS
- 2025-04-03 Price Changed $339,900 TMLS
- 2025-04-03 Price Changed $339,900 Hive MLS
- 2025-03-21 Price Changed $349,900 Hive MLS
- 2025-03-21 Price Changed $349,900 TMLS
- 2025-03-11 Price Changed $359,900 Hive MLS
- 2025-03-11 Price Changed $359,900 TMLS
- 2024-12-20 Price Changed $369,900 LPRMLS
- 2024-12-20 Price Changed $369,900 Hive MLS
- 2024-12-20 Price Changed $369,900 TMLS
- 2024-11-23 Price Changed $374,900 LPRMLS
- 2024-11-23 Price Changed $374,900 Hive MLS
- 2024-11-23 Price Changed $374,900 TMLS
- 2024-11-12 Price Changed $379,900 LPRMLS
- 2024-11-12 Price Changed $379,900 Hive MLS
- 2024-10-16 Price Changed $389,900 LPRMLS
- 2024-10-16 Price Changed $389,900 Hive MLS
- 2024-09-13 Listed $399,900 LPRMLS
- 2024-09-13 Listed $379,900 TMLS
- 2024-09-13 Listed $399,900 Hive MLS
- 2021-04-05 Sold (Public Records) $125,000 Public Records
Property tax history
+4.8%/yrLatest (2024): $1,615 · -2.4% YoY. Source: county tax records.
Cash-flow waterfall
monthlySold comps — $/sqft
last 12 mo · ≤1 miLoading sold comps…