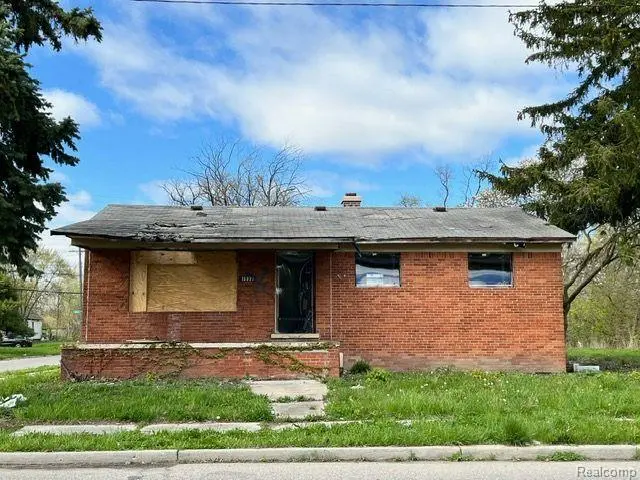
12326 Garnet St · Detroit, MI
Flood risk 1/10 · Minimal
- FEMA flood zone
- X (unshaded)
- Chance of flooding over 30 yrs
- 0.0%
- Est. flood insurance / yr
- $507 – $1,088
Fire risk 1/10 · Minimal
- Est. fire insurance / yr
- $784 – $1,456
Heat risk 3/10 · Minor
- Hot days now (above 96°F)
- 7 days/yr
- Hot days in 30 yrs
- 15 days/yr
Wind risk 2/10 · Minimal
- Chance of severe wind over 30 yrs
- —
Air-quality risk 3/10 · Minor
- Unhealthy air days now
- 2 days/yr
- Unhealthy air days in 30 yrs
- 5 days/yr
Risk factors via First Street. Map © Google.
Why this score? — see what drove the C+ grade
The composite is a weighted blend of 9 inputs, each scored 0–100. Each bar is that input's sub-score; the figure is the points it added to the 100-point composite (weight × sub-score).
- Cash flow +30.0/30.0
- 1% rule +10.0/10.0
- DSCR +10.0/10.0
- Livability +3.7/5.0
- ARV discount +2.8/15.0
- Rent growth +2.8/5.0
- Condition / age +2.5/5.0
- Schools +1.3/10.0
- Appreciation +0.0/10.0
$48,000
🖨 Deal sheet (PDF) 📄 Offer letter ✓ Due diligence
Listing remarks MLS
Great invest opportunity offering a brick ranch with full basement and attached garage that includes 7 lots, 13037, 13047, 13053, 13057, 13059, 13079 & 13089 Houston-Whittier. These lots are to primed for development, so don't sleep on this opportunity. Please note that the Detroit Land Bank Authority is entitled to a tax capture for the 5 tax years subsequent to transferring ownership of the property. The tax capture may be incompatible with tax abatements and lot combinations that are otherwise available to the selected purchaser. DLBA will review requests to waive its tax capture rights and may require a payment in lieu of taxes to approve such requests. The payment will be determined upon reviewing the development proforma and effect of any tax abatements on the purchase and development financing.
Key facts
- 5,227 sq ft lot
- Built 1967
- Listed 786 days
Neighborhood map
What this means for you Summary
Snapshot
- This is a 3-bed/1.0-bath land listed at $48k.
Deal economics
- At list price, monthly cash flow is $707 ($8k/yr) — positive.
- The deal already cash-flows at list — no discount required.
- Meets the 1% rule at list price ($1k rent vs $48k).
- Recommended offer: $42k (12.0% below list) — sets the bar for market timing.
- Cap rate 24.0% vs local median 10.0% in Detroit — top-decile yield for the area; either an underpriced asset or a hidden risk that comps aren't pricing in. Stress-test before assuming the spread holds.
Location & tenants
- Location reads 73/100 on livability (#218 in MI) — a middle-class / working-renter tenant base. Strengths: amenities A+, commute A+, cost of living A+; Watch: crime F, employment F.
- Detroit Public Schools Community District (urban): math 10% / reading 24% proficiency, ranked #499 of 540 in MI (top 92%) — low school quality limits family demand, transient renter base, plan for 1-2y turnover; 90% free/reduced lunch — lower-income household profile, screen leases tightly.
- Zoned schools: Brewer Academy (math 5% / reading 15%, grade F, #1,230 of 1,397 statewide, top 91%, 468 students, 93% FRL); Clippert Academy (379 students, 82% FRL); Denby High School (math 24% / reading 24%, grade F, #481 of 713 statewide, top 81%, 537 students, 88% FRL) — zoned schools at 88% FRL track the district average.
- Market conditions: Rents rising (+1.3%/yr); 376 active listings in the ZIP; 28 comparable units currently listed for rent nearby; rentals at typical pace (median 26d on market — plan ~3-4 weeks tenant-placement turnaround); lower-income renter base — watch delinquency; 2,639 units permitted in Wayne County in 2024 (1,216 in 5+ unit buildings).
- This rent runs 41% of the median local income ($39k/yr) — at the standard rent-burdened threshold; future hikes will face affordability resistance.
Forward outlook
- Local home prices are declining (-3.0%/yr); year-one equity from $332 of loan paydown is wiped out by about $1k of value loss. Plan a longer hold.
- Wayne County population projected at -17% by 2050 — secular population decline; favor cash flow + early exit over multi-decade hold.
- At projected returns (-3.0% appreciation + 1.3% rent growth), your $13k cash investment doubles in ~2 years — after that, you're playing with house money.
Negotiation context
- It's been on market 786 days — a 12% lower offer ($42k) is reasonable based on typical stale-listing flexibility.
- 2 sale attempts since 2y ago with the ask held roughly flat each time — persistent listings suggest the price (not the market) is what's stuck; bring a comps-based counter.
- Current owner paid $9k; list at $48k implies a 440% gain — meaningful room to come down on a strong offer.
Questions for the listing agent
- It's been on market 786 days. Have you received any prior offers? Is the seller open to a 12% concession, seller financing, or rate buy-down credit?
- Built in 1967 — when were the roof, HVAC, electrical panel, plumbing, and water heater last replaced?
- Why hasn't it sold? Are there any deal-killer items the seller is aware of (foundation, flood, title, zoning, code violations)?
- Is there a deadline driving the sale (1031 exchange, divorce, estate, relocation)? That informs how much negotiation room exists.
- Schools are F-rated, which usually means shorter tenancies and higher turnover. Who's the typical renter profile here, and what's been the actual vacancy rate?
- Crime grade is F in this area — have there been break-ins, vandalism, or insurance claims at this property in the last 3 years? What carrier currently insures it and at what premium?
- What's the average days-on-market for RENTAL listings here right now (not sales)? A rising rental-DOM trend means longer vacancies and softer asking-rent achievability than the comps imply.
- What's the recent tenant-quality profile in this submarket — average credit score on applications, eviction rate, late-payment / NSF rate, and stable-employment percentage? A property-management company in the area should have these aggregated.
- How much new for-sale + rental construction is in the pipeline within 1–3 miles? Heavy new supply typically softens prices + rents 12–24 months out; constrained supply supports both.
Investment metrics
- 1% rule
- 2.74% ✓
- Cap rate
- 23.98%
- Cash-on-cash
- 63.15%
- DSCR
- 3.81
- GRM
- 3.0
CMA / ARV
- ARV (median comp)
- $43,446
- List price
- $48,000
- Delta
- 10.48%
- Verdict
- OVERPRICED
- Comps
- 20 within 1.0 mi
Projected returns pro-forma
-3.0% appreciation · 1.33% rent growth · sell at horizon
- IRR
- 60.3%
- Equity multiple
- 3.61×
- Total profit
- $35,117
- Equity at exit
- $7,157
- IRR
- 64.4%
- Equity multiple
- 6.96×
- Total profit
- $80,041
- Equity at exit
- $4,150
Cash invested: $13,440 (down + closing). Projections, not guarantees.
Landlord ↔ Tenant lean methodology
- Overall (STATE)
- 62 Landlord-Friendly
- State Michigan
- 62 Landlord-Friendly · EVEN
- County
- — inherits STATE
- City
- — inherits STATE
ZIP-level market 48205
- Home prices YoY
- -28.1%
- Rents YoY
- 1.3%
- Active inventory
- 376
- Price-to-rent
- 3.0×
Monthly cashflow live
- Estimated rent
- $1,315 high interval (Pro) →
- Mortgage (P&I)
- −$252
- Tax est. 1.5%
- −$60 /mo · $720/yr
- Insurance
- −$20
- HOA
- −$0
- Vacancy / Maint / Mgmt
- −$276
- Net cashflow
- $707
Break-even live
Sensitivity live
| Price | -10% $740 | -5% $724 | +0% $707 | +5% $691 | +10% $674 |
|---|---|---|---|---|---|
| Rent | -10% $603 | -5% $655 | +0% $707 | +5% $759 | +10% $811 |
| Rate | -1.0pp $731 | -0.5pp $720 | base $707 | +0.5pp $695 | +1.0pp $682 |
UW: 25.0% down · 7.5% · 30yr · 1.5% tax · 5.0% vac · 8.0% maint · 8.0% mgmt
Financing live
Cash to close
- Down payment
- $12,000
- Closing costs
- $1,440
- Reserves months
- —
- Total cash needed
- —
Loan-product check · same deal, 3 products live
Conventional
25% down · 7.5% · 30yr
- Down + closing
- —
- Monthly P&I
- —
- Monthly cashflow
- —
- DSCR
- —
- Eligible?
- —
Personal DTI + credit; lowest rate.
DSCR
20% down · 8.5% · 30yr
- Down + closing
- —
- Monthly P&I
- —
- Monthly cashflow
- —
- DSCR
- —
- Eligible?
- —
No personal income docs; deal must DSCR.
Hard money
10% down · 12.0% · 12mo
- Down + closing
- —
- Monthly P&I
- —
- Monthly cashflow
- —
- DSCR
- —
- Eligible?
- —
Short-term bridge; refi at stabilization.
Rent comps 28 comps
| Address | Beds | Baths | Sqft | Rent | $/sqft | DOM | Units | Dist |
|---|---|---|---|---|---|---|---|---|
| 12740 August St Detroit, MI | 2.0 | 1.0 | 900 | $1,300 | $1.44 | 7d | 1 | 0.18mi |
| 12112 Christy St Unit 12110 Detroit, MI | 2.0 | 1.0 | 950 | $1,200 | $1.26 | 45d | 1 | 0.56mi |
| 12110 Christy St Detroit, MI | 2.0 | 1.5 | 950 | $1,200 | $1.26 | 19d | 1 | 0.56mi |
| 18119 Joann St Detroit, MI | 2.0 | 1.0 | 800 | $1,100 | $1.38 | 26d | 1 | 0.63mi |
| 17851 Strasburg St Detroit, MI | 3.0 | 1.0 | 1079 | $1,100 | $1.02 | 19d | 1 | 0.78mi |
| 18624 Fairport St Detroit, MI | 3.0 | 1.0 | 874 | $1,450 | $1.66 | 23d | 1 | 0.79mi |
| 18624 Fairport St Unit NA Detroit, MI | 3.0 | 1.0 | 924 | $1,450 | $1.57 | 26d | 1 | 0.79mi |
| 11700 Engleside St Detroit, MI | 3.0 | 1.0 | 1000 | $1,175 | $1.18 | 45d | 1 | 0.86mi |
| 11765 Glenfield Ave Unit 1510880P Detroit, MI | 2.0 | 1.0 | 990 | $3,102 | $3.13 | 16d | 1 | 0.92mi |
| 18703 Waltham St Detroit, MI | 2.0 | 1.0 | 1000 | $1,100 | $1.10 | 45d | 1 | 0.95mi |
| 15010 Cedargrove St Detroit, MI | 3.0 | 1.5 | 1018 | $1,350 | $1.33 | 45d | 1 | 0.95mi |
| 18681 Barlow St Detroit, MI | 3.0 | 1.0 | 1041 | $1,400 | $1.34 | 26d | 1 | 0.97mi |
| 13400 Longview St Detroit, MI | 3.0 | 1.5 | 1000 | $1,400 | $1.40 | 45d | 1 | 1.02mi |
| 13137 Elmdale St Detroit, MI | 3.0 | 1.0 | 1115 | $1,400 | $1.26 | 26d | 1 | 1.03mi |
| 19170 Joann St Detroit, MI | 4.0 | 1.0 | 1020 | $1,400 | $1.37 | 45d | 1 | 1.05mi |
| 19143 Fairport St Detroit, MI | 3.0 | 1.0 | 1070 | $1,225 | $1.14 | 19d | 1 | 1.05mi |
| 12210 Longview St Detroit, MI | 3.0 | 1.0 | 1020 | $1,100 | $1.08 | 45d | 1 | 1.08mi |
| 19220 Alcoy St Detroit, MI | 3.0 | 1.0 | 1023 | $1,350 | $1.32 | 19d | 1 | 1.09mi |
| 11513 Greiner St Unit 11521 Greiner Detroit, MI | 2.0 | 1.0 | 942 | $1,050 | $1.11 | 45d | 1 | 1.12mi |
| 15238 Seymour St Detroit, MI | 3.0 | 1.0 | 1064 | $1,300 | $1.22 | 0d | 1 | 1.14mi |
| 13669 Pfent St Detroit, MI | 3.0 | 2.0 | 1031 | $1,374 | $1.33 | 19d | 1 | 1.17mi |
| 13067 Wade St Detroit, MI | 2.0 | 1.0 | 660 | $900 | $1.36 | 7d | 1 | 1.21mi |
| 14461 Lappin St Detroit, MI | 3.0 | 1.5 | 989 | $1,150 | $1.16 | 19d | 1 | 1.25mi |
| 15494 Mapleridge St Detroit, MI | 3.0 | 1.0 | 937 | $1,275 | $1.36 | 45d | 1 | 1.35mi |
| 10644 Stratman St Detroit, MI | 2.0 | 1.0 | 1000 | $1,200 | $1.20 | 19d | 1 | 1.41mi |
| 9190 Hayes St Unit 1 Detroit, MI | 2.0 | 1.0 | 750 | $850 | $1.13 | 17d | 1 | 1.44mi |
| 19335 Hoover St Detroit, MI | 2.0 | 1.0 | 620 | $1,099 | $1.77 | 45d | 1 | 1.50mi |
| 19335 Hoover St Detroit, MI | 2.0 | 1.0 | 620 | $1,099 | $1.77 | 19d | 1 | 1.50mi |
Listing history 16 events
-
2026-06-21days on market $48,000 Active 786 DOM
-
2026-06-18days on market $48,000 Active 783 DOM
-
2026-06-17days on market $48,000 Active 782 DOM
-
2026-06-15days on market $48,000 Active 780 DOM
-
2026-06-13days on market $48,000 Active 778 DOM
-
2026-06-13days on market $48,000 Active 777 DOM
-
2026-06-09days on market $48,000 Active 774 DOM
-
2026-06-08days on market $48,000 Active 773 DOM
-
2026-06-07days on market $48,000 Active 772 DOM
-
2026-06-04days on market $48,000 Active 769 DOM
-
2026-06-03days on market $48,000 Active 768 DOM
-
2026-06-01days on market $48,000 Active 766 DOM
-
2026-05-31days on market $48,000 Active 765 DOM
-
2024-04-26$48,000 Active 818-char remark
Show marketing remark (818 chars)
Great invest opportunity offering a brick ranch with full basement and attached garage that includes 7 lots, 13037, 13047, 13053, 13057, 13059, 13079 & 13089 Houston-Whittier. These lots are to primed for development, so don't sleep on this opportunity. Please note that the Detroit Land Bank Authority is entitled to a tax capture for the 5 tax years subsequent to transferring ownership of the property. The tax capture may be incompatible with tax abatements and lot combinations that are otherwise available to the selected purchaser. DLBA will review requests to waive its tax capture rights and may require a payment in lieu of taxes to approve such requests. The payment will be determined upon reviewing the development proforma and effect of any tax abatements on the purchase and development financing.
-
1992-08-07soldstatus $8,882
ⓘ Source: listings_history table (triggers on properties + properties_extension) + one-shot
backfill from property_details.listing_events for pre-trigger history.
Climate risk First Street
- Flood 1/10 Low FEMA zone X (unshaded) · 0% chance over 30 yrs
- Wildfire 1/10 Low
- Heat 3/10 Moderate 7 d/yr ≥96°F today · 15 d/yr by 30 yrs out
- Wind 2/10 Low
- Air quality 3/10 Moderate 2 unhealthy d/yr today · 5 by 30 yrs out
Nearby sold comps map
Loading sold comps map…
Walkable amenities ~0.75 mi
Loading nearby amenities…
Taxation est. · year 1
- Rental income
- $15,783
- − Mortgage interest
- −$2,689
- − Property taxes
- −$720
- − Insurance
- −$240
- − Repairs & maintenance
- −$1,263
- − Management
- −$1,263
- − Depreciation
- −$1,396
- Taxable income
- $8,212
- Est. tax owed @ 24.0%
- −$1,971
- After-tax cash flow
- $6,517/yr
For passive investors: Depreciation is non-cash, so a rental often shows a tax loss while cash-flowing — sheltering income. Rental losses are passive: they offset passive income freely, and up to $25,000/yr can offset ordinary (W-2) income if you actively participate and your MAGI is under $100k (phasing out to $0 by $150k); unused losses carry forward. On sale, claimed depreciation is recaptured at up to 25%, and gains may owe capital-gains tax (a 1031 exchange can defer both). Figures are a year-1 estimate at your 24.0% rate — not tax advice; consult a CPA.
Schools (NCES district)
- District
- Detroit Public Schools Community District
- NCES district ID
- 2601103
- Math proficiency
- 10% ▼ -2.00%
- Reading proficiency
- 24% ▲ 6.00%
- Median HH income
- $25,815
- Composite
- 13.06/100
- National rank
- #9564
- State rank
- #499 of 540 in MI
Livability — Detroit
- Score
- 73/100
- State rank
- #218
- US rank
- #5427
Category grades
Schools grade is shown separately in the Schools card above.
Census & demographics
- Census place
- Detroit, MI
- County
- Wayne County · 1,562,939 people
- City population
- 572,865
- Metro
- Detroit-Warren-Dearborn, MI
- Population (ZIP)
- 34,187
- Household income
- $38,966
- Rent vs Own
- Severe rent burden
- 2121.0
Population outlook (Wayne County) Hauer SSP2
- Today (2025)
- 1,675,273 people
- By 2030
- 1,620,300 · -3.3%
- By 2040
- 1,502,341 · -10.3%
- By 2050
- 1,384,039 · -17.4%
- By 2075
- 1,124,592 · -32.9%
- By 2100
- 881,193 · -47.4%
Race, ethnicity, and origin ACS 2023
- Neighborhood character
- Predominantly Black (93%)
- Race & ethnicity
- Black 93% White 3% Two or more races 2%
- Foreign-born
- 1% · Canada
- Languages at home
- 98% English-only · Spanish 1%
Political lean MEDSL · Wayne
- 2024 margin
- Strong D (+29.0) · D 62.7% · R 33.7% · Other 3.6%
- 2008→2024 swing
- -20.5pp toward R · 2008: 49.5pp · 2024: 29.0pp
- All cycles
- 2024: D+29.0 2020: D+38.1 2016: D+37.3 2012: D+46.9 2008: D+49.5
Not yet ingested
- Civics
- —
Market trends
- HPI YoY
- ▼ -91.80%
- Current HPI
- 235.0926
- Rent YoY
- ▲ 1.33%
- Metro
- Detroit-Warren-Dearborn, MI
- State GDP YoY
- ▲ 1.37%
- F500 in state
- 28
Industry mix (Fortune 500 HQ in MI)
| Industry | F500 HQs | Revenue |
|---|---|---|
| Automotive Parts | 3 | $48B |
|
||
| Automotive | 2 | $372B |
|
||
| Chemicals | 1 | $45B |
|
||
| Automotive Retail | 1 | $29B |
|
||
| Healthcare / Medical Devices | 1 | $23B |
|
||
| Automotive Technology | 1 | $20B |
|
||
Price history
+440.4% since first listed3 events — show timeline
- 2024-04-26 Listed $48,000 MiRealSource-MiMLS
- 2024-04-26 Listed $48,000 REALCOMP
- 1992-08-07 Sold (Public Records) $8,882 Public Records
Cash-flow waterfall
monthlySold comps — $/sqft
last 12 mo · ≤1 miLoading sold comps…