2917 Nc 903 · Stokes, NC
Flood risk 1/10 · Minimal
- FEMA flood zone
- X (unshaded)
- Chance of flooding over 30 yrs
- 0.0%
- Est. flood insurance / yr
- $507 – $1,088
Fire risk 2/10 · Minimal
- Est. fire insurance / yr
- $906 – $1,684
Heat risk 8/10 · Major
- Hot days now (above 108°F)
- 7 days/yr
- Hot days in 30 yrs
- 16 days/yr
Wind risk 8/10 · Major
- Chance of severe wind over 30 yrs
- 80.0%
Air-quality risk 2/10 · Minimal
- Unhealthy air days now
- 2 days/yr
- Unhealthy air days in 30 yrs
- 2 days/yr
Risk factors via First Street. Map © Google.
Why this score? — see what drove the C+ grade
The composite is a weighted blend of 9 inputs, each scored 0–100. Each bar is that input's sub-score; the figure is the points it added to the 100-point composite (weight × sub-score).
- Cash flow +21.1/30.0
- Appreciation +8.1/10.0
- ARV discount +7.5/15.0
- DSCR +6.7/10.0
- 1% rule +5.6/10.0
- Schools +3.6/10.0
- Livability +3.2/5.0
- Rent growth +2.5/5.0
- Condition / age +2.2/5.0
$111,300
🖨 Deal sheet (PDF) 📄 Offer letter ✓ Due diligence
Listing remarks
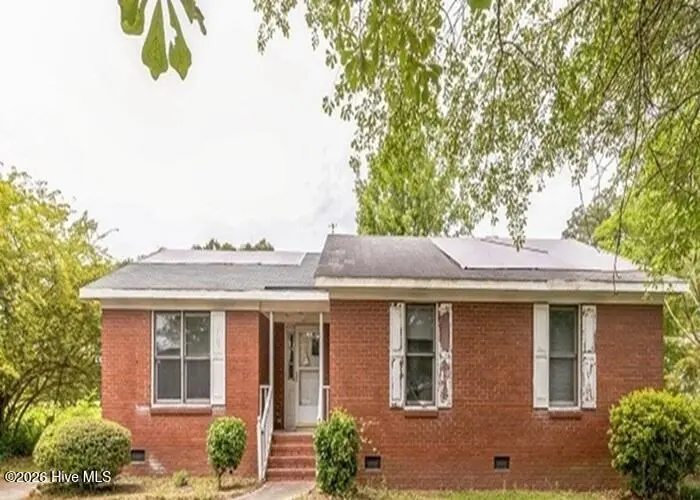
Built in 1988, this brick rancher offers approximately 1305 finished square feet, three bedrooms and two full baths, covered front porch and sits on an approximate 38768 sqft lot. Seller WILL NOT ACTIVATE UTILITIES. Buyer to view home, inspect and confirm all listing information prior to making offer. Seller will NOT allow water service to be turned on for any reason. Property sold ''AS-IS'' without contingencies. Buyer to check with City/County/Zoning/Tax and other records to determine details to their satisfaction. Repairs are needed.
Key facts
- 0.89 acre lot
- Built 1988
- Listed 18 days
Property features AI
Finance
- Other: Property type: Residential; Zoning: RR; Lot size: 0.89 acres
Exterior
- Parking: No parking
- Utilities: Public water; Sewer available; Water available
- Home design: Single-family residence; One story; Entry level: 1
- Construction: Brick construction; Slab foundation; Built on one level
- Exterior features: Shingle roof; No patio or porch listed; No fencing
Interior
- Bathrooms: 2 full bathrooms
- Interior features: 6 total rooms; No basement; Central air conditioning; Forced air heating; Has a view
Neighborhood map
What this means for you Summary
Snapshot
- This is a 3-bed/2.0-bath single-family listed at $111k. Condition is rated fair.
Deal economics
- At list price, monthly cash flow is $159 ($2k/yr) — positive.
- The deal already cash-flows at list — no discount required.
- Meets the 1% rule at list price ($1k rent vs $111k).
- Recommended offer: $110k (1.5% below list) — sets the bar for market timing.
Location & tenants
- Location reads 63/100 on livability (#405 in NC) — a middle-class / working-renter tenant base. Strengths: employment A+, cost of living A+, crime A; Watch: amenities F, commute F, health & safety F.
- Pitt County Schools (rural): math 41% / reading 44% proficiency, ranked #100 of 178 in NC (top 56%) — families likely to look elsewhere, expect single-tenant / working-renter base with shorter leases.
- Zoned schools: Stokes (math 37% / reading 42%, grade F, #694 of 1,410 statewide, top 53%, 238 students, 99% FRL); South Central (math 42% / reading 51%, grade D-, #344 of 535 statewide, top 64%, 1,675 students, 55% FRL) — zoned schools average 77% FRL vs 56% district-wide (21 pts higher); higher-poverty schools than district average — tighter screening recommended.
- Market conditions: 9 active listings in the ZIP; 1,300 units permitted in Pitt County in 2024 (204 in 5+ unit buildings).
Forward outlook
- In year one you build about $8k of equity ($770 loan paydown + $7k appreciation (6.1% local appreciation)).
- Pitt County population projected at +22% by 2050 — long-run rental-demand tailwind backs the buy-and-hold thesis.
- At projected returns (6.1% appreciation + 3.0% rent growth), your $31k cash investment doubles in ~4 years — after that, you're playing with house money.
- By year 5, paydown + projected appreciation supports a ~$33k cash-out refi (75% LTV) — recoverable capital for the next deal without selling this one.
Negotiation context
- It's been on market 18 days — a 2% lower offer ($110k) is reasonable based on typical stale-listing flexibility.
- 5 sale attempts since 11y ago with the ask held roughly flat each time — persistent listings suggest the price (not the market) is what's stuck; bring a comps-based counter.
Risks & watch-outs
- Climate carrying-cost: severe wind risk, 80% chance of damaging wind over 30y; extreme-heat days projected 7→16/yr by 2055 (HVAC capex compounding) — expect insurance premiums to compound above CPI over the hold.
Questions for the listing agent
- Have any recent inspections been done? Can we get a copy of the seller's disclosures and any deferred-maintenance estimates?
- Is there a deadline driving the sale (1031 exchange, divorce, estate, relocation)? That informs how much negotiation room exists.
- Schools are D-rated, which usually means shorter tenancies and higher turnover. Who's the typical renter profile here, and what's been the actual vacancy rate?
- What's the average days-on-market for RENTAL listings here right now (not sales)? A rising rental-DOM trend means longer vacancies and softer asking-rent achievability than the comps imply.
- What's the recent tenant-quality profile in this submarket — average credit score on applications, eviction rate, late-payment / NSF rate, and stable-employment percentage? A property-management company in the area should have these aggregated.
- How much new for-sale + rental construction is in the pipeline within 1–3 miles? Heavy new supply typically softens prices + rents 12–24 months out; constrained supply supports both.
Investment metrics
- 1% rule
- 1.06% ✓
- Cap rate
- 8.00%
- Cash-on-cash
- 6.11%
- DSCR
- 1.27
- GRM
- 7.9
CMA / ARV
No comps found within radius.
Projected returns pro-forma
6.13% appreciation · 3.0% rent growth · sell at horizon
- IRR
- 20.7%
- Equity multiple
- 2.38×
- Total profit
- $43,120
- Equity at exit
- $70,888
- IRR
- 19.8%
- Equity multiple
- 4.81×
- Total profit
- $118,735
- Equity at exit
- $129,354
Cash invested: $31,164 (down + closing). Projections, not guarantees.
Landlord ↔ Tenant lean methodology
- Overall (STATE)
- 85 Strongly Landlord-Friendly
- State North Carolina
- 85 Strongly Landlord-Friendly · R+3
- County
- — inherits STATE
- City
- — inherits STATE
ZIP-level market 27884
- Home prices YoY
- 3.1%
- Active inventory
- 9
- Price-to-rent
- 7.9×
Monthly cashflow live
- Estimated rent
- $1,174 medium interval (Pro) →
- Mortgage (P&I)
- −$584
- Tax est. 1.5%
- −$139 /mo · $1,670/yr
- Insurance
- −$46
- HOA
- −$0
- Vacancy / Maint / Mgmt
- −$247
- Net cashflow
- $159
Break-even live
Sensitivity live
| Price | -10% $236 | -5% $197 | +0% $159 | +5% $120 | +10% $82 |
|---|---|---|---|---|---|
| Rent | -10% $66 | -5% $112 | +0% $159 | +5% $205 | +10% $251 |
| Rate | -1.0pp $215 | -0.5pp $187 | base $159 | +0.5pp $130 | +1.0pp $100 |
UW: 25.0% down · 7.5% · 30yr · 1.5% tax · 5.0% vac · 8.0% maint · 8.0% mgmt
Financing live
Cash to close
- Down payment
- $27,825
- Closing costs
- $3,339
- Reserves months
- —
- Total cash needed
- —
Loan-product check · same deal, 3 products live
Conventional
25% down · 7.5% · 30yr
- Down + closing
- —
- Monthly P&I
- —
- Monthly cashflow
- —
- DSCR
- —
- Eligible?
- —
Personal DTI + credit; lowest rate.
DSCR
20% down · 8.5% · 30yr
- Down + closing
- —
- Monthly P&I
- —
- Monthly cashflow
- —
- DSCR
- —
- Eligible?
- —
No personal income docs; deal must DSCR.
Hard money
10% down · 12.0% · 12mo
- Down + closing
- —
- Monthly P&I
- —
- Monthly cashflow
- —
- DSCR
- —
- Eligible?
- —
Short-term bridge; refi at stabilization.
Listing history 10 events
-
2026-05-19status Pending
-
2026-05-01$111,300 Active
-
2024-11-22status Active
-
2024-05-21status Pending
-
2024-05-21historical
-
2024-05-10$77,000 Active
-
2017-11-30historical
-
2017-11-27$88,000
-
2016-09-20historical
-
2015-11-12$88,000
ⓘ Source: listings_history table (triggers on properties + properties_extension) + one-shot
backfill from property_details.listing_events for pre-trigger history.
Climate risk First Street
- Flood 1/10 Low FEMA zone X (unshaded) · 0% chance over 30 yrs
- Wildfire 2/10 Low
- Heat 8/10 Severe 7 d/yr ≥108°F today · 16 d/yr by 30 yrs out
- Wind 8/10 Severe 80% chance of damaging wind over 30 yrs
- Air quality 2/10 Low 2 unhealthy d/yr today · 2 by 30 yrs out
Nearby sold comps map
Loading sold comps map…
Walkable amenities ~0.75 mi
Loading nearby amenities…
Taxation est. · year 1
- Rental income
- $14,093
- − Mortgage interest
- −$6,235
- − Property taxes
- −$1,670
- − Insurance
- −$556
- − Repairs & maintenance
- −$1,127
- − Management
- −$1,127
- − Depreciation
- −$3,238
- Taxable income
- $140
- Est. tax owed @ 24.0%
- −$34
- After-tax cash flow
- $1,870/yr
For passive investors: Depreciation is non-cash, so a rental often shows a tax loss while cash-flowing — sheltering income. Rental losses are passive: they offset passive income freely, and up to $25,000/yr can offset ordinary (W-2) income if you actively participate and your MAGI is under $100k (phasing out to $0 by $150k); unused losses carry forward. On sale, claimed depreciation is recaptured at up to 25%, and gains may owe capital-gains tax (a 1031 exchange can defer both). Figures are a year-1 estimate at your 24.0% rate — not tax advice; consult a CPA.
Condition & rehab AI · 12 photos
This home requires moderate renovations to update the kitchen and bathrooms, which will significantly increase its value for both resale and rental purposes.
Repairs flagged
- Moderate kitchen cabinets — dated and in need of updating
- Moderate kitchen appliances — outdated and in need of replacement
- Moderate bathroom fixtures — dated and in need of updating
Value-add opportunities
- Both update kitchen cabinets and appliances — modernizing the kitchen will increase both resale and rental value
- Both update bathroom fixtures — modernizing the bathroom will increase both resale and rental value
- Both paint exterior — painting the exterior will improve curb appeal and increase both resale and rental value
Renovation cost estimate screening
| Repair item | Severity | Est. cost |
|---|---|---|
| kitchen cabinets · dated and in need of updating | Moderate | $3,000–15,000 |
| kitchen appliances · outdated and in need of replacement | Moderate | $3,000–15,000 |
| bathroom fixtures · dated and in need of updating | Moderate | $3,000–15,000 |
| Total estimated repair cost · 3 items | $9,000–45,000 |
Value-add ROI direction
- Both update kitchen cabinets and appliances — modernizing the kitchen will increase both resale and rental value ↑
- Both update bathroom fixtures — modernizing the bathroom will increase both resale and rental value ↑
- Both paint exterior — painting the exterior will improve curb appeal and increase both resale and rental value ↑
ⓘ Cost ranges are severity-bucket heuristics (US national rule-of-thumb). Get contractor quotes + a written scope before underwriting a rehab budget.
Schools (NCES district)
- District
- Pitt County Schools
- NCES district ID
- 3700012
- Math proficiency
- 41% ▬ 0.00%
- Reading proficiency
- 44% ▲ 2.00%
- Median HH income
- $40,631
- Composite
- 35.67/100
- National rank
- #4877
- State rank
- #100 of 178 in NC
Livability — Stokes
- Score
- 63/100
- State rank
- #405
- US rank
- #15382
Category grades
Schools grade is shown separately in the Schools card above.
Census & demographics
- Census place
- Stokes, NC
- City population
- 1,608
- Population (ZIP)
- 1,608
Population outlook (Pitt County) Hauer SSP2
- Today (2025)
- 194,585 people
- By 2030
- 203,756 · +4.7%
- By 2040
- 220,807 · +13.5%
- By 2050
- 236,614 · +21.6%
- By 2075
- 275,940 · +41.8%
- By 2100
- 300,058 · +54.2%
Race, ethnicity, and origin ACS 2023
- Neighborhood character
- Diverse neighborhood (Simpson 0.65)
- Race & ethnicity
- White 40% Black 39% Hispanic / Latino 18% Two or more races 14%
- Hispanic origin (detail)
- Mexican 18%
- Common ancestry
- Scottish 2% Serbian 1%
- Foreign-born
- 6% · Canada
- Languages at home
- 84% English-only · Spanish 16%
Political lean MEDSL · Pitt
- 2024 margin
- Lean D (+6.0) · D 52.5% · R 46.5% · Other 1.1%
- 2008→2024 swing
- -2.8pp toward R · 2008: 8.8pp · 2024: 6.0pp
- All cycles
- 2024: D+6.0 2020: D+9.4 2016: D+7.4 2012: D+6.7 2008: D+8.8
Not yet ingested
- Civics
- —
Market trends
- HPI YoY
- ▲ 6.13%
- Current HPI
- 205.9961
- Rent YoY
- —
- Metro
- —
- State GDP YoY
- ▲ 3.28%
- F500 in state
- 26
Industry mix (Fortune 500 HQ in NC)
| Industry | F500 HQs | Revenue |
|---|---|---|
| Financial Services | 2 | $213B |
|
||
| Retail | 2 | $95B |
|
||
| Industrial Conglomerate | 1 | $38B |
|
||
| Metals / Steel | 1 | $35B |
|
||
| Utilities | 1 | $30B |
|
||
| Industrial Machinery | 1 | $19B |
|
||
Price history
+26.5% since first listed10 events — show timeline
- 2026-05-19 Pending — Hive MLS
- 2026-05-01 Listed $111,300 Hive MLS
- 2024-11-22 Relisted — Hive MLS
- 2024-05-21 Pending — Hive MLS
- 2024-05-21 Listing Removed — Hive MLS
- 2024-05-10 Listed $77,000 Hive MLS
- 2017-11-30 Listing Removed — Hive MLS
- 2017-11-27 Listed $88,000 Hive MLS
- 2016-09-20 Listing Removed — Hive MLS
- 2015-11-12 Listed $88,000 Hive MLS
Cash-flow waterfall
monthlySold comps — $/sqft
last 12 mo · ≤1 miLoading sold comps…