521 Rachael St · Augusta-Richmond County consolidated government (balance), GA
Flood risk 4/10 · Minor
- FEMA flood zone
- X
- Chance of flooding over 30 yrs
- 0.22%
- Est. flood insurance / yr
- $507 – $1,088
Fire risk 1/10 · Minimal
- Est. fire insurance / yr
- $963 – $1,789
Heat risk 8/10 · Major
- Hot days now (above 108°F)
- 7 days/yr
- Hot days in 30 yrs
- 18 days/yr
Wind risk 6/10 · Moderate
- Chance of severe wind over 30 yrs
- 67.0%
Air-quality risk 3/10 · Minor
- Unhealthy air days now
- 3 days/yr
- Unhealthy air days in 30 yrs
- 4 days/yr
Risk factors via First Street. Map © Google.
Why this score? — see what drove the B+ grade
The composite is a weighted blend of 9 inputs, each scored 0–100. Each bar is that input's sub-score; the figure is the points it added to the 100-point composite (weight × sub-score).
- Cash flow +27.4/30.0
- ARV discount +15.0/15.0
- DSCR +9.6/10.0
- Appreciation +9.1/10.0
- 1% rule +7.0/10.0
- Livability +2.5/5.0
- Condition / age +2.5/5.0
- Rent growth +2.2/5.0
- Schools +1.3/10.0
$82,500
🖨 Deal sheet 📄 Offer letter ✓ Due diligence
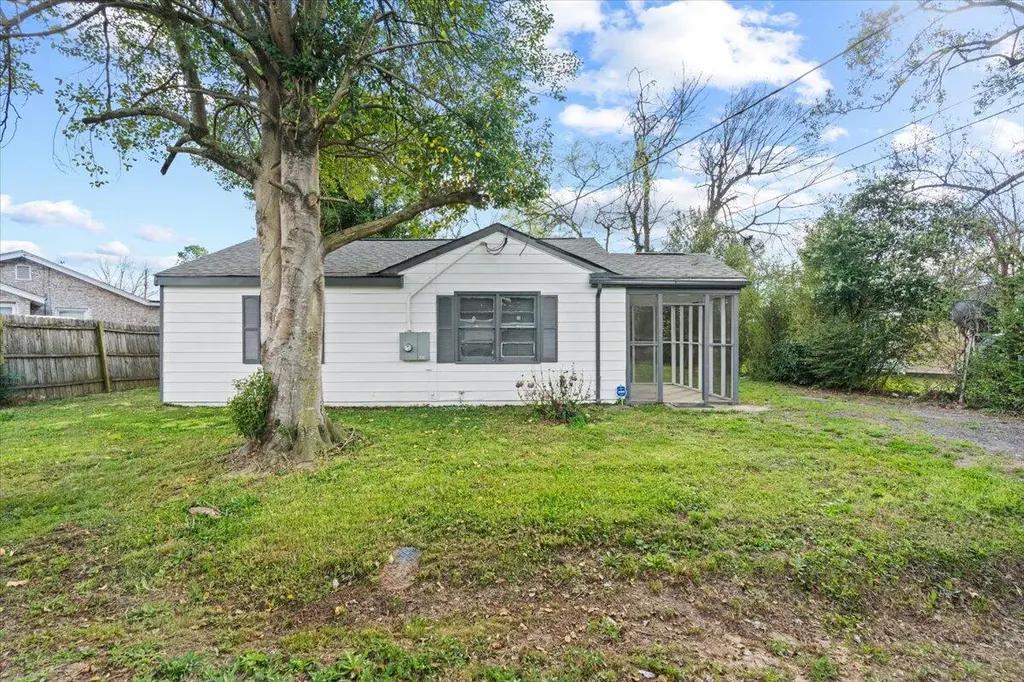
Listing remarks
* * Instant Equity Opportunity -- Appraised Above List Price! * * Fully renovated and move-in ready, this charming 2 bedroom, 1 bath cottage offers buyers the rare chance to own a home with * * immediate built-in value based on recent appraised value. * * Featuring a brand-new HVAC system and a spacious screened-in porch perfect for relaxing, this home blends comfort and value. Inside, you'll find a bright living area, an updated kitchen with ample cabinet space, and comfortable bedrooms filled with natural light. The bathroom is tastefully finished with a clean, modern feel. Situated on a private lot with mature trees and a backyard, this home provides peaceful living while being ju
Key facts
- 6,098 sq ft lot
- Garage
- Built 1953
Property features AI
Exterior
- Parking: Gravel parking; See remarks for additional parking details
- Utilities: Public water; Public sewer
- Home design: Single-family residence; One story; Residential property
- Construction: Vinyl siding; Composition roof; Slab foundation; Built as single-family construction
- Exterior features: Covered porch; Screened porch; Fenced yard; No additional exterior features listed
Interior
- Kitchen: Refrigerator; Range
- Bedrooms: 4 total rooms
- Flooring: Laminate; Ceramic tile
- Bathrooms: 1 full bathroom
- Heating & cooling: Baseboard heating; Electric heating; Hot water heating; Natural gas heating; Central air conditioning; Wall/window unit(s)
- Interior features: Eat-in kitchen; Window coverings
- Laundry & utility: Gas water heater
Neighborhood map
What this means for you Summary
Snapshot
- This is a 2-bed/1.0-bath single-family listed at $82k.
Deal economics
- At list price, monthly cash flow is $242 ($3k/yr) — positive.
- The deal already cash-flows at list — no discount required.
- Meets the 1% rule at list price ($990 rent vs $82k).
- Recommended offer: $81k (1.5% below list) — sets the bar for market timing.
Location & tenants
- Location reads: area grade B — affects rentability + tenant quality, not the cash-flow math above.
- Richmond County (urban): math 12% / reading 20% proficiency, ranked #154 of 174 in GA (top 88%) — low school quality limits family demand, transient renter base, plan for 1-2y turnover; 72% free/reduced lunch — lower-income household profile, screen leases tightly.
- Zoned schools: W.S. Hornsby Elementary School (math 2% / reading 2%, grade F, #1,204 of 1,228 statewide, top 100%, 567 students, 98% FRL); W.S. Hornsby Middle School (math 2% / reading 5%, grade F, #468 of 470 statewide, top 100%, 399 students, 98% FRL) — zoned schools average 98% FRL vs 72% district-wide (26 pts higher); higher-poverty schools than district average — tighter screening recommended.
- Zoned-school proficiency averages 3% at this address vs 16% district-wide (-13 pts) — the specific schools serving this property underperform the Richmond County average; the district grade overstates school quality for this exact location.
- Market conditions: Rents soft (-1.3%/yr); 129 active listings in the ZIP; 6 comparable units currently listed for rent nearby; rentals lingering (median 44d on market — plan ~5-8 weeks vacancy on turnover, expect pricing pressure); 67% of comp listings sitting > 30 days — soft ceiling on asking rent; lower-income renter base — watch delinquency; 561 units permitted in Richmond County in 2024 (0 in 5+ unit buildings).
Forward outlook
- In year one you build about $7k of equity ($570 loan paydown + $7k appreciation (8.2% local appreciation)).
- Richmond County population projected to shrink 5% by 2050 — rents likely to lag national; underwrite the cash flow, not the appreciation.
- At projected returns (8.2% appreciation + 0.0% rent growth), your $23k cash investment doubles in ~3 years — after that, you're playing with house money.
- By year 5, paydown + projected appreciation supports a ~$33k cash-out refi (75% LTV) — recoverable capital for the next deal without selling this one.
Negotiation context
- It's been on market 29 days — a 2% lower offer ($81k) is reasonable based on typical stale-listing flexibility.
- 8 sale attempts since 5y ago; this cycle's ask has dropped $7k (8%) from the opening price — seller is motivated, your offer sets the floor, not the list.
- Current owner paid $27k; list at $82k implies a 206% gain — meaningful room to come down on a strong offer.
Risks & watch-outs
- Watch-outs: built in 1953 — expect roof / HVAC / electrical / plumbing capex.
Questions for the listing agent
- Built in 1953 — when were the roof, HVAC, electrical panel, plumbing, and water heater last replaced?
- Is there a deadline driving the sale (1031 exchange, divorce, estate, relocation)? That informs how much negotiation room exists.
- What's the average days-on-market for RENTAL listings here right now (not sales)? A rising rental-DOM trend means longer vacancies and softer asking-rent achievability than the comps imply.
- What's the recent tenant-quality profile in this submarket — average credit score on applications, eviction rate, late-payment / NSF rate, and stable-employment percentage? A property-management company in the area should have these aggregated.
- How much new for-sale + rental construction is in the pipeline within 1–3 miles? Heavy new supply typically softens prices + rents 12–24 months out; constrained supply supports both.
Investment metrics
- 1% rule
- 1.20% ✓
- Cap rate
- 9.81%
- Cash-on-cash
- 12.56%
- DSCR
- 1.56
- GRM
- 6.9
CMA / ARV
- ARV (on-the-fly)
- $145,080
- Comps found
- 2
Show comp detail 2 sales within ~0.75 mi
| Address | Dist | Beds/Ba | Sqft | Sold | Price | $/sf | Match |
|---|---|---|---|---|---|---|---|
| 213 Japonica Ave | 0.45mi | 2/1.0 | 665 (-11%) | 13mo | $130,000 | $195 | 50 |
| 2 Hale St | 0.65mi | 2/1.0 | 794 (+7%) | 21mo | $110,000 | $139 | 41 |
Match score weights: distance 35% · size 25% · config 20% · recency 20%. Top-matched comps best support the ARV.
Projected returns pro-forma
8.18% appreciation · 0.0% rent growth · sell at horizon
- IRR
- 28.7%
- Equity multiple
- 3.05×
- Total profit
- $47,436
- Equity at exit
- $63,692
- IRR
- 24.6%
- Equity multiple
- 6.23×
- Total profit
- $120,902
- Equity at exit
- $127,408
Cash invested: $23,100 (down + closing). Projections, not guarantees.
Landlord ↔ Tenant lean methodology
- Overall (STATE)
- 90 Strongly Landlord-Friendly
- State Georgia
- 90 Strongly Landlord-Friendly · R+3
- County
- — inherits STATE
- City
- — inherits STATE
ZIP-level market 30901
- Home prices YoY
- 4.1%
- Rents YoY
- -1.3%
- Active inventory
- 129
- Price-to-rent
- 6.9×
Monthly cashflow live
- Estimated rent
- $990 high interval (Pro) →
- Mortgage (P&I)
- −$433
- Tax from tax record
- −$74 /mo · $883/yr
- Insurance
- −$34
- HOA
- −$0
- Vacancy / Maint / Mgmt
- −$208
- Net cashflow
- $242
Break-even live
UW: 25.0% down · 7.5% · 30yr · 1.5% tax · 5.0% vac · 8.0% maint · 8.0% mgmt
Financing live
Cash to close
- Down payment
- $20,625
- Closing costs
- $2,475
- Reserves months
- —
- Total cash needed
- —
Loan-product check · same deal, 3 products live
Conventional
25% down · 7.5% · 30yr
- Down + closing
- —
- Monthly P&I
- —
- Monthly cashflow
- —
- DSCR
- —
- Eligible?
- —
Personal DTI + credit; lowest rate.
DSCR
20% down · 8.5% · 30yr
- Down + closing
- —
- Monthly P&I
- —
- Monthly cashflow
- —
- DSCR
- —
- Eligible?
- —
No personal income docs; deal must DSCR.
Hard money
10% down · 12.0% · 12mo
- Down + closing
- —
- Monthly P&I
- —
- Monthly cashflow
- —
- DSCR
- —
- Eligible?
- —
Short-term bridge; refi at stabilization.
Rent comps 6 comps
| Address | Beds | Baths | Sqft | Rent | $/sqft | DOM | Units | Dist |
|---|---|---|---|---|---|---|---|---|
| 239 Greene St Augusta, GA | 1.0 | 1.0 | 700 | $825 | $1.18 | 43d | 1 | 1.03mi |
| 239 Greene St Unit A-3 Augusta, GA | 1.0 | 1.0 | 700 | $800 | $1.14 | 23d | 1 | 1.03mi |
| 240 Ellis St Unit A Augusta, GA | 1.0 | 1.0 | 600 | $885 | $1.48 | 23d | 1 | 1.08mi |
| 334 Greene St Unit 8 Augusta, GA | 1.0 | 1.0 | 400 | $795 | $1.99 | 43d | 1 | 1.16mi |
| 401 Greene St Unit 204 Augusta, GA | 1.0 | 1.0 | 633 | $1,250 | $1.97 | 43d | 1 | 1.23mi |
| 537 Watkins St Unit B Augusta, GA | 1.0 | 1.0 | 725 | $705 | $0.97 | 43d | 1 | 1.41mi |
Listing history 31 events
-
2026-06-18days on market $82,500 Active 29 DOM
-
2026-06-17days on market $82,500 Active 28 DOM
-
2026-06-16days on market $82,500 Active 27 DOM
-
2026-06-15days on market $82,500 Active 26 DOM
-
2026-06-14pricedays on market $82,500 Active 24 DOM
-
2026-06-10days on market $84,999 Active 21 DOM
-
2026-06-09days on market $84,999 Active 20 DOM
-
2026-06-08days on market $84,999 Active 19 DOM
-
2026-06-07days on market $84,999 Active 18 DOM
-
2026-06-03days on market $84,999 Active 14 DOM
-
2026-06-02days on market $84,999 Active 13 DOM
-
2026-06-01days on market $84,999 Active 12 DOM
-
2026-05-31days on market $84,999 Active 11 DOM
-
2026-05-30days on market $84,999 Active 10 DOM
-
2026-05-20status Active
-
2026-05-11historical
-
2026-04-28status Active
-
2026-04-06historical
-
2026-04-06historical
-
2026-04-06status Pending
-
2026-03-29price $84,999
-
2026-03-12$84,999
-
2026-03-12$89,999 Active
-
2025-12-16historical
-
2025-07-18$85,000
-
2025-07-18$85,000 Active
-
2021-09-09soldstatus $27,000
-
2021-09-09soldstatus $27,000
-
2021-08-24$33,000
-
2021-08-24$33,000
-
1988-06-01soldstatus $20,000
ⓘ Source: listings_history table (triggers on properties + properties_extension) + one-shot
backfill from property_details.listing_events for pre-trigger history.
Tax reassessment forecast GA · Resets to sale price
- Current annual tax
- $883 · $74/mo
- Projected year-2 tax
- $883 · $74/mo
- Expected delta
- $0/yr ($0/mo · -0.0%)
ⓘ Screening estimate from a state-policy table — verify with the county assessor before closing.
Climate risk First Street
- Flood 4/10 Moderate FEMA zone X · 22% chance over 30 yrs
- Wildfire 1/10 Low
- Heat 8/10 Severe 7 d/yr ≥108°F today · 18 d/yr by 30 yrs out
- Wind 6/10 Major 67% chance of damaging wind over 30 yrs
- Air quality 3/10 Moderate 3 unhealthy d/yr today · 4 by 30 yrs out
Nearby sold comps map
Loading sold comps map…
Walkable amenities ~0.75 mi
Loading nearby amenities…
Taxation est. · year 1
- Rental income
- $11,885
- − Mortgage interest
- −$4,621
- − Property taxes
- −$883
- − Insurance
- −$412
- − Repairs & maintenance
- −$951
- − Management
- −$951
- − Depreciation
- −$2,400
- Taxable income
- $1,667
- Est. tax owed @ 24.0%
- −$400
- After-tax cash flow
- $2,502/yr
For passive investors: Depreciation is non-cash, so a rental often shows a tax loss while cash-flowing — sheltering income. Rental losses are passive: they offset passive income freely, and up to $25,000/yr can offset ordinary (W-2) income if you actively participate and your MAGI is under $100k (phasing out to $0 by $150k); unused losses carry forward. On sale, claimed depreciation is recaptured at up to 25%, and gains may owe capital-gains tax (a 1031 exchange can defer both). Figures are a year-1 estimate at your 24.0% rate — not tax advice; consult a CPA.
Schools (NCES district)
- District
- Richmond County
- NCES district ID
- 1304380
- Math proficiency
- 12% ▼ -9.00%
- Reading proficiency
- 20% ▼ -6.00%
- Median HH income
- $38,069
- Composite
- 13.43/100
- National rank
- #9524
- State rank
- #154 of 174 in GA
Livability — Augusta-Richmond County consolidated government (balance)
No livability data for this city. (Only ~50 U.S. cities are tracked.)
Census & demographics
- Census place
- Augusta-Richmond County consolidated government (balance), GA
- County
- Richmond County · 190,917 people
- City population
- 154,035
- Metro
- Augusta-Richmond County, GA-SC
- Population (ZIP)
- 16,484
- Household income
- $25,163
- Rent vs Own
- Severe rent burden
- 2063.0
Population outlook (Richmond County) Hauer SSP2
- Today (2025)
- 200,753 people
- By 2030
- 200,232 · -0.3%
- By 2040
- 196,813 · -2.0%
- By 2050
- 190,347 · -5.2%
- By 2075
- 172,496 · -14.1%
- By 2100
- 146,284 · -27.1%
Race, ethnicity, and origin ACS 2023
- Neighborhood character
- Predominantly Black (78%)
- Race & ethnicity
- Black 78% White 15% Two or more races 4% Hispanic / Latino 2%
- Common ancestry
- Lithuanian 1% Slovak 1%
- Foreign-born
- 1% · Canada
- Languages at home
- 97% English-only · Spanish 1%
Political lean MEDSL · Richmond
- 2024 margin
- Solid D (+36.1) · D 67.8% · R 31.7%
- 2008→2024 swing
- +4.3pp toward D · 2008: 31.8pp · 2024: 36.1pp
- All cycles
- 2024: D+36.1 2020: D+37.2 2016: D+32.4 2012: D+33.8 2008: D+31.8
Not yet ingested
- Civics
- —
Market trends
- HPI YoY
- ▲ 8.18%
- Current HPI
- 206.3145
- Rent YoY
- ▼ -1.31%
- Metro
- Augusta-Richmond County, GA-SC
- State GDP YoY
- ▲ 2.66%
- F500 in state
- 28
Industry mix (Fortune 500 HQ in GA)
| Industry | F500 HQs | Revenue |
|---|---|---|
| Paper / Packaging | 2 | $29B |
|
||
| Retail | 1 | $160B |
|
||
| Transportation / Logistics | 1 | $91B |
|
||
| Airlines | 1 | $62B |
|
||
| Consumer Goods | 1 | $47B |
|
||
| Utilities | 1 | $25B |
|
||
Price history
+325.0% since first listed17 events — show timeline
- 2026-05-20 Relisted — Hive MLS
- 2026-05-11 Listing Removed — Hive MLS
- 2026-04-28 Relisted — Hive MLS
- 2026-04-06 Listing Removed — Hive MLS
- 2026-04-06 Listing Removed — Hive MLS
- 2026-04-06 Pending — Hive MLS
- 2026-03-29 Price Changed $84,999 Hive MLS
- 2026-03-12 Listed $89,999 Hive MLS
- 2026-03-12 Listed $84,999 Hive MLS
- 2025-12-16 Listing Removed — Hive MLS
- 2025-07-18 Listed $85,000 Hive MLS
- 2025-07-18 Listed $85,000 Hive MLS
- 2021-09-09 Sold (MLS) $27,000 Hive MLS
- 2021-09-09 Sold (MLS) $27,000 Hive MLS
- 2021-08-24 Listed $33,000 Hive MLS
- 2021-08-24 Listed $33,000 Hive MLS
- 1988-06-01 Sold (Public Records) $20,000 Public Records
Property tax history
+3.2%/yrLatest (2025): $883 · +12.3% YoY. Source: county tax records.
Cash-flow waterfall
monthlySold comps — $/sqft
last 12 mo · ≤1 miLoading sold comps…