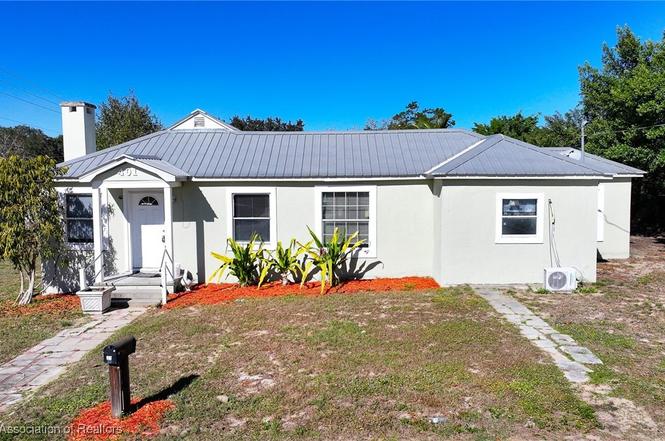
401 E Canfield St · Avon Park, FL
Flood risk 1/10 · Minimal
- FEMA flood zone
- X (unshaded)
- Chance of flooding over 30 yrs
- 0.0%
- Est. flood insurance / yr
- $507 – $1,088
Fire risk 4/10 · Minor
- Est. fire insurance / yr
- $947 – $1,759
Heat risk 9/10 · Severe
- Hot days now (above 108°F)
- 7 days/yr
- Hot days in 30 yrs
- 24 days/yr
Wind risk 9/10 · Severe
- Chance of severe wind over 30 yrs
- 99.0%
Air-quality risk 2/10 · Minimal
- Unhealthy air days now
- 2 days/yr
- Unhealthy air days in 30 yrs
- 2 days/yr
Risk factors via First Street. Map © Google.
Why this score? — see what drove the D- grade
The composite is a weighted blend of 9 inputs, each scored 0–100. Each bar is that input's sub-score; the figure is the points it added to the 100-point composite (weight × sub-score).
- ARV discount +14.5/15.0
- Cash flow +8.4/30.0
- Schools +3.6/10.0
- Livability +3.6/5.0
- 1% rule +2.6/10.0
- Rent growth +2.5/5.0
- Condition / age +2.5/5.0
- DSCR +2.3/10.0
- Appreciation +0.0/10.0
$159,000
🖨 Deal sheet (PDF) 📄 Offer letter ✓ Due diligence
Listing remarks
Welcome to this beautifully updated 3-bedroom, 2-bath concrete block home featuring a bonus room and a versatile layout in the heart of Avon Park. Recently remodeled, the home offers a durable metal roof, modern finishes, and flexible living space to suit a variety of needs. Positioned on a generous corner lot, the property provides extra yard space with excellent potential for outdoor enjoyment or future improvements. Whether you’re seeking a primary residence or a smart investment opportunity, this affordable home checks all the boxes.
Key facts
- Metal roof
- Bonus room
- Outdoor enjoyment
Tags
Property features AI
Finance
- Other: Zoning: R1A
Exterior
- Parking: Driveway; On-street parking
- Utilities: Public water; Public sewer (Sewer available)
- Home design: Single-family residence; One story; Residential property
- Construction: Block and concrete construction; Metal roof
- Exterior features: Rear porch; Paved road frontage (80 ft)
Interior
- Flooring: Vinyl
- Bathrooms: 2 full bathrooms
- Heating & cooling: Central electric heating; Central electric cooling
- Interior features: Vinyl flooring; One total room
Neighborhood map
What this means for you Summary
Snapshot
- This is a 2-bed/1.0-bath single-family listed at $159k.
Deal economics
- At list price, monthly cash flow is $-144 ($-2k/yr) — negative.
- To cash-flow at today's rent, offer at most $138k (13.1% below list).
- To meet the 1% rule (rent ≥ 1% of price), the offer needs to be $121k (24.0% below list).
- Recommended offer: $121k (24.0% below list) — sets the bar for 1% rule.
- Cap rate 5.2% vs local median 3.8% in Avon Park — top-decile yield for the area; either an underpriced asset or a hidden risk that comps aren't pricing in. Stress-test before assuming the spread holds.
Location & tenants
- Location reads 71/100 on livability (#407 in FL) — a middle-class / working-renter tenant base. Strengths: cost of living A+, housing A+, health & safety A+; Watch: crime D+, amenities F, commute F.
- Highlands (other): math 45% / reading 43% proficiency, ranked #54 of 73 in FL (top 74%) — families likely to look elsewhere, expect single-tenant / working-renter base with shorter leases; 68% free/reduced lunch — lower-income household profile, screen leases tightly.
- Zoned schools: Park Elementary School (math 62% / reading 47%, grade C, #892 of 2,144 statewide, top 44%, 527 students, 80% FRL); Avon Park Middle School (math 37% / reading 35%, grade F, #410 of 571 statewide, top 72%, 638 students, 77% FRL); Avon Park High School (math 35% / reading 39%, grade F, #340 of 667 statewide, top 52%, 928 students, 67% FRL).
- Market conditions: 478 active listings in the ZIP; 1 comparable units currently listed for rent nearby; 980 units permitted in Highlands County in 2024 (80 in 5+ unit buildings).
- This rent runs 31% of the median local income ($47k/yr) — at the standard rent-burdened threshold; future hikes will face affordability resistance.
Forward outlook
- Local home prices are declining (-3.0%/yr); year-one equity from $1k of loan paydown is wiped out by about $5k of value loss. Plan a longer hold.
Negotiation context
- It's been on market 162 days — a 12% lower offer ($140k) is reasonable based on typical stale-listing flexibility.
- 3 sale attempts with the ask held roughly flat each time — persistent listings suggest the price (not the market) is what's stuck; bring a comps-based counter.
Risks & watch-outs
- Watch-outs: built in 1940 — expect roof / HVAC / electrical / plumbing capex.
- Climate carrying-cost: severe wind risk, 99% chance of damaging wind over 30y; extreme-heat days projected 7→24/yr by 2055 (HVAC capex compounding) — expect insurance premiums to compound above CPI over the hold.
Questions for the listing agent
- What do current leases actually rent for vs. the listed asking? Can we see a recent rent roll and the last 12 months of T-12 income?
- It's been on market 162 days. Have you received any prior offers? Is the seller open to a 24% concession, seller financing, or rate buy-down credit?
- Built in 1940 — when were the roof, HVAC, electrical panel, plumbing, and water heater last replaced?
- Why hasn't it sold? Are there any deal-killer items the seller is aware of (foundation, flood, title, zoning, code violations)?
- Is there a deadline driving the sale (1031 exchange, divorce, estate, relocation)? That informs how much negotiation room exists.
- Schools are F-rated, which usually means shorter tenancies and higher turnover. Who's the typical renter profile here, and what's been the actual vacancy rate?
- Crime grade is D in this area — have there been break-ins, vandalism, or insurance claims at this property in the last 3 years? What carrier currently insures it and at what premium?
- The area grade is low — what's the realistic commute time and amenity access for the typical tenant pool here? Any planned neighborhood developments (good or bad) we should know about?
- What's the average days-on-market for RENTAL listings here right now (not sales)? A rising rental-DOM trend means longer vacancies and softer asking-rent achievability than the comps imply.
- What's the recent tenant-quality profile in this submarket — average credit score on applications, eviction rate, late-payment / NSF rate, and stable-employment percentage? A property-management company in the area should have these aggregated.
- How much new for-sale + rental construction is in the pipeline within 1–3 miles? Heavy new supply typically softens prices + rents 12–24 months out; constrained supply supports both.
Investment metrics
- 1% rule
- 0.76% ✗
- Cap rate
- 5.21%
- Cash-on-cash
- -3.88%
- DSCR
- 0.83
- GRM
- 11.0
CMA / ARV
- ARV (on-the-fly)
- $188,160
- Comps found
- 12
Show comp detail 12 sales within ~0.75 mi
| Address | Dist | Beds/Ba | Sqft | Sold | Price | $/sf | Match |
|---|---|---|---|---|---|---|---|
| 1333 Memorial Dr | 0.09mi | 3/1.0 (+1) | 1,324 (+3%) | 6mo | $32,000 | $24 | 80 |
| 420 Ed Carter St | 0.11mi | 2/1.0 | 1,355 (+6%) | 14mo | $65,000 | $48 | 73 |
| 225 Walnut St E | 0.23mi | 2/2.0 | 1,335 (+4%) | 14mo | $167,500 | $125 | 66 |
| 415 E Elm St | 0.33mi | 3/2.0 (+1) | 1,352 (+6%) | 1mo | $225,000 | $166 | 65 |
| 307 E Canfield St | 0.13mi | 3/2.0 (+1) | 1,360 (+6%) | 15mo | $200,000 | $147 | 62 |
| 508 E Cedar St | 0.61mi | 2/1.5 | 1,308 (+2%) | 7mo | $186,000 | $142 | 60 |
| 804 Boardman St | 0.55mi | 3/1.5 (+1) | 1,264 (-1%) | 8mo | $219,999 | $174 | 58 |
| 800 Pate St | 0.51mi | 2/2.0 | 1,382 (+8%) | 4mo | $242,000 | $175 | 56 |
| 507 E Dixie St | 0.26mi | 2/2.0 | 1,408 (+10%) | 15mo | $185,000 | $131 | 55 |
| 411 E Elm St | 0.33mi | 3/2.0 (+1) | 1,432 (+12%) | 6mo | $255,000 | $178 | 51 |
| 605 S Verona Ave | 0.41mi | 3/2.0 (+1) | 1,200 (-6%) | 13mo | $200,000 | $167 | 50 |
| 317 Joe Hilton St | 0.63mi | 3/2.0 (+1) | 1,448 (+13%) | 3mo | $199,000 | $137 | 37 |
Match score weights: distance 35% · size 25% · config 20% · recency 20%. Top-matched comps best support the ARV.
Projected returns pro-forma
-3.0% appreciation · 3.0% rent growth · sell at horizon
- IRR
- -22.8%
- Equity multiple
- 0.22×
- Total profit
- $-34,912
- Equity at exit
- $23,707
- IRR
- -17.2%
- Equity multiple
- 0.05×
- Total profit
- $-42,129
- Equity at exit
- $13,747
Cash invested: $44,520 (down + closing). Projections, not guarantees.
Landlord ↔ Tenant lean methodology
- Overall (STATE)
- 87 Strongly Landlord-Friendly
- State Florida
- 87 Strongly Landlord-Friendly · R+3
- County
- — inherits STATE
- City
- — inherits STATE
ZIP-level market 33825
- Home prices YoY
- -25.9%
- Active inventory
- 478
- Price-to-rent
- 11.0×
Monthly cashflow live
- Estimated rent
- $1,209 medium interval (Pro) →
- Mortgage (P&I)
- −$834
- Tax est. 1.5%
- −$199 /mo · $2,385/yr
- Insurance
- −$66
- HOA
- −$0
- Vacancy / Maint / Mgmt
- −$254
- Net cashflow
- $-144
Break-even live
Sensitivity live
| Price | -10% $-34 | -5% $-89 | +0% $-144 | +5% $-199 | +10% $-254 |
|---|---|---|---|---|---|
| Rent | -10% $-239 | -5% $-192 | +0% $-144 | +5% $-96 | +10% $-48 |
| Rate | -1.0pp $-64 | -0.5pp $-103 | base $-144 | +0.5pp $-185 | +1.0pp $-227 |
UW: 25.0% down · 7.5% · 30yr · 1.5% tax · 5.0% vac · 8.0% maint · 8.0% mgmt
Financing live
Cash to close
- Down payment
- $39,750
- Closing costs
- $4,770
- Reserves months
- —
- Total cash needed
- —
Loan-product check · same deal, 3 products live
Conventional
25% down · 7.5% · 30yr
- Down + closing
- —
- Monthly P&I
- —
- Monthly cashflow
- —
- DSCR
- —
- Eligible?
- —
Personal DTI + credit; lowest rate.
DSCR
20% down · 8.5% · 30yr
- Down + closing
- —
- Monthly P&I
- —
- Monthly cashflow
- —
- DSCR
- —
- Eligible?
- —
No personal income docs; deal must DSCR.
Hard money
10% down · 12.0% · 12mo
- Down + closing
- —
- Monthly P&I
- —
- Monthly cashflow
- —
- DSCR
- —
- Eligible?
- —
Short-term bridge; refi at stabilization.
Rent comps 1 comps
| Address | Beds | Baths | Sqft | Rent | $/sqft | DOM | Units | Dist |
|---|---|---|---|---|---|---|---|---|
| 565 Luminary LOOP Avon Park, FL | 2.0–3.0 | 1.5–2.0 | 1142 | $994 | $0.87 | 25d | 6 | 0.78mi |
Listing history 24 events
-
2026-06-21days on market $159,000 Active 162 DOM
-
2026-06-19days on market $159,000 Active 160 DOM
-
2026-06-18days on market $159,000 Active 159 DOM
-
2026-06-17days on market $159,000 Active 158 DOM
-
2026-06-16days on market $159,000 Active 157 DOM
-
2026-06-15days on market $159,000 Active 156 DOM
-
2026-06-14days on market $159,000 Active 154 DOM
-
2026-06-10days on market $159,000 Active 151 DOM
-
2026-06-09days on market $159,000 Active 150 DOM
-
2026-06-08days on market $159,000 Active 149 DOM
-
2026-06-07days on market $159,000 Active 148 DOM
-
2026-06-02days on market $159,000 Active 143 DOM
-
2026-06-01days on market $159,000 Active 142 DOM
-
2026-05-31days on market $159,000 Active 141 DOM
-
2026-05-30days on market $159,000 Active 140 DOM
-
2026-04-06status Active
-
2026-04-06historical
-
2026-03-18price $159,000
-
2026-02-17price $161,000
-
2026-02-12price $163,000
-
2026-01-12status Active
-
2026-01-08status Pending
-
2026-01-05$167,000 Active
-
2025-10-20price $169,000
ⓘ Source: listings_history table (triggers on properties + properties_extension) + one-shot
backfill from property_details.listing_events for pre-trigger history.
Climate risk First Street
- Flood 1/10 Low FEMA zone X (unshaded) · 0% chance over 30 yrs
- Wildfire 4/10 Moderate
- Heat 9/10 Extreme 7 d/yr ≥108°F today · 24 d/yr by 30 yrs out
- Wind 9/10 Extreme 99% chance of damaging wind over 30 yrs
- Air quality 2/10 Low 2 unhealthy d/yr today · 2 by 30 yrs out
Nearby sold comps map
Loading sold comps map…
Walkable amenities ~0.75 mi
Loading nearby amenities…
Taxation est. · year 1
- Rental income
- $14,505
- − Mortgage interest
- −$8,906
- − Property taxes
- −$2,385
- − Insurance
- −$795
- − Repairs & maintenance
- −$1,160
- − Management
- −$1,160
- − Depreciation
- −$4,625
- Taxable loss
- −$4,528
- Est. tax savings @ 24.0%
- +$1,087
- After-tax cash flow
- $-640/yr
For passive investors: Depreciation is non-cash, so a rental often shows a tax loss while cash-flowing — sheltering income. Rental losses are passive: they offset passive income freely, and up to $25,000/yr can offset ordinary (W-2) income if you actively participate and your MAGI is under $100k (phasing out to $0 by $150k); unused losses carry forward. On sale, claimed depreciation is recaptured at up to 25%, and gains may owe capital-gains tax (a 1031 exchange can defer both). Figures are a year-1 estimate at your 24.0% rate — not tax advice; consult a CPA.
Schools (NCES district)
- District
- Highlands
- NCES district ID
- 1200840
- Math proficiency
- 45% ▼ -7.00%
- Reading proficiency
- 43% ▼ -3.00%
- Median HH income
- $35,276
- Composite
- 36.42/100
- National rank
- #4672
- State rank
- #54 of 73 in FL
Livability — Avon Park
- Score
- 71/100
- State rank
- #407
- US rank
- #7205
Category grades
Schools grade is shown separately in the Schools card above.
Census & demographics
- Census place
- Avon Park, FL
- County
- Highlands County · 98,898 people
- City population
- 25,501
- Metro
- Sebring-Avon Park, FL
- Population (ZIP)
- 25,501
- Household income
- $46,949
- Rent vs Own
- Severe rent burden
- 691.0
Population outlook (Highlands County) Hauer SSP2
- Today (2025)
- 99,674 people
- By 2030
- 99,615 · -0.1%
- By 2040
- 99,342 · -0.3%
- By 2050
- 98,242 · -1.4%
- By 2075
- 93,291 · -6.4%
- By 2100
- 79,894 · -19.8%
Race, ethnicity, and origin ACS 2023
- Neighborhood character
- Diverse neighborhood (Simpson 0.64)
- Race & ethnicity
- White 51% Hispanic / Latino 27% Black 17% Two or more races 11% Asian 1%
- Hispanic origin (detail)
- Mexican 8% Puerto Rican 13% Cuban 2%
- Common ancestry
- Slovak 2% Lithuanian 2% Iranian 1%
- Foreign-born
- 10% · Canada, Vietnam, Guatemala
- Languages at home
- 74% English-only · Spanish 24% Tagalog/Filipino 1%
Political lean MEDSL · Highlands
- 2024 margin
- Solid R (+40.8) · D 29.3% · R 70.1%
- 2008→2024 swing
- -22.7pp toward R · 2008: -18.1pp · 2024: -40.8pp
- All cycles
- 2024: R+40.8 2020: R+34.4 2016: R+32.0 2012: R+23.0 2008: R+18.1
Not yet ingested
- Civics
- —
Market trends
- HPI YoY
- ▼ -98.54%
- Current HPI
- 281.8067
- Rent YoY
- —
- Metro
- Sebring-Avon Park, FL
- State GDP YoY
- ▲ 3.28%
- F500 in state
- 36
Industry mix (Fortune 500 HQ in FL)
| Industry | F500 HQs | Revenue |
|---|---|---|
| Industrial Technology | 2 | $29B |
|
||
| Insurance | 2 | $17B |
|
||
| Retail | 1 | $60B |
|
||
| Technology Distribution | 1 | $58B |
|
||
| Homebuilding | 1 | $35B |
|
||
| Technology Manufacturing | 1 | $35B |
|
||
Price history
-5.9% since first listed9 events — show timeline
- 2026-04-06 Relisted — HAOR as distributed by MLS GRID
- 2026-04-06 Delisted — HAOR as distributed by MLS GRID
- 2026-03-18 Price Changed $159,000 HAOR as distributed by MLS GRID
- 2026-02-17 Price Changed $161,000 HAOR as distributed by MLS GRID
- 2026-02-12 Price Changed $163,000 HAOR as distributed by MLS GRID
- 2026-01-12 Relisted — HAOR as distributed by MLS GRID
- 2026-01-08 Pending — HAOR as distributed by MLS GRID
- 2026-01-05 Listed $167,000 HAOR as distributed by MLS GRID
- 2025-10-20 Price Changed $169,000 HAOR as distributed by MLS GRID
Property tax history
+4.3%/yrLatest (2025): $223 · +19.4% YoY. Source: county tax records.
Cash-flow waterfall
monthlySold comps — $/sqft
last 12 mo · ≤1 miLoading sold comps…