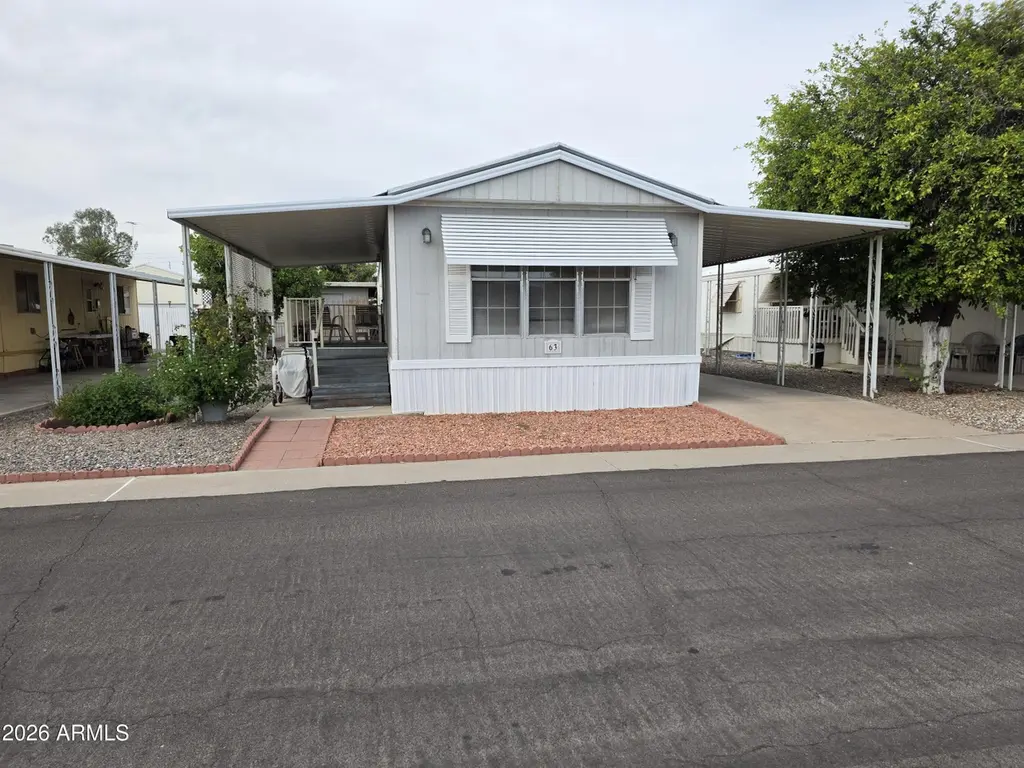
18026 N Cave Creek Rd #63 · Phoenix, AZ
Flood risk 1/10 · Minimal
- FEMA flood zone
- X (shaded)
- Chance of flooding over 30 yrs
- 0.0%
- Est. flood insurance / yr
- $507 – $1,088
Fire risk 4/10 · Minor
- Est. fire insurance / yr
- $610 – $1,132
Heat risk 8/10 · Major
- Hot days now (above 110°F)
- 5 days/yr
- Hot days in 30 yrs
- 13 days/yr
Wind risk 1/10 · Minimal
- Chance of severe wind over 30 yrs
- —
Air-quality risk 3/10 · Minor
- Unhealthy air days now
- 3 days/yr
- Unhealthy air days in 30 yrs
- 5 days/yr
Risk factors via First Street. Map © Google.
Why this score? — see what drove the D grade
The composite is a weighted blend of 9 inputs, each scored 0–100. Each bar is that input's sub-score; the figure is the points it added to the 100-point composite (weight × sub-score).
- Cash flow +15.0/30.0
- ARV discount +7.5/15.0
- 1% rule +5.0/10.0
- DSCR +5.0/10.0
- Schools +3.8/10.0
- Livability +3.8/5.0
- Condition / age +2.2/5.0
- Rent growth +2.1/5.0
- Appreciation +0.0/10.0
$40,000
🖨 Deal sheet 📄 Offer letter ✓ Due diligence
Listing remarks MLS
COMPLEX IS AGE RESTRICTED 55+ / Same owner last 19 years. Well Maintained New shower installed in 2024, AC replaced in about 2021 - 2022 and is serviced every 6 months. Furniture to convey with property see list in documents section. Separate Workshop with electricity on west side of unit.
Key facts
- Ac replaced
- New shower installed
- 1,120 sq ft lot
Tags
Neighborhood map
What this means for you Summary
Snapshot
- This is a 2-bed/2.0-bath manufactured listed at $40k. Condition is rated fair.
Deal economics
- At list price, monthly cash flow is $1k ($13k/yr) — positive.
- The deal already cash-flows at list — no discount required.
- Meets the 1% rule at list price ($2k rent vs $40k).
- Recommended offer: $39k (3.0% below list) — sets the bar for market timing.
- Cap rate 38.5% vs local median 3.3% in Phoenix — top-decile yield for the area; either an underpriced asset or a hidden risk that comps aren't pricing in. Stress-test before assuming the spread holds.
Location & tenants
- Location reads 75/100 on livability (#16 in AZ, #3,924 nationally) — a middle-class / working-renter tenant base. Strengths: amenities A+, commute A+, housing A+; Watch: health & safety C-, crime F.
- Paradise Valley Unified District (4241) (urban): math 39% / reading 46% proficiency, ranked #56 of 249 in AZ (top 22%) — families likely to look elsewhere, expect single-tenant / working-renter base with shorter leases.
- Market conditions: Rents soft (-1.5%/yr); 337 active listings in the ZIP; 40 comparable units currently listed for rent nearby; rentals at typical pace (median 15d on market — plan ~3-4 weeks tenant-placement turnaround); solid renter incomes; 36,011 units permitted in Maricopa County in 2024 (12,801 in 5+ unit buildings).
Forward outlook
- Local home prices are declining (-3.0%/yr); year-one equity from $277 of loan paydown is wiped out by about $1k of value loss. Plan a longer hold.
- Maricopa County population projected at +38% by 2050 — long-run rental-demand tailwind backs the buy-and-hold thesis.
- At projected returns (-3.0% appreciation + 0.0% rent growth), your $11k cash investment doubles in ~1 year — after that, you're playing with house money.
Negotiation context
- It's been on market 52 days — a 3% lower offer ($39k) is reasonable based on typical stale-listing flexibility.
Risks & watch-outs
- Climate carrying-cost: extreme-heat days projected 5→13/yr by 2055 (HVAC capex compounding) — expect insurance premiums to compound above CPI over the hold.
Questions for the listing agent
- It's been on market 52 days. Have you received any prior offers? Is the seller open to a 3% concession, seller financing, or rate buy-down credit?
- Have any recent inspections been done? Can we get a copy of the seller's disclosures and any deferred-maintenance estimates?
- Is there a deadline driving the sale (1031 exchange, divorce, estate, relocation)? That informs how much negotiation room exists.
- Crime grade is F in this area — have there been break-ins, vandalism, or insurance claims at this property in the last 3 years? What carrier currently insures it and at what premium?
- The area grade is low — what's the realistic commute time and amenity access for the typical tenant pool here? Any planned neighborhood developments (good or bad) we should know about?
- What's the average days-on-market for RENTAL listings here right now (not sales)? A rising rental-DOM trend means longer vacancies and softer asking-rent achievability than the comps imply.
- What's the recent tenant-quality profile in this submarket — average credit score on applications, eviction rate, late-payment / NSF rate, and stable-employment percentage? A property-management company in the area should have these aggregated.
- How much new for-sale + rental construction is in the pipeline within 1–3 miles? Heavy new supply typically softens prices + rents 12–24 months out; constrained supply supports both.
Investment metrics
- 1% rule
- 4.27% ✓
- Cap rate
- 38.53%
- Cash-on-cash
- 115.11%
- DSCR
- 6.12
- GRM
- 1.9
CMA / ARV
- ARV (median comp)
- $94,500
- List price
- $40,000
- Delta
- -57.67%
- Verdict
- UNDERPRICED
- Comps
- 20 within 1.0 mi
Show comp detail 12 sales within ~0.75 mi
| Address | Dist | Beds/Ba | Sqft | Sold | Price | $/sf | Match |
|---|---|---|---|---|---|---|---|
| 18026 N Cave Creek Rd #125 | 0.00mi | 2/1.0 | 960 (-14%) | 1mo | $35,000 | $36 | 71 |
| 2140 E Michigan Ave #35 | 0.17mi | 3/2.0 (+1) | 990 (-12%) | 1mo | $98,000 | $99 | 67 |
| 2034 E Charleston Ave | 0.27mi | 3/2.0 (+1) | 1,156 (+3%) | 13mo | $276,000 | $239 | 66 |
| 18026 N Cave Creek Rd #16 | 0.09mi | 2/1.0 | 952 (-15%) | 3mo | $49,000 | $51 | 64 |
| 2131 E Union Hills Dr Unit M5 | 0.24mi | 3/2.0 (+1) | 1,200 (+7%) | 12mo | $72,000 | $60 | 62 |
| 17827 N 19th St | 0.49mi | 3/2.0 (+1) | 1,096 (-2%) | 12mo | $130,000 | $119 | 58 |
| 1802 E Campo Bello Dr #29 | 0.56mi | 3/2.0 (+1) | 1,232 (+10%) | 4mo | $80,000 | $65 | 49 |
| 1939 E Libby St | 0.44mi | 2/2.0 | 980 (-12%) | 13mo | $175,000 | $179 | 48 |
| 1955 E Grovers Ave #9 | 0.46mi | 2/2.0 | 1,248 (+11%) | 14mo | $79,000 | $63 | 48 |
| 2701 E Utopia Rd #66 | 0.72mi | 2/2.0 | 1,024 (-9%) | 10mo | $50,000 | $49 | 44 |
| 19225 N Cave Creek Rd #45 | 0.74mi | 2/2.0 | 1,248 (+11%) | 11mo | $47,900 | $38 | 38 |
| 2701 E Utopia Rd #8 | 0.72mi | 3/2.0 (+1) | 984 (-12%) | 14mo | $72,000 | $73 | 30 |
Match score weights: distance 35% · size 25% · config 20% · recency 20%. Top-matched comps best support the ARV.
Projected returns pro-forma
-3.0% appreciation · 0.0% rent growth · sell at horizon
- IRR
- —
- Equity multiple
- 6.09×
- Total profit
- $56,962
- Equity at exit
- $5,964
- IRR
- —
- Equity multiple
- 11.58×
- Total profit
- $118,455
- Equity at exit
- $3,458
Cash invested: $11,200 (down + closing). Projections, not guarantees.
Landlord ↔ Tenant lean methodology
- Overall (STATE)
- 87 Strongly Landlord-Friendly
- State Arizona
- 87 Strongly Landlord-Friendly · R+3
- County
- — inherits STATE
- City
- — inherits STATE
ZIP-level market 85032
- Rents YoY
- -1.5%
- Active inventory
- 337
- Price-to-rent
- 1.9×
Monthly cashflow live
- Estimated rent
- $1,710 high interval (Pro) →
- Mortgage (P&I)
- −$210
- Tax est. 1.5%
- −$50 /mo · $600/yr
- Insurance
- −$17
- HOA
- −$0
- Vacancy / Maint / Mgmt
- −$359
- Net cashflow
- $1,074
Break-even live
UW: 25.0% down · 7.5% · 30yr · 1.5% tax · 5.0% vac · 8.0% maint · 8.0% mgmt
Financing live
Cash to close
- Down payment
- $10,000
- Closing costs
- $1,200
- Reserves months
- —
- Total cash needed
- —
Loan-product check · same deal, 3 products live
Conventional
25% down · 7.5% · 30yr
- Down + closing
- —
- Monthly P&I
- —
- Monthly cashflow
- —
- DSCR
- —
- Eligible?
- —
Personal DTI + credit; lowest rate.
DSCR
20% down · 8.5% · 30yr
- Down + closing
- —
- Monthly P&I
- —
- Monthly cashflow
- —
- DSCR
- —
- Eligible?
- —
No personal income docs; deal must DSCR.
Hard money
10% down · 12.0% · 12mo
- Down + closing
- —
- Monthly P&I
- —
- Monthly cashflow
- —
- DSCR
- —
- Eligible?
- —
Short-term bridge; refi at stabilization.
Rent comps 40 comps
| Address | Beds | Baths | Sqft | Rent | $/sqft | DOM | Units | Dist |
|---|---|---|---|---|---|---|---|---|
| 18202 N Cave Creek Rd Phoenix, AZ | 1.0–3.0 | 1.0–2.0 | 722 | $1,148 | $1.59 | 3d | 7 | 0.13mi |
| 2077 E Charleston Ave Phoenix, AZ | 2.0 | 1.0 | 720 | $1,295 | $1.80 | 24d | 1 | 0.20mi |
| 2067 E Charleston Ave Phoenix, AZ | 2.0 | 2.0 | 840 | $1,395 | $1.66 | 24d | 1 | 0.22mi |
| 17602 N Cave Creek Rd Phoenix, AZ | 2.0 | 1.0–2.0 | 650 | $1,625 | $2.50 | 2d | 13 | 0.25mi |
| 18416 N Cave Creek Rd Phoenix, AZ | 2.0 | 1.0–2.0 | 786 | $3,000 | $3.81 | 3d | 9 | 0.26mi |
| 2221 E Union Hills Dr #158 Phoenix, AZ | 3.0 | 2.0 | 1332 | $2,100 | $1.58 | 18d | 1 | 0.28mi |
| 18416 N Cave Creek Rd Unit 6 Phoenix, AZ | 1.0 | 1.0 | 748 | $1,250 | $1.67 | 7d | 1 | 0.29mi |
| 2554 E Villa Rita Dr Phoenix, AZ | 2.0 | 1.0 | 1118 | $2,750 | $2.46 | 24d | 1 | 0.38mi |
| 2602 E Charleston Ave Phoenix, AZ | 3.0 | 2.0 | 1426 | $2,100 | $1.47 | 24d | 1 | 0.42mi |
| 18660 N Cave Creek Rd Phoenix, AZ | 1.0–3.0 | 1.0–2.0 | 961 | $1,622 | $1.69 | 1d | 11 | 0.44mi |
| 17150 N 23rd St #135 Phoenix, AZ | 2.0 | 2.5 | 1186 | $1,900 | $1.60 | 14d | 1 | 0.49mi |
| 17365 N Cave Creek Rd #124 Phoenix, AZ | 3.0 | 2.5 | 1468 | $2,299 | $1.57 | 14d | 1 | 0.50mi |
| 2150 E Bell Rd #1102 Phoenix, AZ | 3.0 | 2.5 | 1462 | $1,945 | $1.33 | 14d | 1 | 0.55mi |
| 17150 N 23rd St Phoenix, AZ | 2.0 | 2.0–2.5 | 1172 | $1,712 | $1.46 | 4d | 2 | 0.57mi |
| 17150 N 23rd St Phoenix, AZ | 2.0 | 2.0–2.5 | 1172 | $1,712 | $1.46 | 3d | 2 | 0.57mi |
| 2755 E Michigan Ave Phoenix, AZ | 3.0 | 2.0 | 1316 | $2,700 | $2.05 | 17d | 1 | 0.60mi |
| 1717 E Union Hills Dr Phoenix, AZ | 2.0–3.0 | 2.0 | 1245 | $1,775 | $1.43 | 21d | 4 | 0.65mi |
| 1717 E Union Hills Dr Phoenix, AZ | 2.0–3.0 | 2.0 | 1169 | $1,675 | $1.43 | 2d | 3 | 0.65mi |
| 1717 E Union Hills Dr #1052 Phoenix, AZ | 2.0 | 2.0 | 1160 | $4,000 | $3.45 | 43d | 1 | 0.73mi |
| 1814 E Bell Rd Phoenix, AZ | 1.0–2.0 | 1.0–2.0 | 1003 | $1,637 | $1.63 | 1d | 12 | 0.73mi |
| 17606 N 17th Pl Phoenix, AZ | 2.0–3.0 | 2.0–2.5 | 1463 | $1,999 | $1.37 | 2d | 3 | 0.74mi |
| 17606 N 17th Pl Phoenix, AZ | 2.0–3.0 | 2.5 | 1472 | $1,999 | $1.36 | 12d | 3 | 0.74mi |
| 1702 E Michelle Dr Phoenix, AZ | 2.0 | 2.0 | 1300 | $2,200 | $1.69 | 4d | 1 | 0.76mi |
| 1920 E Bell Rd Phoenix, AZ | 2.0–3.0 | 2.0–2.5 | 1391 | $1,795 | $1.29 | 2d | 3 | 0.80mi |
| 1920 E Bell Rd Phoenix, AZ | 2.0–3.0 | 2.0–2.5 | 1391 | $1,695 | $1.22 | 13d | 5 | 0.80mi |
| 1920 E Bell Rd Phoenix, AZ | 2.0–3.0 | 2.0–2.5 | 1391 | $1,800 | $1.29 | 7d | 4 | 0.80mi |
| 16635 N Cave Creek Rd #214 Phoenix, AZ | 2.0 | 2.0 | 1134 | $1,300 | $1.15 | 19d | 1 | 0.84mi |
| 2335 E Utopia Rd Unit 16 Phoenix, AZ | 3.0 | 2.5 | 1426 | $2,550 | $1.79 | 18d | 1 | 0.86mi |
| 16602 N 25th St #109 Phoenix, AZ | 3.0 | 2.0 | 1136 | $1,224 | $1.08 | 20d | 1 | 0.87mi |
| 16602 N 25th St #109 Phoenix, AZ | 3.0 | 2.0 | 1136 | $1,224 | $1.08 | 24d | 1 | 0.87mi |
| 16801 N 26th St Apt 17 Phoenix, AZ | 2.0 | 1.0 | 800 | $1,195 | $1.49 | 24d | 1 | 0.87mi |
| 2214 E Aire Libre Ave Phoenix, AZ | 3.0 | 2.0 | 1284 | $2,080 | $1.62 | 5d | 1 | 0.87mi |
| 16627 N 25th St Unit 23 Phoenix, AZ | 2.0 | 1.0 | 765 | $1,145 | $1.50 | 24d | 1 | 0.88mi |
| 1750 E Bell Rd Phoenix, AZ | 1.0–2.0 | 1.0 | 700 | $1,349 | $1.93 | 24d | 1 | 0.89mi |
| 1302 E Aire Libre Ave Unit 104 Phoenix, AZ | 3.0 | 2.0 | 1254 | $1,850 | $1.48 | 24d | 1 | 0.89mi |
| 2336 E Utopia Rd Phoenix, AZ | 2.0–3.0 | 2.5 | 1327 | $2,395 | $1.80 | 5d | 1 | 0.90mi |
| 2712 E Juniper Ave Phoenix, AZ | 3.0 | 2.0 | 1435 | $1,435 | $1.00 | 4d | 1 | 0.91mi |
| 1702 E Bell Rd #180 Phoenix, AZ | 3.0 | 2.5 | 1358 | $2,000 | $1.47 | 24d | 1 | 0.96mi |
| 2424 E Grandview Rd Phoenix, AZ | 2.0 | 1.0 | 700 | $942 | $1.35 | 21d | 1 | 1.01mi |
| 2424 E Grandview Rd Phoenix, AZ | 2.0 | 1.0 | 700 | $1,159 | $1.66 | 24d | 1 | 1.01mi |
Listing history 13 events
-
2026-06-18days on market $40,000 Active 52 DOM
-
2026-06-17pricedays on market $40,000 Active 51 DOM
-
2026-06-16days on market $66,000 Active 50 DOM
-
2026-06-15days on market $66,000 Active 49 DOM
-
2026-06-08days on market $66,000 Active 47 DOM
-
2026-06-07days on market $66,000 Active 46 DOM
-
2026-06-04days on market $66,000 Active 43 DOM
-
2026-06-03days on market $66,000 Active 42 DOM
-
2026-06-02days on market $66,000 Active 41 DOM
-
2026-06-01days on market $66,000 Active 40 DOM
-
2026-05-31days on market $66,000 Active 39 DOM
-
2026-04-23price $66,000 292-char remark
Show marketing remark (292 chars)
COMPLEX IS AGE RESTRICTED 55+ / Same owner last 19 years. Well Maintained New shower installed in 2024, AC replaced in about 2021 - 2022 and is serviced every 6 months. Furniture to convey with property see list in documents section. Separate Workshop with electricity on west side of unit.
-
2026-04-22$63,000 Active 292-char remark
Show marketing remark (292 chars)
COMPLEX IS AGE RESTRICTED 55+ / Same owner last 19 years. Well Maintained New shower installed in 2024, AC replaced in about 2021 - 2022 and is serviced every 6 months. Furniture to convey with property see list in documents section. Separate Workshop with electricity on west side of unit.
ⓘ Source: listings_history table (triggers on properties + properties_extension) + one-shot
backfill from property_details.listing_events for pre-trigger history.
Climate risk First Street
- Flood 1/10 Low FEMA zone X (shaded) · 0% chance over 30 yrs
- Wildfire 4/10 Moderate
- Heat 8/10 Severe 5 d/yr ≥110°F today · 13 d/yr by 30 yrs out
- Wind 1/10 Low
- Air quality 3/10 Moderate 3 unhealthy d/yr today · 5 by 30 yrs out
Nearby sold comps map
Loading sold comps map…
Walkable amenities ~0.75 mi
Loading nearby amenities…
Taxation est. · year 1
- Rental income
- $20,519
- − Mortgage interest
- −$2,241
- − Property taxes
- −$600
- − Insurance
- −$200
- − Repairs & maintenance
- −$1,642
- − Management
- −$1,642
- − Depreciation
- −$1,164
- Taxable income
- $13,032
- Est. tax owed @ 24.0%
- −$3,128
- After-tax cash flow
- $9,765/yr
For passive investors: Depreciation is non-cash, so a rental often shows a tax loss while cash-flowing — sheltering income. Rental losses are passive: they offset passive income freely, and up to $25,000/yr can offset ordinary (W-2) income if you actively participate and your MAGI is under $100k (phasing out to $0 by $150k); unused losses carry forward. On sale, claimed depreciation is recaptured at up to 25%, and gains may owe capital-gains tax (a 1031 exchange can defer both). Figures are a year-1 estimate at your 24.0% rate — not tax advice; consult a CPA.
Condition & rehab AI · 12 photos
This mobile home requires moderate repairs and maintenance, with potential for significant value increase through updates.
Repairs flagged
- Minor Ceiling fan in living room — Visible wear
- Minor Ceiling fan in bedroom — Visible wear
Value-add opportunities
- Both Painting and updating interior walls — Enhances curb appeal and interior aesthetics
- Both Upgrading flooring — Improves comfort and resale value
- Both Landscaping improvements — Enhances curb appeal and property value
Renovation cost estimate screening
| Repair item | Severity | Est. cost |
|---|---|---|
| Ceiling fan in living room · Visible wear | Minor | $500–3,000 |
| Ceiling fan in bedroom · Visible wear | Minor | $500–3,000 |
| Total estimated repair cost · 2 items | $1,000–6,000 |
Value-add ROI direction
- Both Painting and updating interior walls — Enhances curb appeal and interior aesthetics ↑
- Both Upgrading flooring — Improves comfort and resale value ↑
- Both Landscaping improvements — Enhances curb appeal and property value ↑
ⓘ Cost ranges are severity-bucket heuristics (US national rule-of-thumb). Get contractor quotes + a written scope before underwriting a rehab budget.
Schools (NCES district)
- District
- Paradise Valley Unified District (4241)
- NCES district ID
- 0405930
- Math proficiency
- 39% ▼ -11.00%
- Reading proficiency
- 46% ▼ -7.00%
- Median HH income
- $64,106
- Composite
- 37.89/100
- National rank
- #4316
- State rank
- #56 of 249 in AZ
Livability — Phoenix
- Score
- 75/100
- State rank
- #16
- US rank
- #3924
Category grades
Schools grade is shown separately in the Schools card above.
Census & demographics
- Census place
- Phoenix, AZ
- County
- Maricopa County · 4,537,380 people
- City population
- 1,500,198
- Metro
- Phoenix-Mesa-Chandler, AZ
- Population (ZIP)
- 70,839
- Household income
- $78,643
- Rent vs Own
- Severe rent burden
- 2887.0
Population outlook (Maricopa County) Hauer SSP2
- Today (2025)
- 4,979,203 people
- By 2030
- 5,378,229 · +8.0%
- By 2040
- 6,156,598 · +23.6%
- By 2050
- 6,872,376 · +38.0%
- By 2075
- 8,401,270 · +68.7%
- By 2100
- 9,247,439 · +85.7%
Race, ethnicity, and origin ACS 2023
- Neighborhood character
- Diverse neighborhood (Simpson 0.57)
- Race & ethnicity
- White 59% Hispanic / Latino 29% Two or more races 17% Asian 4% Black 3% Native American 2%
- Hispanic origin (detail)
- Mexican 25%
- Common ancestry
- Romanian 2% Slovak 2% Portuguese 2%
- Foreign-born
- 18% · Canada, China
- Languages at home
- 71% English-only · Spanish 21% Russian/Polish/Slavic 2% Other Indo-European 1%
Political lean MEDSL · Maricopa
- 2024 margin
- Toss-up / Even · D 47.7% · R 51.2% · Other 1.1%
- 2008→2024 swing
- +7.1pp toward D · 2008: -10.6pp · 2024: -3.5pp
- All cycles
- 2024: R+3.5 2020: D+2.2 2016: R+3.5 2012: R+12.0 2008: R+10.6
Not yet ingested
- Civics
- —
Market trends
- HPI YoY
- ▼ -488.65%
- Current HPI
- 339.4181
- Rent YoY
- ▼ -1.46%
- Metro
- Phoenix-Mesa-Chandler, AZ
- State GDP YoY
- ▲ 4.54%
- F500 in state
- 20
Industry mix (Fortune 500 HQ in AZ)
| Industry | F500 HQs | Revenue |
|---|---|---|
| Technology | 2 | $13B |
|
||
| Mining / Metals | 1 | $23B |
|
||
| Environmental Services | 1 | $16B |
|
||
| Metals / Steel | 1 | $14B |
|
||
| Technology Distribution | 1 | $9B |
|
||
| Homebuilding | 1 | $8B |
|
||
Price history
+4.8% since first listed2 events — show timeline
- 2026-04-23 Price Changed $66,000 ARMLS
- 2026-04-22 Listed $63,000 ARMLS
Cash-flow waterfall
monthlySold comps — $/sqft
last 12 mo · ≤1 miLoading sold comps…