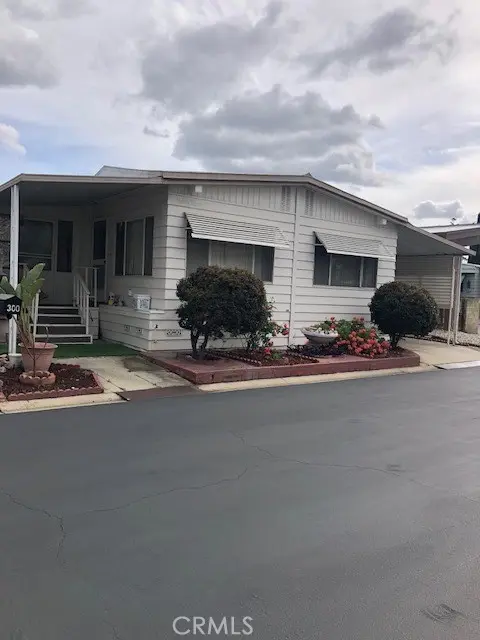
1441 Paso Real Ave #300 · Rowland Heights, CA
Flood risk 1/10 · Minimal
- FEMA flood zone
- X (unshaded)
- Chance of flooding over 30 yrs
- 0.0%
- Est. flood insurance / yr
- $507 – $1,088
Fire risk 1/10 · Minimal
- Est. fire insurance / yr
- $659 – $1,223
Heat risk 6/10 · Moderate
- Hot days now (above 99°F)
- 7 days/yr
- Hot days in 30 yrs
- 21 days/yr
Wind risk 1/10 · Minimal
- Chance of severe wind over 30 yrs
- —
Air-quality risk 7/10 · Major
- Unhealthy air days now
- 13 days/yr
- Unhealthy air days in 30 yrs
- 14 days/yr
Risk factors via First Street. Map © Google.
Why this score? — see what drove the C+ grade
The composite is a weighted blend of 9 inputs, each scored 0–100. Each bar is that input's sub-score; the figure is the points it added to the 100-point composite (weight × sub-score).
- Cash flow +30.0/30.0
- 1% rule +10.0/10.0
- DSCR +10.0/10.0
- Rent growth +5.0/5.0
- Schools +4.5/10.0
- Livability +2.5/5.0
- Condition / age +2.2/5.0
- ARV discount +0.0/15.0
- Appreciation +0.0/10.0
$250,000
🖨 Deal sheet 📄 Offer letter ✓ Due diligence
Listing remarks MLS
It's located near the entrance—1440 square feet with 4 nice size bedrooms. The kitchen is open to the living room. 300+ square feet enclosed patio added with the permit and added more living spaces. Newer wood flooring. The long carport can park 3-4 cars. Motivated seller! We will consider all reasonable offers.
Key facts
- Community pool
- Built 1974
- Listed 16 days
Neighborhood map
What this means for you Summary
Snapshot
- This is a 4-bed/3.0-bath manufactured listed at $250k. Condition is rated fair.
Deal economics
- At list price, monthly cash flow is $1k ($15k/yr) — positive.
- The deal already cash-flows at list — no discount required.
- Meets the 1% rule at list price ($4k rent vs $250k).
- Recommended offer: $246k (1.5% below list) — sets the bar for market timing.
- Cap rate 12.4% vs local median 2.7% in Rowland Heights — top-decile yield for the area; either an underpriced asset or a hidden risk that comps aren't pricing in. Stress-test before assuming the spread holds.
Location & tenants
- Location reads 50/100 on livability (#1,123 in CA) — a working-class tenant base; expect higher turnover. Strengths: employment A; Watch: crime C-, amenities F, commute F.
- Rowland Unified (suburban): math 40% / reading 62% proficiency, ranked #134 of 517 in CA (top 26%) — acceptable for families but not a draw, mixed tenant base, ~2y average lease.
- Market conditions: Rents rising fast (+10.3%/yr); 102 active listings in the ZIP; 25 comparable units currently listed for rent nearby; rentals at typical pace (median 22d on market — plan ~3-4 weeks tenant-placement turnaround); 40% of comp listings sitting > 30 days — soft ceiling on asking rent; solid renter incomes; 19,697 units permitted in Los Angeles County in 2024 (9,426 in 5+ unit buildings).
- At $3,789/mo this rent would consume 54% of the median local household income ($83k/yr) (locally 1440% of renters already pay >50% of income on rent) — very limited rent-growth headroom before tenants either downsize or default.
Forward outlook
- Local home prices are declining (-3.0%/yr); year-one equity from $2k of loan paydown is wiped out by about $8k of value loss. Plan a longer hold.
- Los Angeles County population projected at +9% by 2050 — modest demand growth; plan on rents tracking national, not racing it.
- At projected returns (-3.0% appreciation + 8.0% rent growth), your $70k cash investment doubles in ~5 years — after that, you're playing with house money.
Negotiation context
- It's been on market 17 days — a 2% lower offer ($246k) is reasonable based on typical stale-listing flexibility.
- 2 sale attempts since 3y ago; this cycle's ask has dropped $40k (14%) from the opening price — seller is motivated, your offer sets the floor, not the list.
- Current owner paid $165k; list at $250k implies a 52% gain — meaningful room to come down on a strong offer.
Risks & watch-outs
- Climate carrying-cost: extreme-heat days projected 7→21/yr by 2055 (HVAC capex compounding) — expect insurance premiums to compound above CPI over the hold.
Questions for the listing agent
- Have any recent inspections been done? Can we get a copy of the seller's disclosures and any deferred-maintenance estimates?
- Built in 1974 — when were the roof, HVAC, electrical panel, plumbing, and water heater last replaced?
- Is there a deadline driving the sale (1031 exchange, divorce, estate, relocation)? That informs how much negotiation room exists.
- What's the average days-on-market for RENTAL listings here right now (not sales)? A rising rental-DOM trend means longer vacancies and softer asking-rent achievability than the comps imply.
- What's the recent tenant-quality profile in this submarket — average credit score on applications, eviction rate, late-payment / NSF rate, and stable-employment percentage? A property-management company in the area should have these aggregated.
- How much new for-sale + rental construction is in the pipeline within 1–3 miles? Heavy new supply typically softens prices + rents 12–24 months out; constrained supply supports both.
Investment metrics
- 1% rule
- 1.52% ✓
- Cap rate
- 12.37%
- Cash-on-cash
- 21.69%
- DSCR
- 1.97
- GRM
- 5.5
CMA / ARV
- ARV (median comp)
- $170,605
- List price
- $250,000
- Delta
- 40.67%
- Verdict
- OVERPRICED
- Comps
- 20 within 1.0 mi
Show comp detail 12 sales within ~0.75 mi
| Address | Dist | Beds/Ba | Sqft | Sold | Price | $/sf | Match |
|---|---|---|---|---|---|---|---|
| 1441 Paso Real Ave #246 | 0.08mi | 4/3.0 | 1,440 (0%) | 0mo | $210,000 | $146 | 96 |
| 1441 S Paso Real Ave #27 | 0.08mi | 4/2.0 | 1,440 (0%) | 5mo | $195,000 | $135 | 88 |
| 1441 Paso Real Ave #327 | 0.08mi | 3/2.0 (-1) | 1,440 (0%) | 1mo | $200,000 | $139 | 86 |
| 1441 Paso Real Ave #203 | 0.08mi | 4/2.0 | 1,493 (+4%) | 4mo | $230,000 | $154 | 83 |
| 1441 Paso Real Ave #255 | 0.08mi | 3/2.0 (-1) | 1,440 (0%) | 8mo | $193,000 | $134 | 81 |
| 1441 Paso Real Ave #271 | 0.17mi | 5/4.0 (+1) | 1,440 (0%) | 6mo | $238,000 | $165 | 78 |
| 1441 Paso Real Ave #119 | 0.08mi | 3/2.0 (-1) | 1,392 (-3%) | 4mo | $220,000 | $158 | 78 |
| 1441 Paso Real Ave #184 | 0.17mi | 3/2.0 (-1) | 1,493 (+4%) | 9mo | $285,470 | $191 | 70 |
| 1560 S Otterbein Ave #58 | 0.61mi | 3/3.0 (-1) | 1,440 (0%) | 8mo | $345,000 | $240 | 60 |
| 1560 Otterbein Ave #12 | 0.61mi | 3/2.0 (-1) | 1,414 (-2%) | 4mo | $365,000 | $258 | 56 |
| 1560 S Otterbein Ave #113 | 0.61mi | 3/2.0 (-1) | 1,568 (+9%) | 4mo | $308,000 | $196 | 45 |
| 1560 S Otterbein #138 Ave #138 | 0.61mi | 3/2.0 (-1) | 1,320 (-8%) | 10mo | $300,000 | $227 | 40 |
Match score weights: distance 35% · size 25% · config 20% · recency 20%. Top-matched comps best support the ARV.
Projected returns pro-forma
-3.0% appreciation · 8.0% rent growth · sell at horizon
- IRR
- 19.9%
- Equity multiple
- 1.86×
- Total profit
- $60,166
- Equity at exit
- $37,276
- IRR
- 31.4%
- Equity multiple
- 4.54×
- Total profit
- $247,537
- Equity at exit
- $21,615
Cash invested: $70,000 (down + closing). Projections, not guarantees.
Landlord ↔ Tenant lean methodology
- Overall (STATE)
- 18 Strongly Tenant-Friendly
- State California
- 18 Strongly Tenant-Friendly · D+13
- County
- — inherits STATE
- City
- — inherits STATE
ZIP-level market 91748
- Rents YoY
- 10.3%
- Active inventory
- 102
- Price-to-rent
- 5.5×
Monthly cashflow live
- Estimated rent
- $3,789 high interval (Pro) →
- Mortgage (P&I)
- −$1,311
- Tax est. 1.5%
- −$312 /mo · $3,750/yr
- Insurance
- −$104
- HOA
- −$0
- Vacancy / Maint / Mgmt
- −$796
- Net cashflow
- $1,265
Break-even live
UW: 25.0% down · 7.5% · 30yr · 1.5% tax · 5.0% vac · 8.0% maint · 8.0% mgmt
Financing live
Cash to close
- Down payment
- $62,500
- Closing costs
- $7,500
- Reserves months
- —
- Total cash needed
- —
Loan-product check · same deal, 3 products live
Conventional
25% down · 7.5% · 30yr
- Down + closing
- —
- Monthly P&I
- —
- Monthly cashflow
- —
- DSCR
- —
- Eligible?
- —
Personal DTI + credit; lowest rate.
DSCR
20% down · 8.5% · 30yr
- Down + closing
- —
- Monthly P&I
- —
- Monthly cashflow
- —
- DSCR
- —
- Eligible?
- —
No personal income docs; deal must DSCR.
Hard money
10% down · 12.0% · 12mo
- Down + closing
- —
- Monthly P&I
- —
- Monthly cashflow
- —
- DSCR
- —
- Eligible?
- —
Short-term bridge; refi at stabilization.
Rent comps 25 comps
| Address | Beds | Baths | Sqft | Rent | $/sqft | DOM | Units | Dist |
|---|---|---|---|---|---|---|---|---|
| 1809 Paso Real Ave Rowland Heights, CA | 4.0 | 2.0 | 1259 | $3,500 | $2.78 | 24d | 1 | 0.28mi |
| 18617 Trot Ave Rowland Heights, CA | 3.0 | 2.0 | 1251 | $3,350 | $2.68 | 17d | 1 | 0.31mi |
| 1808 Santa Ysabela Dr Rowland Heights, CA | 4.0 | 2.0 | 1175 | $3,500 | $2.98 | 21d | 1 | 0.33mi |
| 18417 Santar St Rowland Heights, CA | 4.0 | 2.0 | 1142 | $3,300 | $2.89 | 17d | 1 | 0.50mi |
| 1316 Raleo Ave Rowland Heights, CA | 4.0 | 2.0 | 1200 | $5,000 | $4.17 | 15d | 1 | 0.60mi |
| 18573 Farjardo St Rowland Heights, CA | 3.0 | 2.0 | 1300 | $3,750 | $2.88 | 44d | 1 | 0.65mi |
| 19231 Tranbarger St Rowland Heights, CA | 3.0 | 2.0 | 1170 | $3,200 | $2.74 | 44d | 1 | 0.69mi |
| 18658 Mescalero St Rowland Heights, CA | 3.0 | 2.0 | 1352 | $3,800 | $2.81 | 22d | 1 | 0.70mi |
| 19319 Pilario St Rowland Heights, CA | 4.0 | 2.0 | 1480 | $3,750 | $2.53 | 44d | 1 | 0.83mi |
| 2415 Los Padres Dr Rowland Heights, CA | 3.0 | 2.0 | 1120 | $3,300 | $2.95 | 17d | 1 | 0.91mi |
| 18626 Barroso St Rowland Heights, CA | 3.0 | 2.0 | 1446 | $3,890 | $2.69 | 3d | 1 | 0.97mi |
| 2240 Electra Ave Rowland Heights, CA | 3.0 | 2.0 | 1256 | $3,200 | $2.55 | 17d | 1 | 0.97mi |
| 2243 Otterbein Ave Rowland Heights, CA | 3.0 | 2.0 | 1286 | $3,600 | $2.80 | 44d | 1 | 0.98mi |
| 18448 La Guardia St Rowland Heights, CA | 4.0 | 2.0 | 1386 | $6,900 | $4.98 | 1d | 1 | 1.06mi |
| 19358 Alcona St Rowland Heights, CA | 4.0 | 2.0 | 1613 | $3,950 | $2.45 | 44d | 1 | 1.15mi |
| 19530 Springport Dr Rowland Heights, CA | 5.0 | 2.0 | 1600 | $3,499 | $2.19 | 44d | 1 | 1.15mi |
| 1862 Hollandale Ave Rowland Heights, CA | 4.0 | 2.0 | 1588 | $4,250 | $2.68 | 17d | 1 | 1.16mi |
| 2817 E Valley Blvd West Covina, CA | 3.0 | 2.0 | 1050 | $3,100 | $2.95 | 44d | 1 | 1.17mi |
| 2143 Arcdale Ave Rowland Heights, CA | 3.0 | 2.0 | 1386 | $3,500 | $2.53 | 24d | 1 | 1.21mi |
| 4037 S Ellesford Ave West Covina, CA | 4.0 | 2.0 | 1790 | $4,195 | $2.34 | 1d | 1 | 1.21mi |
| 684 Panorama Ln La Puente, CA | 3.0 | 3.5 | 1683 | $3,600 | $2.14 | 21d | 1 | 1.24mi |
| 684 Panorama Ln La Puente, CA | 3.0 | 3.5 | 1683 | $3,600 | $2.14 | 17d | 1 | 1.24mi |
| 19307 Oakview Ln Rowland Heights, CA | 4.0 | 2.0 | 1789 | $3,850 | $2.15 | 44d | 1 | 1.24mi |
| 2454 Hillman Ln Rowland Heights, CA | 3.0 | 2.5 | 1506 | $3,800 | $2.52 | 44d | 1 | 1.35mi |
| 2751 Batson Ave Rowland Heights, CA | 3.0 | 2.0 | 1350 | $3,100 | $2.30 | 44d | 1 | 1.50mi |
Listing history 20 events
-
2026-06-13days on market $250,000 Coming Soon 17 DOM
-
2026-06-13days on market $250,000 Coming Soon 16 DOM
-
2026-06-09days on market $250,000 Coming Soon 13 DOM
-
2026-06-08days on market $250,000 Coming Soon 12 DOM
-
2026-06-07days on market $250,000 Coming Soon 11 DOM
-
2026-06-04days on market $250,000 Coming Soon 8 DOM
-
2026-06-03days on market $250,000 Coming Soon 7 DOM
-
2026-06-02days on market $250,000 Coming Soon 6 DOM
-
2026-06-01days on market $250,000 Coming Soon 5 DOM
-
2026-05-31days on market $250,000 Coming Soon 4 DOM
-
2026-05-12price $260,000
-
2026-05-12historical
-
2026-05-01price $239,990
-
2026-04-09price $269,000
-
2025-12-15$290,000 Active
-
2023-10-06soldstatus $165,000 Closed Sale 319-char remark
Show marketing remark (319 chars)
It's located near the entrance—1440 square feet with 4 nice size bedrooms. The kitchen is open to the living room. 300+ square feet enclosed patio added with the permit and added more living spaces. Newer wood flooring. The long carport can park 3-4 cars. Motivated seller! We will consider all reasonable offers.
-
2023-09-25status Pending Sale 319-char remark
Show marketing remark (319 chars)
It's located near the entrance—1440 square feet with 4 nice size bedrooms. The kitchen is open to the living room. 300+ square feet enclosed patio added with the permit and added more living spaces. Newer wood flooring. The long carport can park 3-4 cars. Motivated seller! We will consider all reasonable offers.
-
2023-08-28historical Active Under Contract 319-char remark
Show marketing remark (319 chars)
It's located near the entrance—1440 square feet with 4 nice size bedrooms. The kitchen is open to the living room. 300+ square feet enclosed patio added with the permit and added more living spaces. Newer wood flooring. The long carport can park 3-4 cars. Motivated seller! We will consider all reasonable offers.
-
2023-07-18price $175,000 319-char remark
Show marketing remark (319 chars)
It's located near the entrance—1440 square feet with 4 nice size bedrooms. The kitchen is open to the living room. 300+ square feet enclosed patio added with the permit and added more living spaces. Newer wood flooring. The long carport can park 3-4 cars. Motivated seller! We will consider all reasonable offers.
-
2023-05-19$178,000 Active 319-char remark
Show marketing remark (319 chars)
It's located near the entrance—1440 square feet with 4 nice size bedrooms. The kitchen is open to the living room. 300+ square feet enclosed patio added with the permit and added more living spaces. Newer wood flooring. The long carport can park 3-4 cars. Motivated seller! We will consider all reasonable offers.
ⓘ Source: listings_history table (triggers on properties + properties_extension) + one-shot
backfill from property_details.listing_events for pre-trigger history.
Climate risk First Street
- Flood 1/10 Low FEMA zone X (unshaded) · 0% chance over 30 yrs
- Wildfire 1/10 Low
- Heat 6/10 Major 7 d/yr ≥99°F today · 21 d/yr by 30 yrs out
- Wind 1/10 Low
- Air quality 7/10 Severe 13 unhealthy d/yr today · 14 by 30 yrs out
Nearby sold comps map
Loading sold comps map…
Walkable amenities ~0.75 mi
Loading nearby amenities…
Taxation est. · year 1
- Rental income
- $45,465
- − Mortgage interest
- −$14,004
- − Property taxes
- −$3,750
- − Insurance
- −$1,250
- − Repairs & maintenance
- −$3,637
- − Management
- −$3,637
- − Depreciation
- −$7,273
- Taxable income
- $11,914
- Est. tax owed @ 24.0%
- −$2,859
- After-tax cash flow
- $12,326/yr
For passive investors: Depreciation is non-cash, so a rental often shows a tax loss while cash-flowing — sheltering income. Rental losses are passive: they offset passive income freely, and up to $25,000/yr can offset ordinary (W-2) income if you actively participate and your MAGI is under $100k (phasing out to $0 by $150k); unused losses carry forward. On sale, claimed depreciation is recaptured at up to 25%, and gains may owe capital-gains tax (a 1031 exchange can defer both). Figures are a year-1 estimate at your 24.0% rate — not tax advice; consult a CPA.
Condition & rehab AI · 3 photos
This mobile home requires significant exterior and interior repairs, but is move-in ready with a good layout and potential for substantial value increase through targeted renovations.
Repairs flagged
- Major exterior siding — Significant wear and tear
- Major roof — Aged appearance
- Major HVAC/mechanicals — No visible systems, likely outdated
Value-add opportunities
- Resale Paint exterior — Enhances curb appeal
- Resale Replace awning windows — Improves natural light and aesthetics
- Both Replace HVAC — Improves comfort and energy efficiency
Renovation cost estimate screening
| Repair item | Severity | Est. cost |
|---|---|---|
| exterior siding · Significant wear and tear | Major | $15,000–50,000 |
| roof · Aged appearance | Major | $15,000–50,000 |
| HVAC/mechanicals · No visible systems, likely outdated | Major | $15,000–50,000 |
| Total estimated repair cost · 3 items | $45,000–150,000 |
Value-add ROI direction
- Resale Paint exterior — Enhances curb appeal ↑
- Resale Replace awning windows — Improves natural light and aesthetics ↑
- Both Replace HVAC — Improves comfort and energy efficiency ↑
ⓘ Cost ranges are severity-bucket heuristics (US national rule-of-thumb). Get contractor quotes + a written scope before underwriting a rehab budget.
Schools (NCES district)
- District
- Rowland Unified
- NCES district ID
- 0633750
- Math proficiency
- 40% ▼ -1.00%
- Reading proficiency
- 62% ▲ 11.00%
- Median HH income
- $63,667
- Composite
- 44.83/100
- National rank
- #2733
- State rank
- #134 of 517 in CA
Livability — Rowland Heights
- Score
- 50/100
- State rank
- #1123
- US rank
- #25637
Category grades
Schools grade is shown separately in the Schools card above.
Census & demographics
- Census place
- Rowland Heights, CA
- County
- Los Angeles County · 9,444,647 people
- City population
- 42,463
- Metro
- Los Angeles-Long Beach-Anaheim, CA
- Population (ZIP)
- 42,463
- Household income
- $83,428
- Rent vs Own
- Severe rent burden
- 1440.0
Population outlook (Los Angeles County) Hauer SSP2
- Today (2025)
- 10,940,515 people
- By 2030
- 11,256,481 · +2.9%
- By 2040
- 11,729,929 · +7.2%
- By 2050
- 11,948,407 · +9.2%
- By 2075
- 11,818,114 · +8.0%
- By 2100
- 10,842,928 · -0.9%
Race, ethnicity, and origin ACS 2023
- Neighborhood character
- Majority Asian (59%)
- Race & ethnicity
- Asian 59% Hispanic / Latino 31% Two or more races 6% White 6% Black 1%
- Hispanic origin (detail)
- Mexican 25%
- Foreign-born
- 55% · China, Canada, South Korea
- Languages at home
- 25% English-only · Chinese 37% Spanish 22% Tagalog/Filipino 5%
Political lean MEDSL · Los Angeles
- 2024 margin
- Solid D (+32.9) · D 64.8% · R 31.9% · Other 3.3%
- 2008→2024 swing
- -7.4pp toward R · 2008: 40.4pp · 2024: 32.9pp
- All cycles
- 2024: D+32.9 2020: D+44.2 2016: D+48.0 2012: D+40.0 2008: D+40.4
Not yet ingested
- Civics
- —
Market trends
- HPI YoY
- ▼ -754.24%
- Current HPI
- 364.5923
- Rent YoY
- ▲ 10.27%
- Metro
- Los Angeles-Long Beach-Anaheim, CA
- State GDP YoY
- ▲ 3.21%
- F500 in state
- 116
Industry mix (Fortune 500 HQ in CA)
| Industry | F500 HQs | Revenue |
|---|---|---|
| Technology | 27 | $1,492B |
|
||
| Financial Services | 3 | $174B |
|
||
| Retail | 3 | $44B |
|
||
| Insurance | 3 | $26B |
|
||
| Media / Entertainment | 2 | $115B |
|
||
| Pharmaceuticals / Biotech | 2 | $62B |
|
||
Price history
+46.1% since first listed10 events — show timeline
- 2026-05-12 Listing Removed — CRMLS
- 2026-05-12 Price Changed $260,000 CRMLS
- 2026-05-01 Price Changed $239,990 CRMLS
- 2026-04-09 Price Changed $269,000 CRMLS
- 2025-12-15 Listed $290,000 CRMLS
- 2023-10-06 Sold (MLS) $165,000 CRMLS
- 2023-09-25 Pending — CRMLS
- 2023-08-28 Contingent — CRMLS
- 2023-07-18 Price Changed $175,000 CRMLS
- 2023-05-19 Listed $178,000 CRMLS
Cash-flow waterfall
monthlySold comps — $/sqft
last 12 mo · ≤1 miLoading sold comps…