 Multi-family
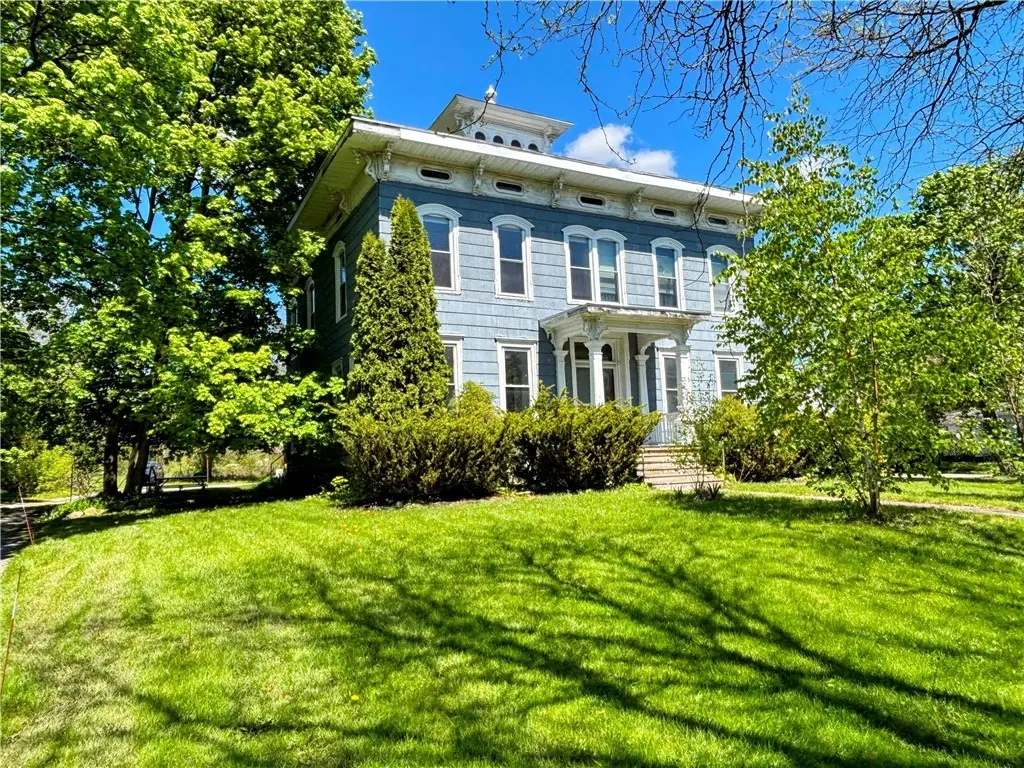
336 Gibson St · Canandaigua, NY
Flood risk 1/10 · Minimal
- FEMA flood zone
- X
- Chance of flooding over 30 yrs
- 0.0%
- Est. flood insurance / yr
- $473 – $860
Fire risk 3/10 · Minor
- Est. fire insurance / yr
- $691 – $1,283
Heat risk 2/10 · Minimal
- Hot days now (above 96°F)
- 7 days/yr
- Hot days in 30 yrs
- 15 days/yr
Wind risk 1/10 · Minimal
- Chance of severe wind over 30 yrs
- —
Air-quality risk 2/10 · Minimal
- Unhealthy air days now
- 0 days/yr
- Unhealthy air days in 30 yrs
- 1 days/yr
Risk factors via First Street. Map © Google.
Why this score? — see what drove the B grade
The composite is a weighted blend of 9 inputs, each scored 0–100. Each bar is that input's sub-score; the figure is the points it added to the 100-point composite (weight × sub-score).
- Cash flow +30.0/30.0
- 1% rule +10.0/10.0
- DSCR +10.0/10.0
- ARV discount +7.5/15.0
- Schools +4.7/10.0
- Rent growth +4.6/5.0
- Livability +3.8/5.0
- Condition / age +2.5/5.0
- Appreciation +0.0/10.0
$399,900
🖨 Deal sheet 📄 Offer letter ✓ Due diligence
Multi-family units
County records classify this as Multi-Family (5+ Unit). Listing-text estimate: 1 unit. estimate disagrees with records
5+ unit building — per-unit beds/baths from public records are typically unavailable; the breakdown below (if shown) is an estimate from the listing text.
Listing remarks
RARE OPPORTUNITY!! TRUE CASH COW IN THE HEART OF THE HISTORIC TOWN OF CANANDAIGUA! THIS EXCEPTIONAL MULTI-UNIT INVESTMENT PROPERTY FEATURES SIX SPACIOUS TWO-BEDROOM RENTAL UNITS SITUATED ON OVER HALF AN ACRE, OFFERING STRONG INCOME POTENTIAL IN ONE OF THE FINGER LAKES' MOST SOUGHT-AFTER COMMUNITIES. A WRAPAROUND DRIVEWAY AND EXPANSIVE PARKING AREA PROVIDE ADDED CONVENIENCE FOR TENANTS AND VISITORS ALIKE. IDEALLY LOCATED NEAR THE VIBRANT SHOPS, RESTAURANTS, AND AMENITIES OF DOWNTOWN CANANDAIGUA, RESIDENTS ENJOY EASY ACCESS TO CANANDAIGUA LAKE, KERSHAW PARK, SONNENBERG GARDENS & MANSION, AND THE RENOWNED CMAC PERFORMING ARTS CENTER. WITH ITS PRIME LOCATION, CONSISTENT RENTAL APPEAL, AND
Key facts
- Wraparound driveway
- Near restaurants
- Near vibrant shops
Tags
Property features AI
Finance
- Financial info: 6 total units; Gross income reported at $26,400; Operating expenses reported at $11,600 (includes fuel, insurance, maintenance structure, maintenance, trash, water/sewer); 7 separate electric meters; 1 separate gas meter
Exterior
- Parking: Driveway with two parking spaces; No garage
- Utilities: Public water connected; Sewer connected; Cable available; High-speed internet available
- Home design: 2-story building; Resale property
- Construction: Composite and wood siding; Asphalt roof; Existing structure
- Exterior features: Gravel driveway; Rectangular residential lot; City street frontage; Lot dimensions approx. 125 x 226
Interior
- Kitchen: Electric oven; Electric range; Refrigerator
- Flooring: Carpet; Hardwood; Vinyl; Varies
- Heating & cooling: Gas forced-air heating
- Interior features: Thermal windows; Unfurnished
- Laundry & utility: Gas water heater
Neighborhood map
What this means for you Summary
Snapshot
- This is a 6-bed/?-bath multifamily listed at $400k.
Deal economics
- At list price, monthly cash flow is $4k ($50k/yr) — positive.
- The deal already cash-flows at list — no discount required.
- Meets the 1% rule at list price ($9k rent vs $400k).
- Cap rate 18.9% vs local median 3.4% in Canandaigua — top-decile yield for the area; either an underpriced asset or a hidden risk that comps aren't pricing in. Stress-test before assuming the spread holds.
Location & tenants
- Location reads 75/100 on livability (#243 in NY, #3,822 nationally) — a middle-class / working-renter tenant base. Strengths: commute A+, housing A+, schools B+; Watch: employment C-, amenities F, health & safety D-.
- Canandaigua City School District (suburban): math 50% / reading 59% proficiency, ranked #305 of 590 in NY (top 52%) — acceptable for families but not a draw, mixed tenant base, ~2y average lease.
- Market conditions: Rents rising fast (+8.5%/yr); 223 active listings in the ZIP; solid renter incomes; 284 units permitted in Ontario County in 2024 (69 in 5+ unit buildings).
- At $8,906/mo this rent would consume 134% of the median local household income ($80k/yr) (locally 737% of renters already pay >50% of income on rent) — very limited rent-growth headroom before tenants either downsize or default.
Forward outlook
- Local home prices are declining (-3.0%/yr); year-one equity from $3k of loan paydown is wiped out by about $12k of value loss. Plan a longer hold.
- Ontario County population projected to shrink 6% by 2050 — rents likely to lag national; underwrite the cash flow, not the appreciation.
- At projected returns (-3.0% appreciation + 8.0% rent growth), your $112k cash investment doubles in ~3 years — after that, you're playing with house money.
Negotiation context
- Only 14 days on market — expect competitive offers; lowballing is unlikely to land.
- Current owner paid $155k; list at $400k implies a 158% gain — meaningful room to come down on a strong offer.
Risks & watch-outs
- Watch-outs: built in 1900 — expect roof / HVAC / electrical / plumbing capex.
Questions for the listing agent
- Built in 1900 — when were the roof, HVAC, electrical panel, plumbing, and water heater last replaced?
- Is there a deadline driving the sale (1031 exchange, divorce, estate, relocation)? That informs how much negotiation room exists.
- Schools are B-rated — typically a magnet for longer-tenancy family renters. What's the average tenant stay here, and is there a school-zone premium baked into asking?
- What's the average days-on-market for RENTAL listings here right now (not sales)? A rising rental-DOM trend means longer vacancies and softer asking-rent achievability than the comps imply.
- What's the recent tenant-quality profile in this submarket — average credit score on applications, eviction rate, late-payment / NSF rate, and stable-employment percentage? A property-management company in the area should have these aggregated.
- How much new apartment / multifamily construction is in the pipeline within 1–3 miles? Heavy new supply (>2% of stock underway) typically softens rents 12–24 months out; light construction supports rent growth.
Investment metrics
- 1% rule
- 2.23% ✓
- Cap rate
- 18.90%
- Cash-on-cash
- 45.01%
- DSCR
- 3.00
- GRM
- 3.7
CMA / ARV
No comps found within radius.
Projected returns pro-forma
-3.0% appreciation · 8.0% rent growth · sell at horizon
- IRR
- 47.7%
- Equity multiple
- 3.23×
- Total profit
- $249,958
- Equity at exit
- $59,626
- IRR
- 55.5%
- Equity multiple
- 7.94×
- Total profit
- $777,068
- Equity at exit
- $34,576
Cash invested: $111,972 (down + closing). Projections, not guarantees.
Landlord ↔ Tenant lean methodology
- Overall (STATE)
- 15 Strongly Tenant-Friendly
- State New York
- 15 Strongly Tenant-Friendly · D+10
- County
- — inherits STATE
- City
- — inherits STATE
ZIP-level market 14424
- Home prices YoY
- -21.2%
- Rents YoY
- 8.5%
- Active inventory
- 223
- Price-to-rent
- 22.5×
Monthly cashflow live
- Estimated rent
- $8,906 medium interval (Pro) →
- Mortgage (P&I)
- −$2,097
- Tax from tax record
- −$572 /mo · $6,861/yr
- Insurance
- −$167
- HOA
- −$0
- Vacancy / Maint / Mgmt
- −$1,870
- Net cashflow
- $4,200
Break-even live
6-unit breakdown (identical units grouped — click to expand)
| Units | Beds | Baths | Est. rent |
|---|---|---|---|
| 6× units | 2 | 1.5 | $8,904 |
| #1 | 2 | 1.5 | $1,484 |
| #2 | 2 | 1.5 | $1,484 |
| #3 | 2 | 1.5 | $1,484 |
| #4 | 2 | 1.5 | $1,484 |
| #5 | 2 | 1.5 | $1,484 |
| #6 | 2 | 1.5 | $1,484 |
| Total (6 units) | $8,906 | ||
UW: 25.0% down · 7.5% · 30yr · 1.5% tax · 5.0% vac · 8.0% maint · 8.0% mgmt
Financing live
Cash to close
- Down payment
- $99,975
- Closing costs
- $11,997
- Reserves months
- —
- Total cash needed
- —
Loan-product check · same deal, 3 products live
Conventional
25% down · 7.5% · 30yr
- Down + closing
- —
- Monthly P&I
- —
- Monthly cashflow
- —
- DSCR
- —
- Eligible?
- —
Personal DTI + credit; lowest rate.
DSCR
20% down · 8.5% · 30yr
- Down + closing
- —
- Monthly P&I
- —
- Monthly cashflow
- —
- DSCR
- —
- Eligible?
- —
No personal income docs; deal must DSCR.
Hard money
10% down · 12.0% · 12mo
- Down + closing
- —
- Monthly P&I
- —
- Monthly cashflow
- —
- DSCR
- —
- Eligible?
- —
Short-term bridge; refi at stabilization.
Listing history 11 events
-
2026-06-18days on market $399,900 Active 14 DOM
-
2026-06-17days on market $399,900 Active 13 DOM
-
2026-06-16days on market $399,900 Active 12 DOM
-
2026-06-15days on market $399,900 Active 11 DOM
-
2026-06-13days on market $399,900 Active 9 DOM
-
2026-06-13days on market $399,900 Active 8 DOM
-
2026-06-10days on market $399,900 Active 6 DOM
-
2026-06-09days on market $399,900 Active 5 DOM
-
2026-06-09days on market $399,900 Active 4 DOM
-
2026-06-07remarks 695-char remark
-
2026-06-07$399,900 Active 3 DOM
ⓘ Source: listings_history table (triggers on properties + properties_extension) + one-shot
backfill from property_details.listing_events for pre-trigger history.
Tax reassessment forecast NY · Partial reset (capped growth)
- Current annual tax
- $6,861 · $572/mo
- Projected year-2 tax
- $6,861 · $572/mo
- Expected delta
- $0/yr ($0/mo · 0.0%)
ⓘ Screening estimate from a state-policy table — verify with the county assessor before closing.
Climate risk First Street
- Flood 1/10 Low FEMA zone X · 0% chance over 30 yrs
- Wildfire 3/10 Moderate
- Heat 2/10 Low 7 d/yr ≥96°F today · 15 d/yr by 30 yrs out
- Wind 1/10 Low
- Air quality 2/10 Low 0 unhealthy d/yr today · 1 by 30 yrs out
Nearby sold comps map
Loading sold comps map…
Walkable amenities ~0.75 mi
Loading nearby amenities…
Taxation est. · year 1
- Rental income
- $106,872
- − Mortgage interest
- −$22,401
- − Property taxes
- −$6,861
- − Insurance
- −$2,000
- − Repairs & maintenance
- −$8,550
- − Management
- −$8,550
- − Depreciation
- −$11,633
- Taxable income
- $46,878
- Est. tax owed @ 24.0%
- −$11,251
- After-tax cash flow
- $39,152/yr
For passive investors: Depreciation is non-cash, so a rental often shows a tax loss while cash-flowing — sheltering income. Rental losses are passive: they offset passive income freely, and up to $25,000/yr can offset ordinary (W-2) income if you actively participate and your MAGI is under $100k (phasing out to $0 by $150k); unused losses carry forward. On sale, claimed depreciation is recaptured at up to 25%, and gains may owe capital-gains tax (a 1031 exchange can defer both). Figures are a year-1 estimate at your 24.0% rate — not tax advice; consult a CPA.
Schools (NCES district)
- District
- Canandaigua City School District
- NCES district ID
- 3606330
- Math proficiency
- 50% ▼ -10.00%
- Reading proficiency
- 59% ▲ 4.00%
- Median HH income
- $56,375
- Composite
- 47.09/100
- National rank
- #2335
- State rank
- #305 of 590 in NY
Livability — Canandaigua
- Score
- 75/100
- State rank
- #243
- US rank
- #3822
Category grades
Schools grade is shown separately in the Schools card above.
Census & demographics
- Census place
- Canandaigua, NY
- County
- Ontario County · 58,989 people
- City population
- 28,786
- Metro
- Rochester, NY
- Population (ZIP)
- 28,786
- Household income
- $79,778
- Rent vs Own
- Severe rent burden
- 737.0
Population outlook (Ontario County) Hauer SSP2
- Today (2025)
- 111,230 people
- By 2030
- 111,401 · +0.2%
- By 2040
- 109,535 · -1.5%
- By 2050
- 104,895 · -5.7%
- By 2075
- 92,999 · -16.4%
- By 2100
- 73,723 · -33.7%
Race, ethnicity, and origin ACS 2023
- Neighborhood character
- Predominantly White (90%)
- Race & ethnicity
- White 90% Hispanic / Latino 5% Two or more races 5% Black 1%
- Common ancestry
- Romanian 4% Iranian 4% Slovak 3%
- Foreign-born
- 3% · Canada
- Languages at home
- 94% English-only · Spanish 3% German/W. Germanic 1% Arabic 1%
Political lean MEDSL · Ontario
- 2024 margin
- Toss-up / Even · D 49.4% · R 50.6%
- 2008→2024 swing
- -1.0pp toward R · 2008: -0.1pp · 2024: -1.2pp
- All cycles
- 2024: R+1.2 2020: R+0.0 2016: R+8.6 2012: R+1.6 2008: R+0.1
Not yet ingested
- Civics
- —
Market trends
- HPI YoY
- ▼ -70.94%
- Current HPI
- 263.755
- Rent YoY
- ▲ 8.46%
- Metro
- Rochester, NY
- State GDP YoY
- ▲ 2.60%
- F500 in state
- 92
Industry mix (Fortune 500 HQ in NY)
| Industry | F500 HQs | Revenue |
|---|---|---|
| Financial Services | 10 | $950B |
|
||
| Consumer Goods | 9 | $162B |
|
||
| Insurance | 4 | $225B |
|
||
| Telecommunications | 2 | $144B |
|
||
| Pharmaceuticals | 2 | $112B |
|
||
| Media / Entertainment | 2 | $69B |
|
||
Price history
+158.0% since first listed2 events — show timeline
- 2026-06-04 Listed $399,900 UNYREIS
- 1993-05-14 Sold (Public Records) $155,000 Public Records
Property tax history
+4.1%/yrLatest (2025): $6,861 · -2.3% YoY. Source: county tax records.
Cash-flow waterfall
monthlySold comps — $/sqft
last 12 mo · ≤1 miLoading sold comps…