518 NW 6th St · Checotah, OK
Flood risk 1/10 · Minimal
- FEMA flood zone
- X (unshaded)
- Chance of flooding over 30 yrs
- 0.0%
- Est. flood insurance / yr
- $507 – $1,088
Fire risk 6/10 · Moderate
- Est. fire insurance / yr
- $2,463 – $4,575
Heat risk 6/10 · Moderate
- Hot days now (above 111°F)
- 7 days/yr
- Hot days in 30 yrs
- 19 days/yr
Wind risk 3/10 · Minor
- Chance of severe wind over 30 yrs
- 6.0%
Air-quality risk 2/10 · Minimal
- Unhealthy air days now
- 1 days/yr
- Unhealthy air days in 30 yrs
- 2 days/yr
Risk factors via First Street. Map © Google.
Why this score? — see what drove the B- grade
The composite is a weighted blend of 9 inputs, each scored 0–100. Each bar is that input's sub-score; the figure is the points it added to the 100-point composite (weight × sub-score).
- Cash flow +26.1/30.0
- Appreciation +10.0/10.0
- DSCR +8.8/10.0
- ARV discount +7.5/15.0
- 1% rule +5.7/10.0
- Livability +3.0/5.0
- Rent growth +2.5/5.0
- Schools +2.5/10.0
- Condition / age +2.5/5.0
$72,000
🖨 Deal sheet (PDF) 📄 Offer letter ✓ Due diligence
Listing remarks
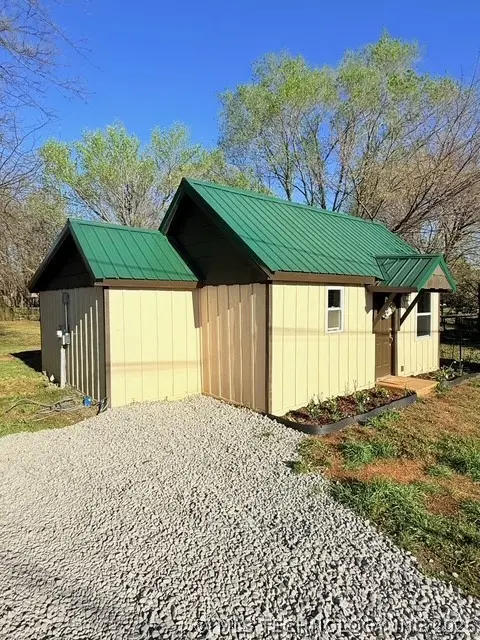
Welcome to 518 NW 6th Street in Checotah, Oklahoma! This fully remodeled 2 bedroom, 1 bathroom cottage offers like-new living space at an affordable price. Taken down to the studs and rebuilt, this home features a brand new metal roof, updated plumbing, new heat and air system, fresh paint, and all new flooring throughout. The exterior boasts charming curb appeal with a welcoming front entry and fresh landscaping, while the interior offers a clean, modern feel with updated finishes and an efficient layout. Perfect for a first-time home buyer, downsizer, or investment property. Don’t miss your opportunity to own a move-in ready home for just $85,000. Schedule your showing today!
Key facts
- New metal roof
- Fully remodeled
- Fresh paint
Tags
Property features AI
Exterior
- Security: No safety shelter
- Utilities: Electricity available; Public water; Public sewer
- Home design: Single-story home; Faces southeast
- Construction: Wood frame construction; Metal roof
- Exterior features: Deck; Porch; Mature trees; Sloped lot; Sloping topography
Interior
- Kitchen: Built-in range; Electric water heater
- Bedrooms: One bedroom on the first level
- Flooring: Vinyl
- Bathrooms: One full bathroom
- Heating & cooling: Electric heating; Zoned heating
- Interior features: Vinyl windows; Vinyl flooring; Solid surface counters; Electric oven connection
- Laundry & utility: Electric dryer hookup
Neighborhood map
What this means for you Summary
Snapshot
- This is a 1-bed/1.0-bath single-family listed at $72k.
Deal economics
- At list price, monthly cash flow is $182 ($2k/yr) — positive.
- The deal already cash-flows at list — no discount required.
- Meets the 1% rule at list price ($767 rent vs $72k).
- Recommended offer: $68k (6.0% below list) — sets the bar for market timing.
- Cap rate 9.3% vs local median 3.8% in Checotah — top-decile yield for the area; either an underpriced asset or a hidden risk that comps aren't pricing in. Stress-test before assuming the spread holds.
Location & tenants
- Location reads 60/100 on livability (#328 in OK) — a middle-class / working-renter tenant base. Strengths: cost of living A+, housing A-, crime B; Watch: health & safety C-, schools F, amenities F.
- Checotah (town): math 32% / reading 28% proficiency, ranked #72 of 270 in OK (top 27%) — families likely to look elsewhere, expect single-tenant / working-renter base with shorter leases; 72% free/reduced lunch — lower-income household profile, screen leases tightly.
- Market conditions: 147 active listings in the ZIP; 20 units permitted in McIntosh County in 2024 (0 in 5+ unit buildings).
Forward outlook
- In year one you build about $8k of equity ($498 loan paydown + $7k appreciation (10.0% local appreciation)).
- McIntosh County population projected at -17% by 2050 — secular population decline; favor cash flow + early exit over multi-decade hold.
- At projected returns (10.0% appreciation + 3.0% rent growth), your $20k cash investment doubles in ~2 years — after that, you're playing with house money.
- By year 5, paydown + projected appreciation supports a ~$36k cash-out refi (75% LTV) — recoverable capital for the next deal without selling this one.
Negotiation context
- It's been on market 84 days — a 6% lower offer ($68k) is reasonable based on typical stale-listing flexibility.
- Current owner paid $10k; list at $72k implies a 620% gain — meaningful room to come down on a strong offer.
Risks & watch-outs
- Watch-outs: built in 1935 — expect roof / HVAC / electrical / plumbing capex.
- Climate carrying-cost: major wildfire risk; extreme-heat days projected 7→19/yr by 2055 (HVAC capex compounding) — expect insurance premiums to compound above CPI over the hold.
Questions for the listing agent
- It's been on market 84 days. Have you received any prior offers? Is the seller open to a 6% concession, seller financing, or rate buy-down credit?
- Built in 1935 — when were the roof, HVAC, electrical panel, plumbing, and water heater last replaced?
- Why hasn't it sold? Are there any deal-killer items the seller is aware of (foundation, flood, title, zoning, code violations)?
- Is there a deadline driving the sale (1031 exchange, divorce, estate, relocation)? That informs how much negotiation room exists.
- Schools are F-rated, which usually means shorter tenancies and higher turnover. Who's the typical renter profile here, and what's been the actual vacancy rate?
- What's the average days-on-market for RENTAL listings here right now (not sales)? A rising rental-DOM trend means longer vacancies and softer asking-rent achievability than the comps imply.
- What's the recent tenant-quality profile in this submarket — average credit score on applications, eviction rate, late-payment / NSF rate, and stable-employment percentage? A property-management company in the area should have these aggregated.
- How much new for-sale + rental construction is in the pipeline within 1–3 miles? Heavy new supply typically softens prices + rents 12–24 months out; constrained supply supports both.
Investment metrics
- 1% rule
- 1.07% ✓
- Cap rate
- 9.33%
- Cash-on-cash
- 10.85%
- DSCR
- 1.48
- GRM
- 7.8
CMA / ARV
No comps found within radius.
Projected returns pro-forma
10.0% appreciation · 3.0% rent growth · sell at horizon
- IRR
- 32.2%
- Equity multiple
- 3.52×
- Total profit
- $50,788
- Equity at exit
- $64,863
- IRR
- 27.8%
- Equity multiple
- 7.96×
- Total profit
- $140,365
- Equity at exit
- $139,880
Cash invested: $20,160 (down + closing). Projections, not guarantees.
Landlord ↔ Tenant lean methodology
- Overall (STATE)
- 83 Strongly Landlord-Friendly
- State Oklahoma
- 83 Strongly Landlord-Friendly · R+20
- County
- — inherits STATE
- City
- — inherits STATE
ZIP-level market 74426
- Home prices YoY
- 5.3%
- Active inventory
- 147
- Price-to-rent
- 7.8×
Monthly cashflow live
- Estimated rent
- $767 medium interval (Pro) →
- Mortgage (P&I)
- −$378
- Tax from tax record
- −$16 /mo · $196/yr
- Insurance
- −$30
- HOA
- −$0
- Vacancy / Maint / Mgmt
- −$161
- Net cashflow
- $182
Break-even live
Sensitivity live
| Price | -10% $223 | -5% $203 | +0% $182 | +5% $162 | +10% $142 |
|---|---|---|---|---|---|
| Rent | -10% $122 | -5% $152 | +0% $182 | +5% $213 | +10% $243 |
| Rate | -1.0pp $219 | -0.5pp $201 | base $182 | +0.5pp $164 | +1.0pp $145 |
UW: 25.0% down · 7.5% · 30yr · 1.5% tax · 5.0% vac · 8.0% maint · 8.0% mgmt
Financing live
Cash to close
- Down payment
- $18,000
- Closing costs
- $2,160
- Reserves months
- —
- Total cash needed
- —
Loan-product check · same deal, 3 products live
Conventional
25% down · 7.5% · 30yr
- Down + closing
- —
- Monthly P&I
- —
- Monthly cashflow
- —
- DSCR
- —
- Eligible?
- —
Personal DTI + credit; lowest rate.
DSCR
20% down · 8.5% · 30yr
- Down + closing
- —
- Monthly P&I
- —
- Monthly cashflow
- —
- DSCR
- —
- Eligible?
- —
No personal income docs; deal must DSCR.
Hard money
10% down · 12.0% · 12mo
- Down + closing
- —
- Monthly P&I
- —
- Monthly cashflow
- —
- DSCR
- —
- Eligible?
- —
Short-term bridge; refi at stabilization.
Listing history 15 events
-
2026-06-16status $72,000 Pending 84 DOM
-
2026-06-15days on market $72,000 Active 84 DOM
-
2026-06-13days on market $72,000 Active 82 DOM
-
2026-06-12days on market $72,000 Active 81 DOM
-
2026-06-09pricedays on market $72,000 Active 78 DOM
-
2026-06-08days on market $80,000 Active 77 DOM
-
2026-06-08days on market $80,000 Active 76 DOM
-
2026-06-07days on market $80,000 Active 75 DOM
-
2026-06-04days on market $80,000 Active 72 DOM
-
2026-06-02days on market $80,000 Active 71 DOM
-
2026-06-01days on market $80,000 Active 70 DOM
-
2026-05-31days on market $80,000 Active 69 DOM
-
2026-04-09price $80,000
-
2026-03-20$85,000 Active
-
2002-01-31soldstatus $10,000
ⓘ Source: listings_history table (triggers on properties + properties_extension) + one-shot
backfill from property_details.listing_events for pre-trigger history.
Tax reassessment forecast OK · Resets to sale price
- Current annual tax
- $196 · $16/mo
- Projected year-2 tax
- $648 · $54/mo
- Expected delta
- +$452/yr (+$38/mo · 230.6%)
ⓘ Screening estimate from a state-policy table — verify with the county assessor before closing.
Climate risk First Street
- Flood 1/10 Low FEMA zone X (unshaded) · 0% chance over 30 yrs
- Wildfire 6/10 Major
- Heat 6/10 Major 7 d/yr ≥111°F today · 19 d/yr by 30 yrs out
- Wind 3/10 Moderate 6% chance of damaging wind over 30 yrs
- Air quality 2/10 Low 1 unhealthy d/yr today · 2 by 30 yrs out
Nearby sold comps map
Loading sold comps map…
Walkable amenities ~0.75 mi
Loading nearby amenities…
Taxation est. · year 1
- Rental income
- $9,208
- − Mortgage interest
- −$4,033
- − Property taxes
- −$196
- − Insurance
- −$360
- − Repairs & maintenance
- −$737
- − Management
- −$737
- − Depreciation
- −$2,095
- Taxable income
- $1,051
- Est. tax owed @ 24.0%
- −$252
- After-tax cash flow
- $1,935/yr
For passive investors: Depreciation is non-cash, so a rental often shows a tax loss while cash-flowing — sheltering income. Rental losses are passive: they offset passive income freely, and up to $25,000/yr can offset ordinary (W-2) income if you actively participate and your MAGI is under $100k (phasing out to $0 by $150k); unused losses carry forward. On sale, claimed depreciation is recaptured at up to 25%, and gains may owe capital-gains tax (a 1031 exchange can defer both). Figures are a year-1 estimate at your 24.0% rate — not tax advice; consult a CPA.
Schools (NCES district)
- District
- Checotah
- NCES district ID
- 4007350
- Math proficiency
- 32% ▼ -7.00%
- Reading proficiency
- 28% ▼ -2.00%
- Median HH income
- $34,331
- Composite
- 24.73/100
- National rank
- #7607
- State rank
- #72 of 270 in OK
Livability — Checotah
- Score
- 60/100
- State rank
- #328
- US rank
- #18495
Category grades
Schools grade is shown separately in the Schools card above.
Census & demographics
- Census place
- Checotah, OK
- Population (ZIP)
- 9,482
Population outlook (McIntosh County) Hauer SSP2
- Today (2025)
- 18,935 people
- By 2030
- 18,272 · -3.5%
- By 2040
- 16,905 · -10.7%
- By 2050
- 15,771 · -16.7%
- By 2075
- 14,097 · -25.6%
- By 2100
- 12,572 · -33.6%
Race, ethnicity, and origin ACS 2023
- Neighborhood character
- Diverse neighborhood (Simpson 0.62)
- Race & ethnicity
- White 62% Native American 18% Two or more races 13% Hispanic / Latino 5% Black 3% Asian 2%
- Common ancestry
- Iranian 3% Slovak 2% Lithuanian 2%
- Foreign-born
- 2% · Canada
- Languages at home
- 94% English-only · German/W. Germanic 2% Other Indo-European 1% Spanish 1%
Political lean MEDSL · McIntosh
- 2024 margin
- Solid R (+52.7) · D 22.9% · R 75.7% · Other 1.4%
- 2008→2024 swing
- -33.5pp toward R · 2008: -19.3pp · 2024: -52.7pp
- All cycles
- 2024: R+52.7 2020: R+49.7 2016: R+42.5 2012: R+23.8 2008: R+19.3
Not yet ingested
- Civics
- —
Market trends
- HPI YoY
- ▲ 16.32%
- Current HPI
- 325.0751
- Rent YoY
- —
- Metro
- —
- State GDP YoY
- ▲ 1.55%
- F500 in state
- 6
Industry mix (Fortune 500 HQ in OK)
| Industry | F500 HQs | Revenue |
|---|---|---|
| Energy | 3 | $48B |
|
||
Price history
+700.0% since first listed3 events — show timeline
- 2026-04-09 Price Changed $80,000 MLS Technology, Inc.
- 2026-03-20 Listed $85,000 MLS Technology, Inc.
- 2002-01-31 Sold (Public Records) $10,000 Public Records
Property tax history
-0.6%/yrLatest (2025): $196 · +7.7% YoY. Source: county tax records.
Cash-flow waterfall
monthlySold comps — $/sqft
last 12 mo · ≤1 miLoading sold comps…