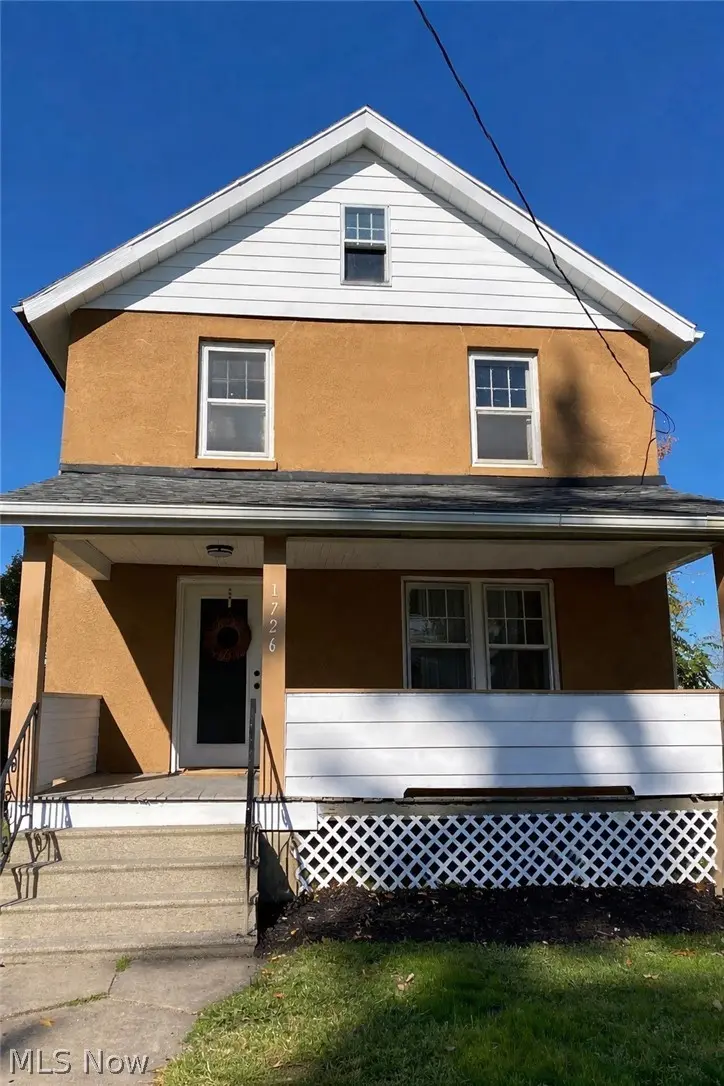
1726 Midland Ave · Youngstown, OH
Flood risk 1/10 · Minimal
- FEMA flood zone
- X (unshaded)
- Chance of flooding over 30 yrs
- 0.0%
- Est. flood insurance / yr
- $473 – $860
Fire risk 1/10 · Minimal
- Est. fire insurance / yr
- $713 – $1,323
Heat risk 3/10 · Minor
- Hot days now (above 97°F)
- 7 days/yr
- Hot days in 30 yrs
- 18 days/yr
Wind risk 1/10 · Minimal
- Chance of severe wind over 30 yrs
- —
Air-quality risk 2/10 · Minimal
- Unhealthy air days now
- 1 days/yr
- Unhealthy air days in 30 yrs
- 2 days/yr
Risk factors via First Street. Map © Google.
Why this score? — see what drove the D grade
The composite is a weighted blend of 9 inputs, each scored 0–100. Each bar is that input's sub-score; the figure is the points it added to the 100-point composite (weight × sub-score).
- Cash flow +17.7/30.0
- ARV discount +7.5/15.0
- DSCR +5.5/10.0
- Livability +4.0/5.0
- 1% rule +3.6/10.0
- Rent growth +2.5/5.0
- Condition / age +2.5/5.0
- Schools +0.9/10.0
- Appreciation +0.0/10.0
$115,000
🖨 Deal sheet (PDF) 📄 Offer letter ✓ Due diligence
Listing remarks MLS
Calling all investors ! don't miss this one. schedule your showing for this three bedroom 1.5 bath before its gone. Just needs a little TLC.
Key facts
- New furnace
- Renovated bathroom
- New main water line
Tags
Property features AI
Exterior
- Parking: No garage
- Utilities: Public water; Public sewer
- Home design: Two-story stucco home; Asphalt roof
- Construction: Stucco construction; Asphalt roof
- Exterior features: Lot approximately 0.132 acres; Updated/remodeled condition
Interior
- Kitchen: Microwave; Range; Refrigerator
- Bathrooms: 1 full bathroom
- Heating & cooling: Forced air heating (gas); Ceiling fans for cooling
- Interior features: Double-pane windows; Ceiling fan(s); Chandelier; Laminate counters; Unfinished concrete basement
- Laundry & utility: Laundry in basement
Neighborhood map
What this means for you Summary
Snapshot
- This is a 3-bed/1.0-bath single-family listed at $115k.
Deal economics
- At list price, monthly cash flow is $93 ($1k/yr) — positive.
- The deal already cash-flows at list — no discount required.
- To meet the 1% rule (rent ≥ 1% of price), the offer needs to be $99k (14.0% below list).
- Recommended offer: $99k (14.0% below list) — sets the bar for 1% rule.
Location & tenants
- Location reads 81/100 on livability (#99 in OH, #1,506 nationally) — a professional / high-income tenant draw. Strengths: amenities A+, commute A+, cost of living A+; Watch: crime F, employment F.
- Youngstown City (urban): math 8% / reading 17% proficiency, ranked #649 of 656 in OH (top 99%) — low school quality limits family demand, transient renter base, plan for 1-2y turnover; 88% free/reduced lunch — lower-income household profile, screen leases tightly.
- Market conditions: 66 active listings in the ZIP; 7 comparable units currently listed for rent nearby; rentals at typical pace (median 23d on market — plan ~3-4 weeks tenant-placement turnaround); lower-income renter base — watch delinquency; 147 units permitted in Mahoning County in 2024 (0 in 5+ unit buildings).
- This rent runs 33% of the median local income ($36k/yr) — at the standard rent-burdened threshold; future hikes will face affordability resistance.
Forward outlook
- Local home prices are declining (-3.0%/yr); year-one equity from $795 of loan paydown is wiped out by about $3k of value loss. Plan a longer hold.
- Mahoning County population projected at -14% by 2050 — secular population decline; favor cash flow + early exit over multi-decade hold.
Negotiation context
- It's been on market 72 days — a 6% lower offer ($108k) is reasonable based on typical stale-listing flexibility.
- 4 sale attempts since 4y ago with the ask held roughly flat each time — persistent listings suggest the price (not the market) is what's stuck; bring a comps-based counter.
- Current owner paid $34k; list at $115k implies a 233% gain — meaningful room to come down on a strong offer.
Risks & watch-outs
- Watch-outs: built in 1922 — expect roof / HVAC / electrical / plumbing capex.
Questions for the listing agent
- It's been on market 72 days. Have you received any prior offers? Is the seller open to a 14% concession, seller financing, or rate buy-down credit?
- Built in 1922 — when were the roof, HVAC, electrical panel, plumbing, and water heater last replaced?
- Why hasn't it sold? Are there any deal-killer items the seller is aware of (foundation, flood, title, zoning, code violations)?
- Is there a deadline driving the sale (1031 exchange, divorce, estate, relocation)? That informs how much negotiation room exists.
- Crime grade is F in this area — have there been break-ins, vandalism, or insurance claims at this property in the last 3 years? What carrier currently insures it and at what premium?
- The area grade is low — what's the realistic commute time and amenity access for the typical tenant pool here? Any planned neighborhood developments (good or bad) we should know about?
- What's the average days-on-market for RENTAL listings here right now (not sales)? A rising rental-DOM trend means longer vacancies and softer asking-rent achievability than the comps imply.
- What's the recent tenant-quality profile in this submarket — average credit score on applications, eviction rate, late-payment / NSF rate, and stable-employment percentage? A property-management company in the area should have these aggregated.
- How much new for-sale + rental construction is in the pipeline within 1–3 miles? Heavy new supply typically softens prices + rents 12–24 months out; constrained supply supports both.
Investment metrics
- 1% rule
- 0.86% ✗
- Cap rate
- 7.26%
- Cash-on-cash
- 3.46%
- DSCR
- 1.15
- GRM
- 9.7
CMA / ARV
- ARV (on-the-fly)
- $71,300
- Comps found
- 12
Show comp detail 12 sales within ~0.75 mi
| Address | Dist | Beds/Ba | Sqft | Sold | Price | $/sf | Match |
|---|---|---|---|---|---|---|---|
| 208 N Maryland Ave N | 0.23mi | 3/1.0 | 1,200 (+4%) | 3mo | $28,000 | $23 | 80 |
| 60 Steel St | 0.42mi | 3/1.0 | 1,216 (+6%) | 6mo | $75,000 | $62 | 66 |
| 130 N Portland Ave | 0.33mi | 3/1.0 | 1,285 (+12%) | 3mo | $90,000 | $70 | 63 |
| 110 S Maryland Ave | 0.64mi | 3/1.0 | 1,190 (+4%) | 2mo | $30,000 | $25 | 62 |
| 2306 Cherry Hill Ave | 0.54mi | 3/1.0 | 1,056 (-8%) | 2mo | $107,000 | $101 | 60 |
| 77 Fernwood Ave | 0.37mi | 3/2.0 | 1,255 (+9%) | 6mo | $50,000 | $40 | 58 |
| 38 S Hartford Ave | 0.71mi | 3/1.5 | 1,100 (-4%) | 4mo | $50,000 | $45 | 55 |
| 466 N Hazelwood Ave | 0.61mi | 3/1.0 | 1,287 (+12%) | 1mo | $48,000 | $37 | 51 |
| 634 N Hartford Ave | 0.50mi | 3/1.5 | 1,008 (-12%) | 6mo | $123,000 | $122 | 49 |
| 40 Manchester Ave | 0.66mi | 3/1.0 | 1,250 (+9%) | 7mo | $63,850 | $51 | 49 |
| 2453 Eddie St | 0.72mi | 3/1.0 | 1,068 (-7%) | 7mo | $92,000 | $86 | 49 |
| 459 N Schenley Ave | 0.70mi | 3/2.0 | 1,316 (+14%) | 2mo | $155,000 | $118 | 37 |
Match score weights: distance 35% · size 25% · config 20% · recency 20%. Top-matched comps best support the ARV.
Projected returns pro-forma
-3.0% appreciation · 3.0% rent growth · sell at horizon
- IRR
- -10.9%
- Equity multiple
- 0.60×
- Total profit
- $-12,773
- Equity at exit
- $17,147
- IRR
- -1.7%
- Equity multiple
- 0.88×
- Total profit
- $-3,714
- Equity at exit
- $9,943
Cash invested: $32,200 (down + closing). Projections, not guarantees.
Landlord ↔ Tenant lean methodology
- Overall (STATE)
- 73 Landlord-Friendly
- State Ohio
- 73 Landlord-Friendly · R+6
- County
- — inherits STATE
- City
- — inherits STATE
ZIP-level market 44509
- Home prices YoY
- -9.3%
- Active inventory
- 66
- Price-to-rent
- 9.7×
Monthly cashflow live
- Estimated rent
- $989 high interval (Pro) →
- Mortgage (P&I)
- −$603
- Tax from tax record
- −$37 /mo · $447/yr
- Insurance
- −$48
- HOA
- −$0
- Vacancy / Maint / Mgmt
- −$208
- Net cashflow
- $93
Break-even live
Sensitivity live
| Price | -10% $158 | -5% $125 | +0% $93 | +5% $60 | +10% $28 |
|---|---|---|---|---|---|
| Rent | -10% $15 | -5% $54 | +0% $93 | +5% $132 | +10% $171 |
| Rate | -1.0pp $151 | -0.5pp $122 | base $93 | +0.5pp $63 | +1.0pp $33 |
UW: 25.0% down · 7.5% · 30yr · 1.5% tax · 5.0% vac · 8.0% maint · 8.0% mgmt
Financing live
Cash to close
- Down payment
- $28,750
- Closing costs
- $3,450
- Reserves months
- —
- Total cash needed
- —
Loan-product check · same deal, 3 products live
Conventional
25% down · 7.5% · 30yr
- Down + closing
- —
- Monthly P&I
- —
- Monthly cashflow
- —
- DSCR
- —
- Eligible?
- —
Personal DTI + credit; lowest rate.
DSCR
20% down · 8.5% · 30yr
- Down + closing
- —
- Monthly P&I
- —
- Monthly cashflow
- —
- DSCR
- —
- Eligible?
- —
No personal income docs; deal must DSCR.
Hard money
10% down · 12.0% · 12mo
- Down + closing
- —
- Monthly P&I
- —
- Monthly cashflow
- —
- DSCR
- —
- Eligible?
- —
Short-term bridge; refi at stabilization.
Rent comps 7 comps
| Address | Beds | Baths | Sqft | Rent | $/sqft | DOM | Units | Dist |
|---|---|---|---|---|---|---|---|---|
| 35 Whitney Ave N Youngstown, OH | 3.0 | 1.0 | 1144 | $1,050 | $0.92 | 23d | 1 | 0.61mi |
| 2624 Oakwood Ave Unit 2632 Youngstown, OH | 3.0 | 1.0 | 1064 | $850 | $0.80 | 23d | 1 | 0.71mi |
| 2634 Austin Ave Youngstown, OH | 2.0 | 1.0 | 784 | $775 | $0.99 | 45d | 1 | 0.98mi |
| 2929 Roy St Youngstown, OH | 3.0 | 1.0 | 988 | $1,100 | $1.11 | 15d | 1 | 1.04mi |
| 3143 Mahoning Ave Youngstown, OH | 2.0 | 1.0 | 700 | $1,000 | $1.43 | 23d | 1 | 1.13mi |
| 913 Hawthorne St Youngstown, OH | 3.0 | 1.0 | 1198 | $1,080 | $0.90 | 23d | 1 | 1.34mi |
| 911 Hawthorne St Youngstown, OH | 3.0 | 1.0 | 1198 | $1,080 | $0.90 | 23d | 1 | 1.35mi |
Listing history 28 events
-
2026-06-21days on market $115,000 Active 72 DOM
-
2026-06-19days on market $115,000 Active 70 DOM
-
2026-06-18days on market $115,000 Active 69 DOM
-
2026-06-17days on market $115,000 Active 68 DOM
-
2026-06-16days on market $115,000 Active 67 DOM
-
2026-06-15days on market $115,000 Active 66 DOM
-
2026-06-14days on market $115,000 Active 64 DOM
-
2026-06-13days on market $115,000 Active 63 DOM
-
2026-06-10days on market $115,000 Active 61 DOM
-
2026-06-09days on market $115,000 Active 60 DOM
-
2026-06-08days on market $115,000 Active 59 DOM
-
2026-06-07days on market $115,000 Active 58 DOM
-
2026-06-03days on market $115,000 Active 54 DOM
-
2026-06-02days on market $115,000 Active 53 DOM
-
2026-06-01days on market $115,000 Active 52 DOM
-
2026-05-31days on market $115,000 Active 51 DOM
-
2026-05-30days on market $115,000 Active 50 DOM
-
2026-04-22price $115,000
-
2026-04-10$120,000 Active
-
2026-01-24price $120,000
-
2025-12-10price $129,500
-
2025-11-10price $129,900
-
2025-10-27$140,000 Active
-
2025-08-01soldstatus $34,500 Closed 140-char remark
Show marketing remark (140 chars)
Calling all investors ! don't miss this one. schedule your showing for this three bedroom 1.5 bath before its gone. Just needs a little TLC.
-
2025-06-19historical Contingent 140-char remark
Show marketing remark (140 chars)
Calling all investors ! don't miss this one. schedule your showing for this three bedroom 1.5 bath before its gone. Just needs a little TLC.
-
2025-06-11$36,000 Active 140-char remark
Show marketing remark (140 chars)
Calling all investors ! don't miss this one. schedule your showing for this three bedroom 1.5 bath before its gone. Just needs a little TLC.
-
2022-11-19historical
-
2022-05-19$19,900 Active
ⓘ Source: listings_history table (triggers on properties + properties_extension) + one-shot
backfill from property_details.listing_events for pre-trigger history.
Tax reassessment forecast OH · Partial reset (capped growth)
- Current annual tax
- $447 · $37/mo
- Projected year-2 tax
- $1,120 · $93/mo
- Expected delta
- +$674/yr (+$56/mo · 150.7%)
ⓘ Screening estimate from a state-policy table — verify with the county assessor before closing.
Climate risk First Street
- Flood 1/10 Low FEMA zone X (unshaded) · 0% chance over 30 yrs
- Wildfire 1/10 Low
- Heat 3/10 Moderate 7 d/yr ≥97°F today · 18 d/yr by 30 yrs out
- Wind 1/10 Low
- Air quality 2/10 Low 1 unhealthy d/yr today · 2 by 30 yrs out
Nearby sold comps map
Loading sold comps map…
Walkable amenities ~0.75 mi
Loading nearby amenities…
Taxation est. · year 1
- Rental income
- $11,864
- − Mortgage interest
- −$6,442
- − Property taxes
- −$447
- − Insurance
- −$575
- − Repairs & maintenance
- −$949
- − Management
- −$949
- − Depreciation
- −$3,345
- Taxable loss
- −$843
- Est. tax savings @ 24.0%
- +$202
- After-tax cash flow
- $1,316/yr
For passive investors: Depreciation is non-cash, so a rental often shows a tax loss while cash-flowing — sheltering income. Rental losses are passive: they offset passive income freely, and up to $25,000/yr can offset ordinary (W-2) income if you actively participate and your MAGI is under $100k (phasing out to $0 by $150k); unused losses carry forward. On sale, claimed depreciation is recaptured at up to 25%, and gains may owe capital-gains tax (a 1031 exchange can defer both). Figures are a year-1 estimate at your 24.0% rate — not tax advice; consult a CPA.
Schools (NCES district)
- District
- Youngstown City
- NCES district ID
- 3904516
- Math proficiency
- 8% ▼ -15.00%
- Reading proficiency
- 17% ▼ -10.00%
- Median HH income
- $25,257
- Composite
- 9.29/100
- National rank
- #9858
- State rank
- #649 of 656 in OH
Livability — Youngstown
- Score
- 81/100
- State rank
- #99
- US rank
- #1506
Category grades
Schools grade is shown separately in the Schools card above.
Census & demographics
- Census place
- Youngstown, OH
- County
- Mahoning · 224,175 people
- City population
- 28,503
- Metro
- Youngstown-Warren, OH
- Population (ZIP)
- 10,775
- Household income
- $36,472
- Rent vs Own
- Severe rent burden
- 10.4
Population outlook (Mahoning County) Hauer SSP2
- Today (2025)
- 223,932 people
- By 2030
- 218,387 · -2.5%
- By 2040
- 205,367 · -8.3%
- By 2050
- 193,606 · -13.5%
- By 2075
- 173,694 · -22.4%
- By 2100
- 151,147 · -32.5%
Race, ethnicity, and origin ACS 2023
- Neighborhood character
- Diverse neighborhood (Simpson 0.58)
- Race & ethnicity
- White 58% Black 27% Hispanic / Latino 9% Two or more races 8%
- Hispanic origin (detail)
- Puerto Rican 4%
- Common ancestry
- Slovak 2% Subsaharan African 2% Romanian 2%
- Foreign-born
- 3% · Canada
- Languages at home
- 93% English-only · Spanish 5%
Political lean MEDSL · Mahoning
- 2024 margin
- Lean R (+9.4) · D 44.9% · R 54.4%
- 2008→2024 swing
- -36.1pp toward R · 2008: 26.6pp · 2024: -9.4pp
- All cycles
- 2024: R+9.4 2020: R+1.9 2016: D+3.0 2012: D+27.7 2008: D+26.6
Not yet ingested
- Civics
- —
Market trends
- HPI YoY
- ▼ -22.34%
- Current HPI
- 217.0797
- Rent YoY
- —
- Metro
- —
- State GDP YoY
- ▲ 1.98%
- F500 in state
- 48
Industry mix (Fortune 500 HQ in OH)
| Industry | F500 HQs | Revenue |
|---|---|---|
| Insurance | 3 | $145B |
|
||
| Industrial Machinery | 3 | $49B |
|
||
| Financial Services | 3 | $24B |
|
||
| Consumer Goods | 2 | $93B |
|
||
| Aerospace / Defense | 2 | $47B |
|
||
| Utilities | 2 | $33B |
|
||
Price history
+477.9% since first listed11 events — show timeline
- 2026-04-22 Price Changed $115,000 MLSNOW
- 2026-04-10 Listed $120,000 MLSNOW
- 2026-01-24 Price Changed $120,000 MLSNOW
- 2025-12-10 Price Changed $129,500 MLSNOW
- 2025-11-10 Price Changed $129,900 MLSNOW
- 2025-10-27 Listed $140,000 MLSNOW
- 2025-08-01 Sold (MLS) $34,500 MLSNOW
- 2025-06-19 Contingent — MLSNOW
- 2025-06-11 Listed $36,000 MLSNOW
- 2022-11-19 Listing Removed — MLSNOW
- 2022-05-19 Listed $19,900 MLSNOW
Property tax history
+3.4%/yrLatest (2025): $447 · +168.7% YoY. Source: county tax records.
Cash-flow waterfall
monthlySold comps — $/sqft
last 12 mo · ≤1 miLoading sold comps…